Active Archive of Large Floods, 1985-Present
Master Index of Inundation Maps

Recent Flood Mapping Results
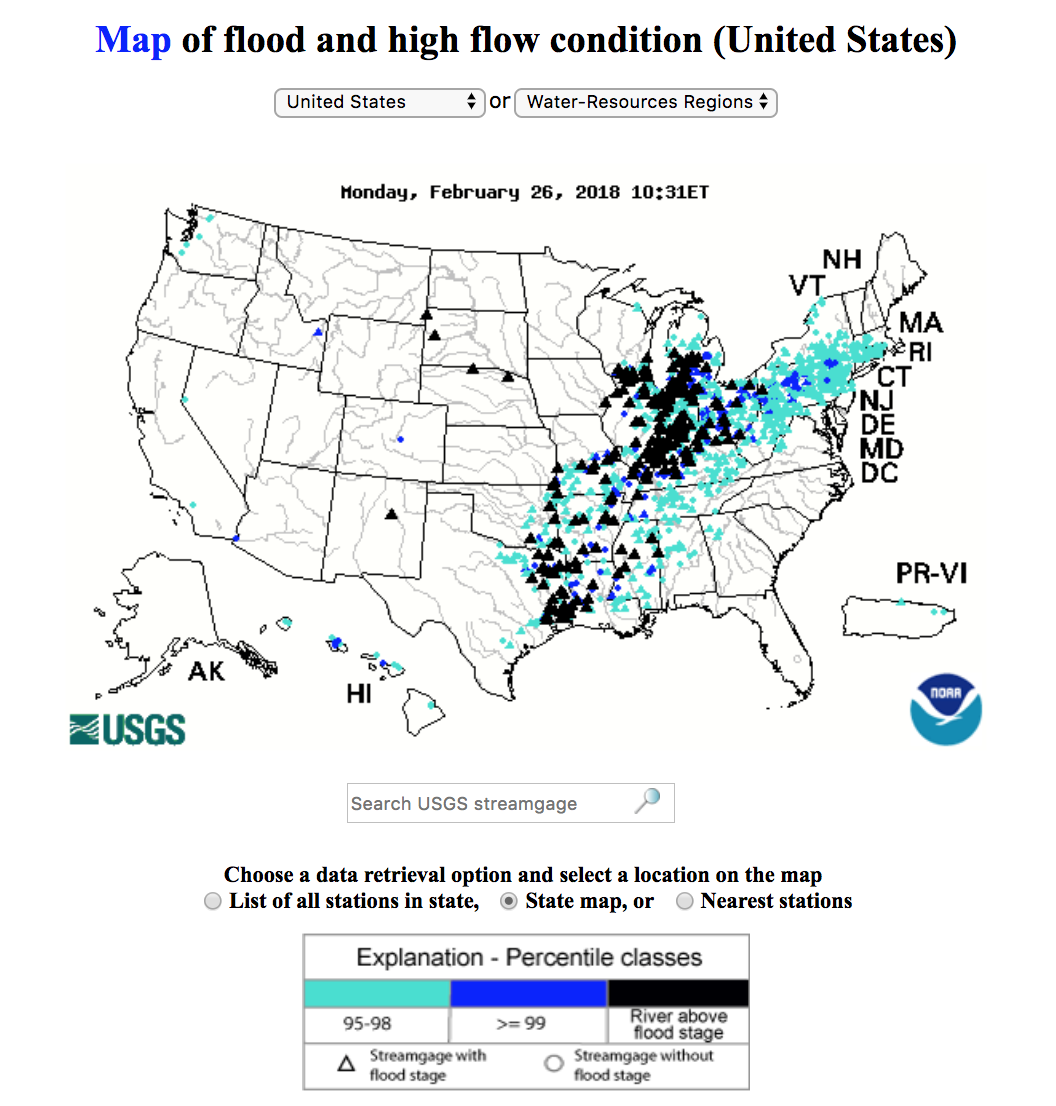
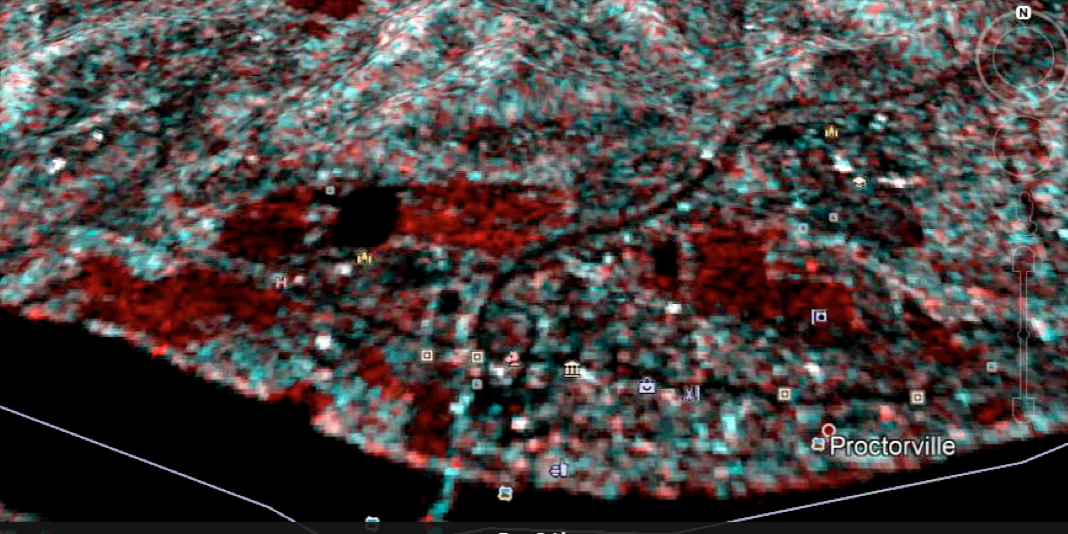
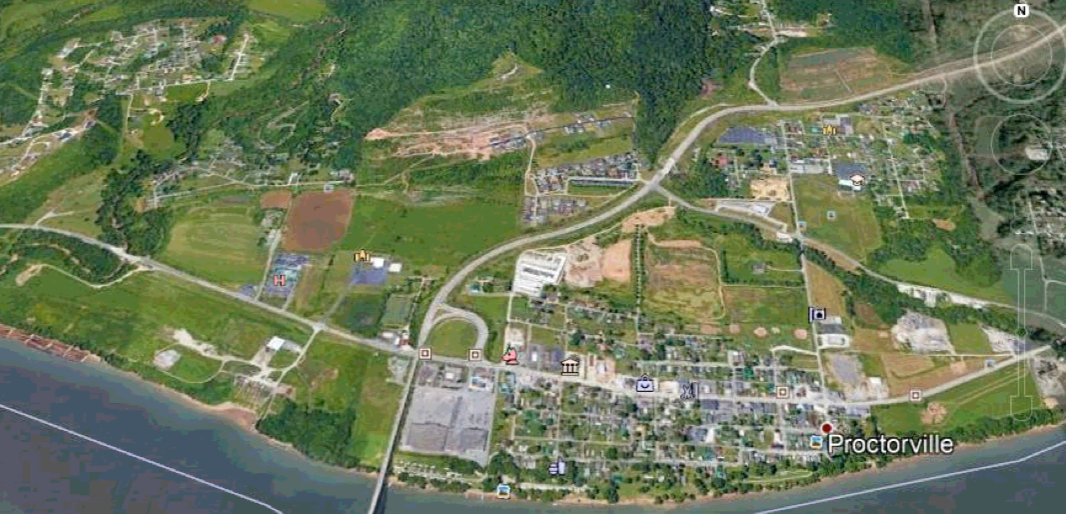
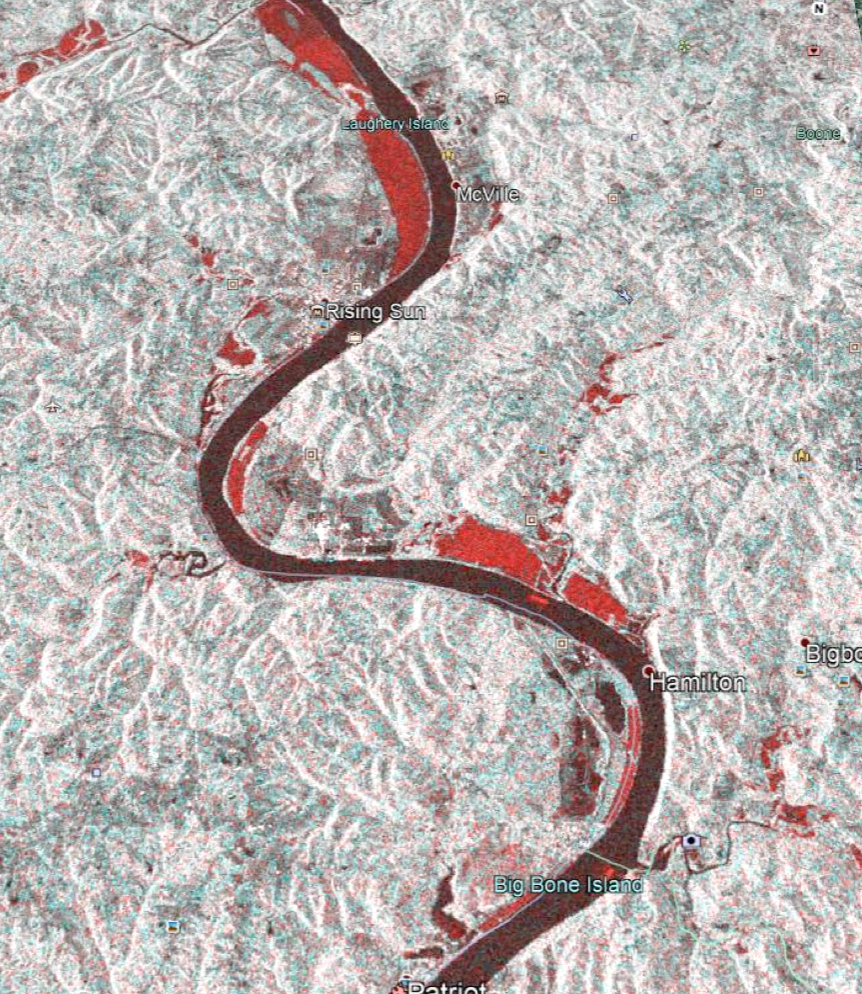
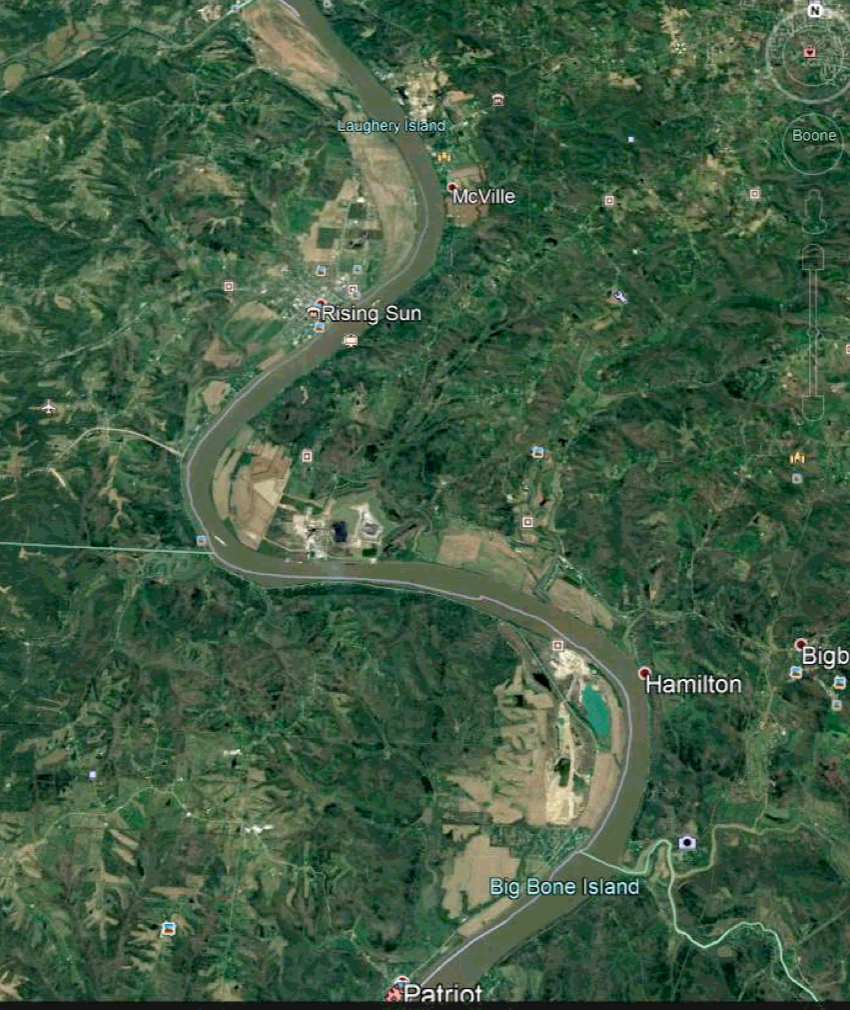
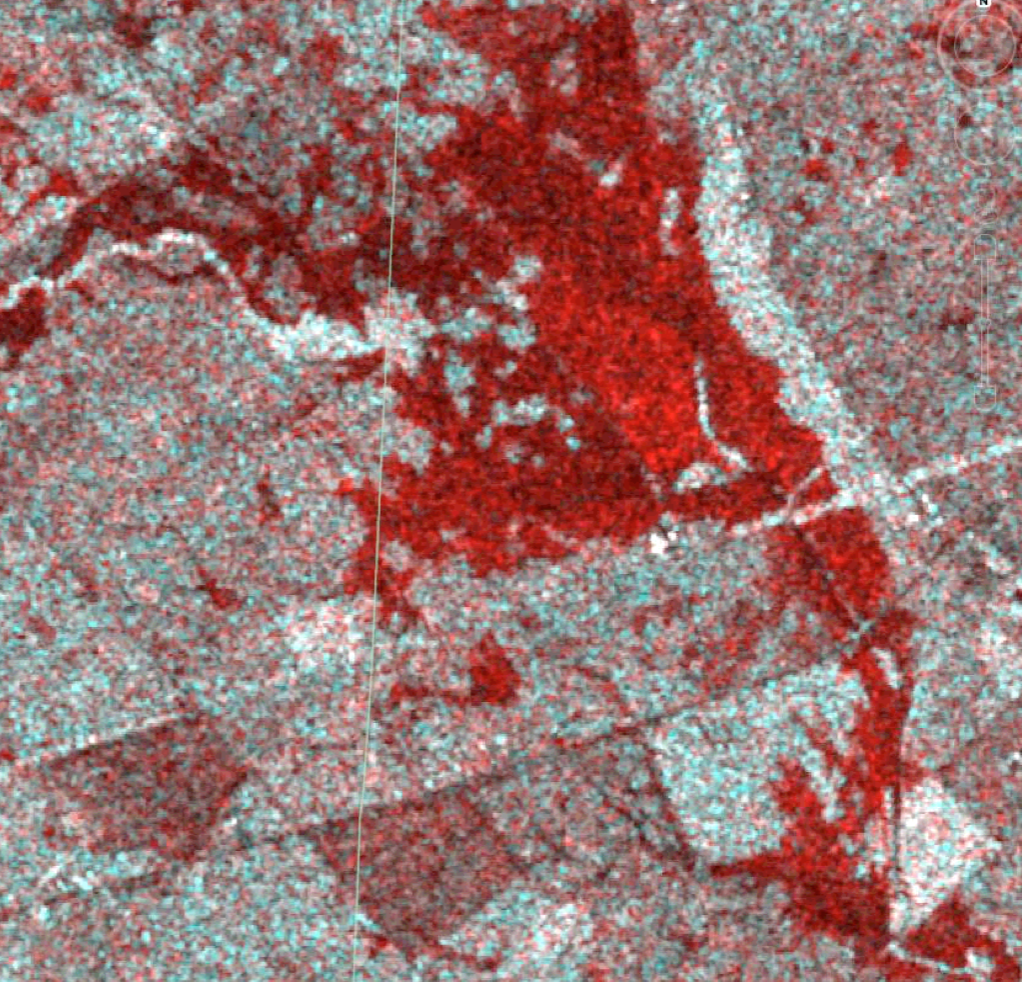
New: DFO's ESA/Copernicus Sentinel 1-based mapping of flooding in Central USA, February 26, 2018. Mapping in progress; map results posted here when available. See also the DFO Map Server with both the Sentinel 1 information and MODIS data from the automated processor.. Below is the gauging station information from USGS/NOAA and some sample Sentinel 1-based change detection images (flooding in red, February 25, 2018).
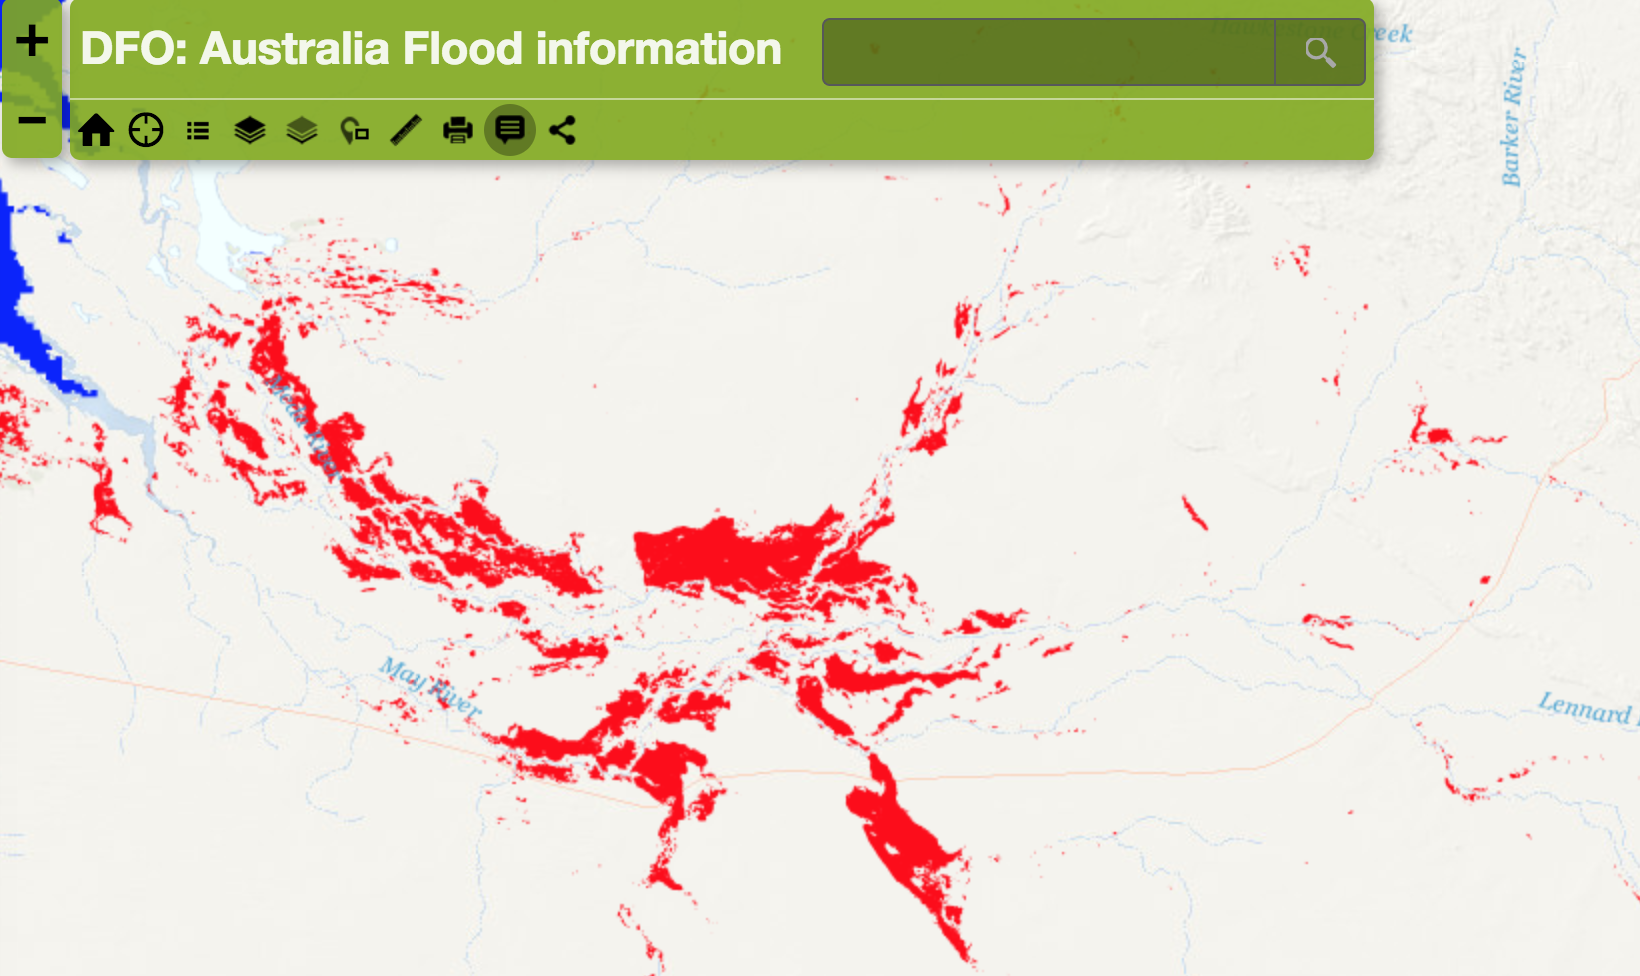
New: DFO's ESA/Copernicus Sentinel 1-based mapping of flooding in Australia, January 31, 2018. Mapping in progress; sample results below. See also the DFO Map Server.
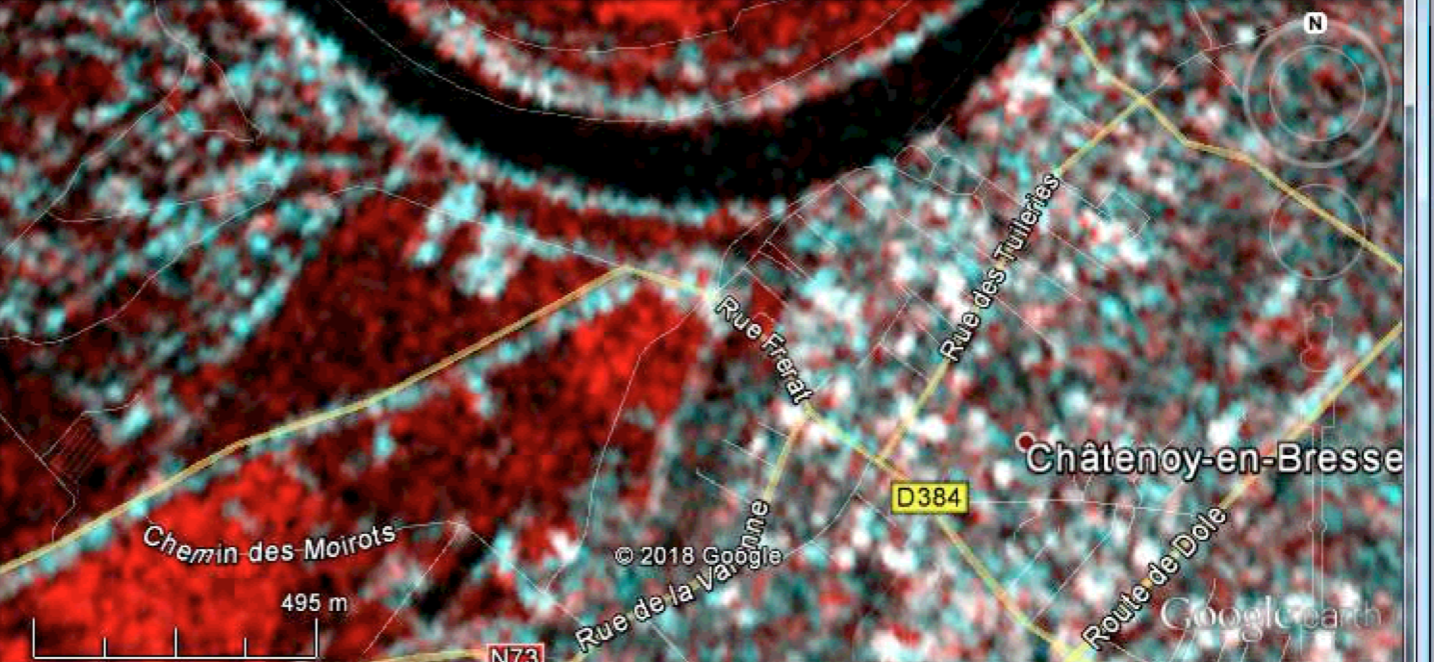
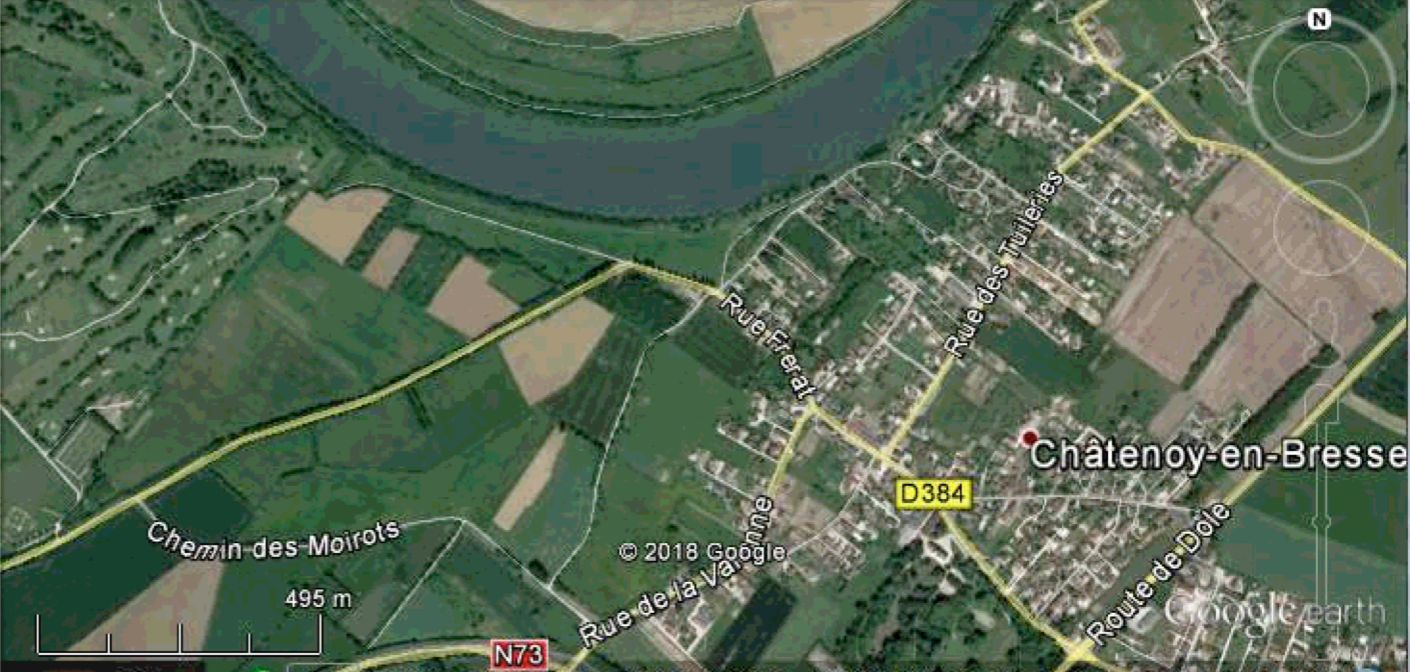
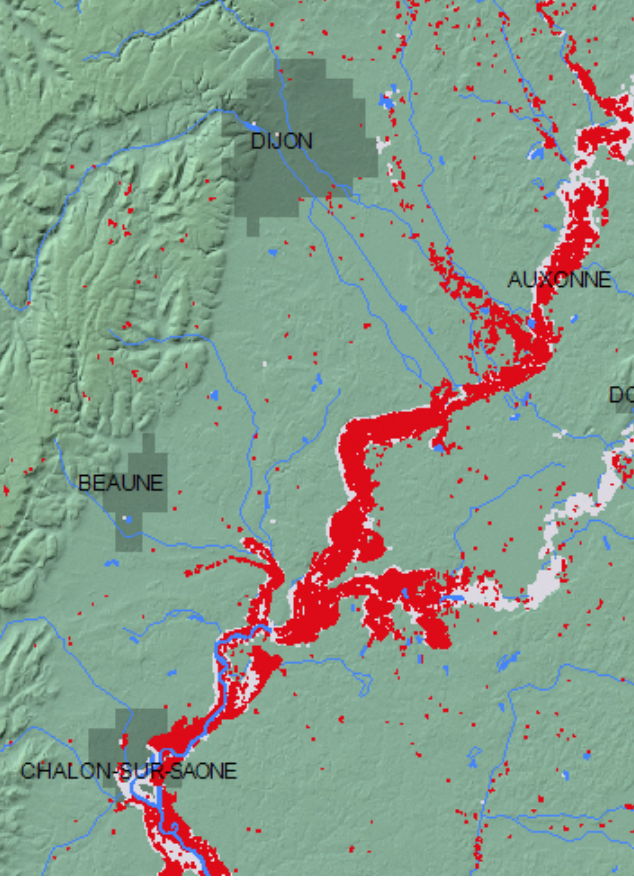
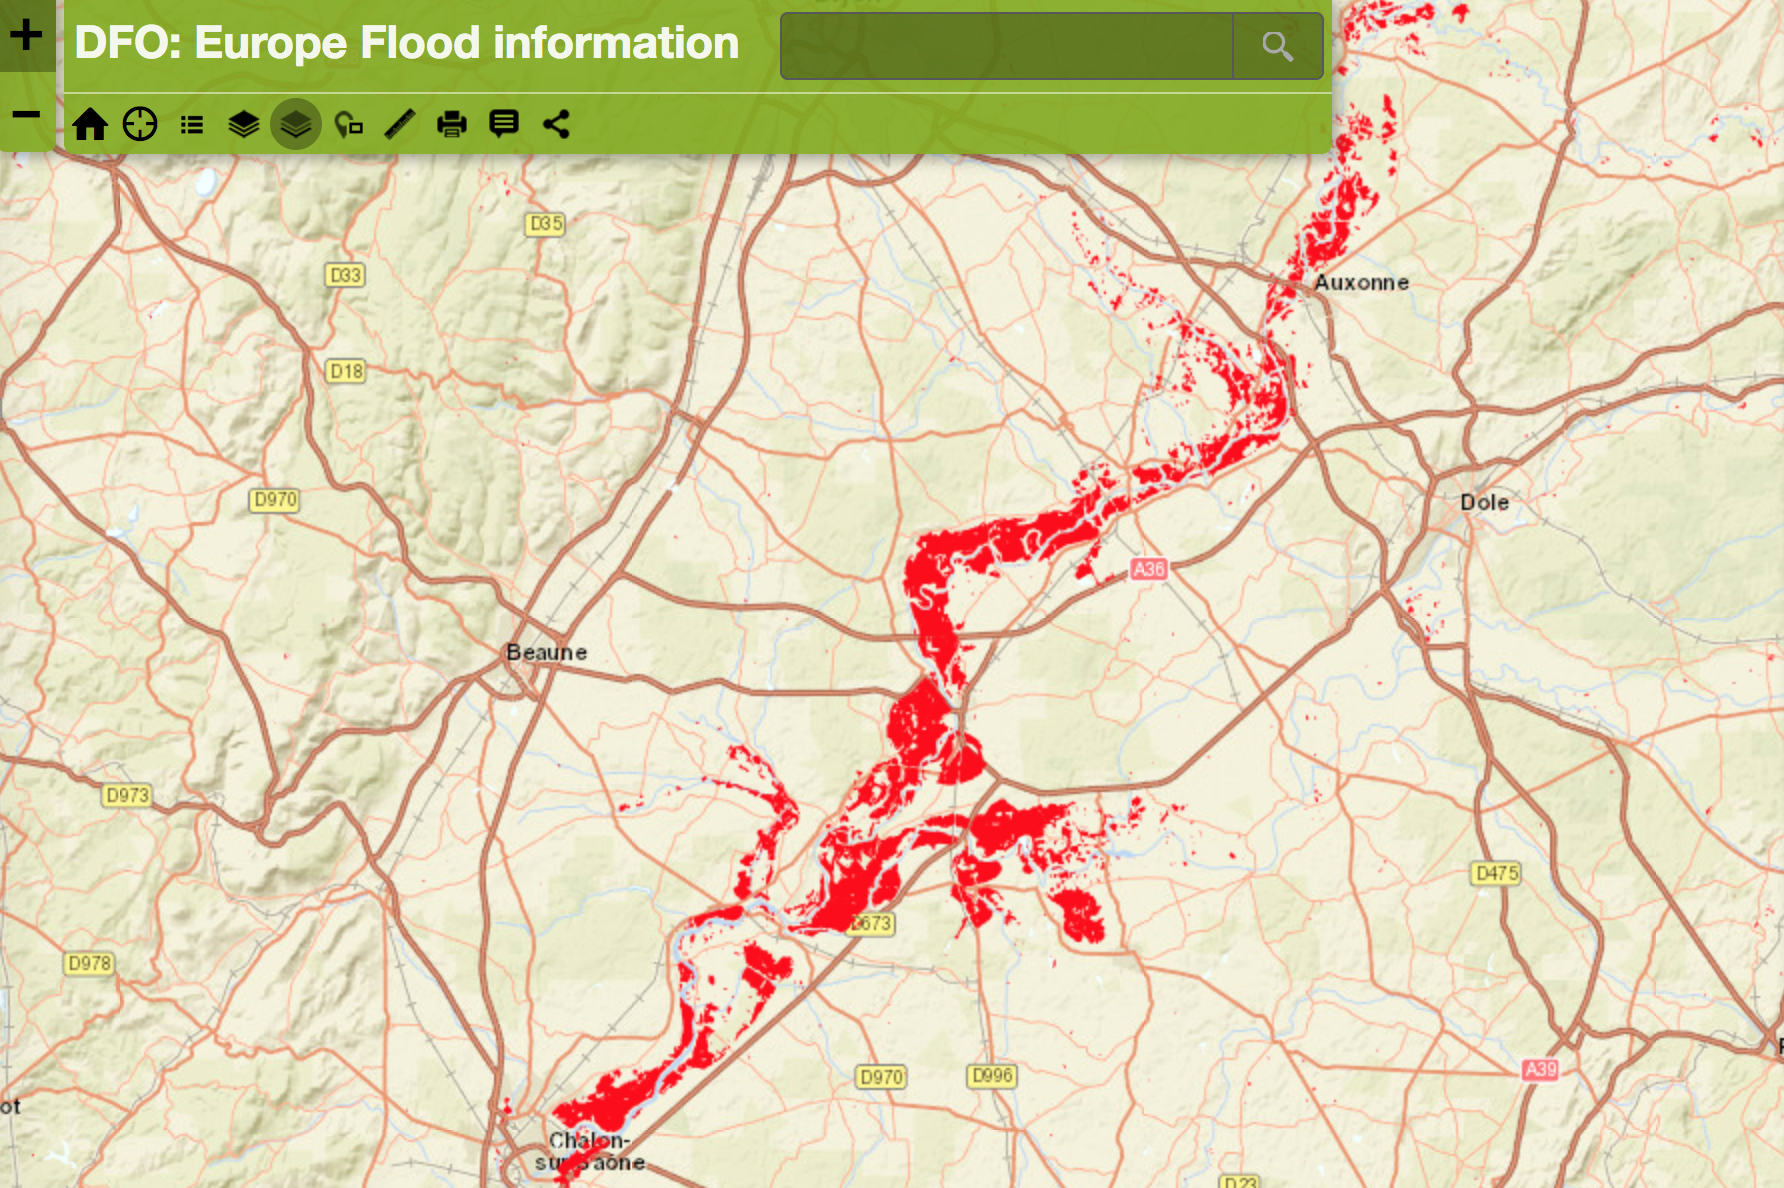
New: DFO's ESA/Copernicus Sentinel 1-based mapping of flooding (red) in France, January 28, 2018. Mapping in progress; sample results below. See also the DFO Map Server.
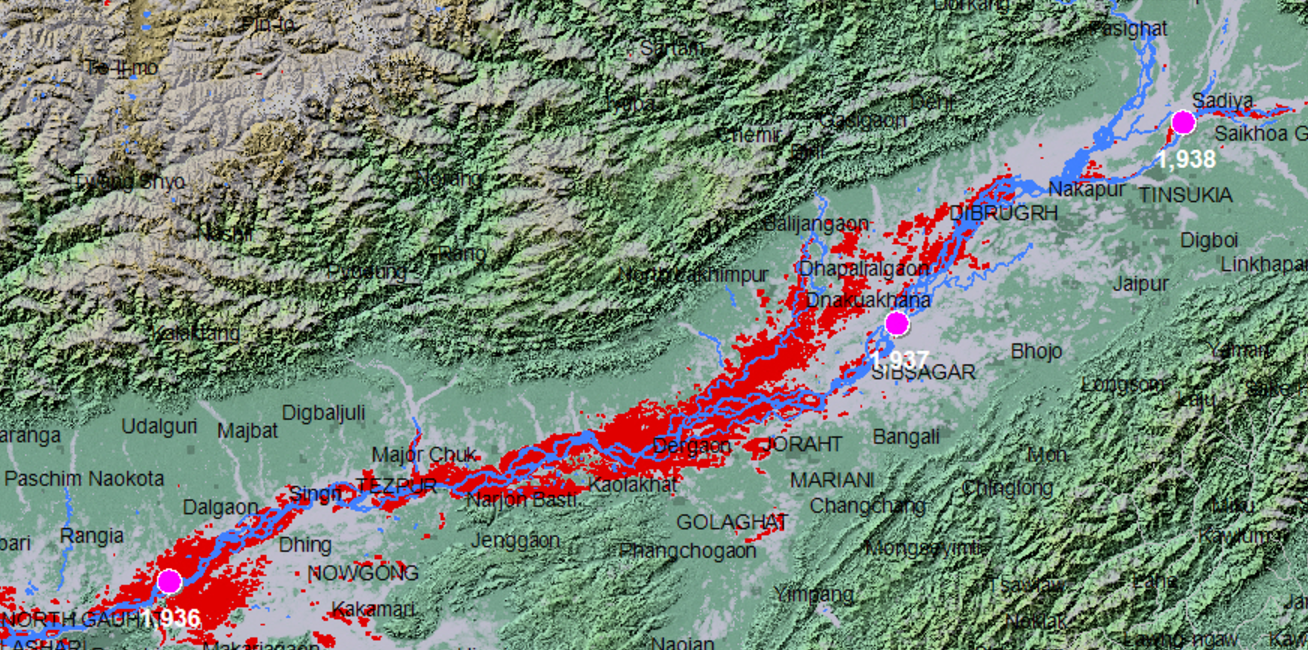
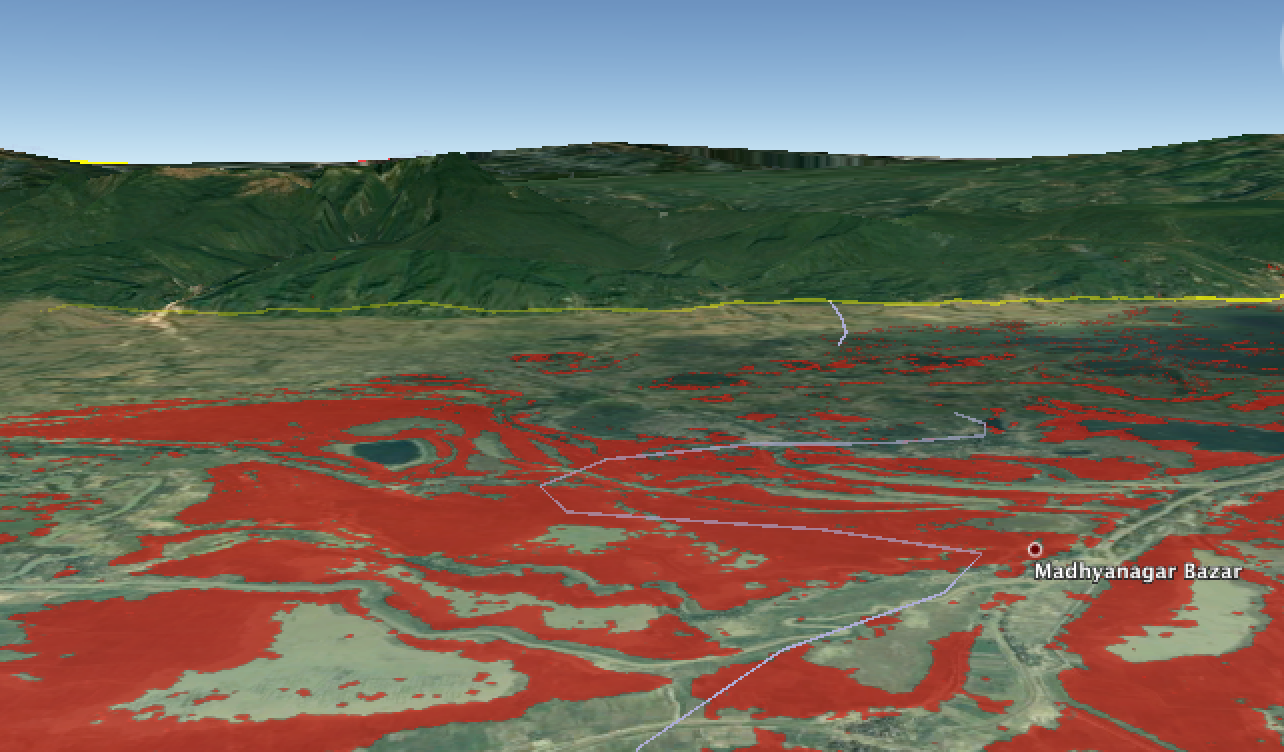
Flooding in NE India, July 15, 2017. Red shows current surface water; blue is typical winter conditions; light gray is all previously mapped flooding. Click on dots to retrieve microwave observation of changing river discharge. See also: 090E030N
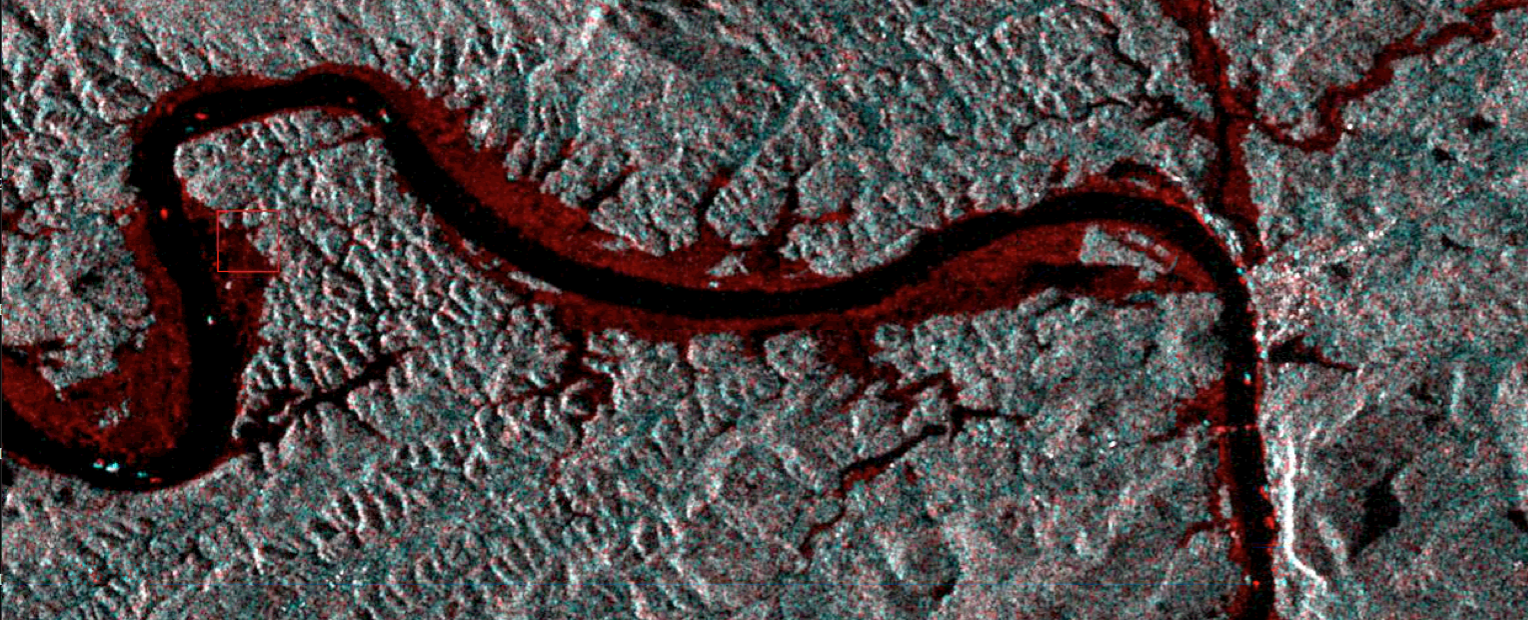
Sample of Copernicus/ESA Sentinel 1 SAR mapping of flooding in China, July 3, 2017 (red is new water compared to May 28, 2017).
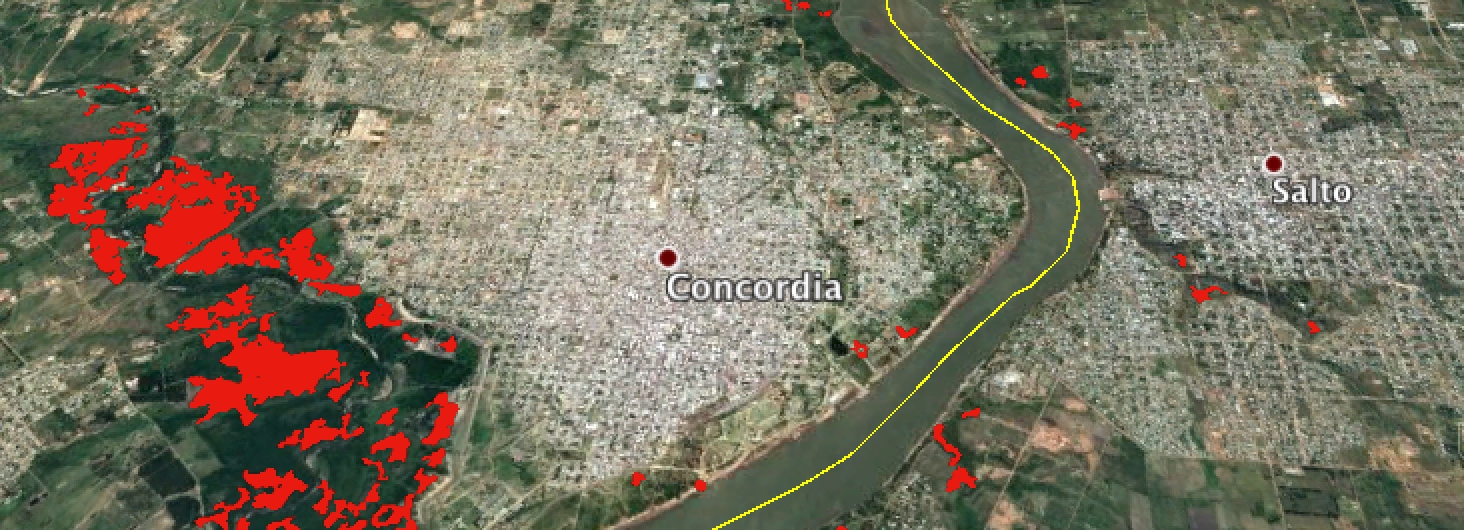
DFO#4475, Uruguay, June 2, 2017
Sample of flood mapping for this event below: Google Earth kmz version.
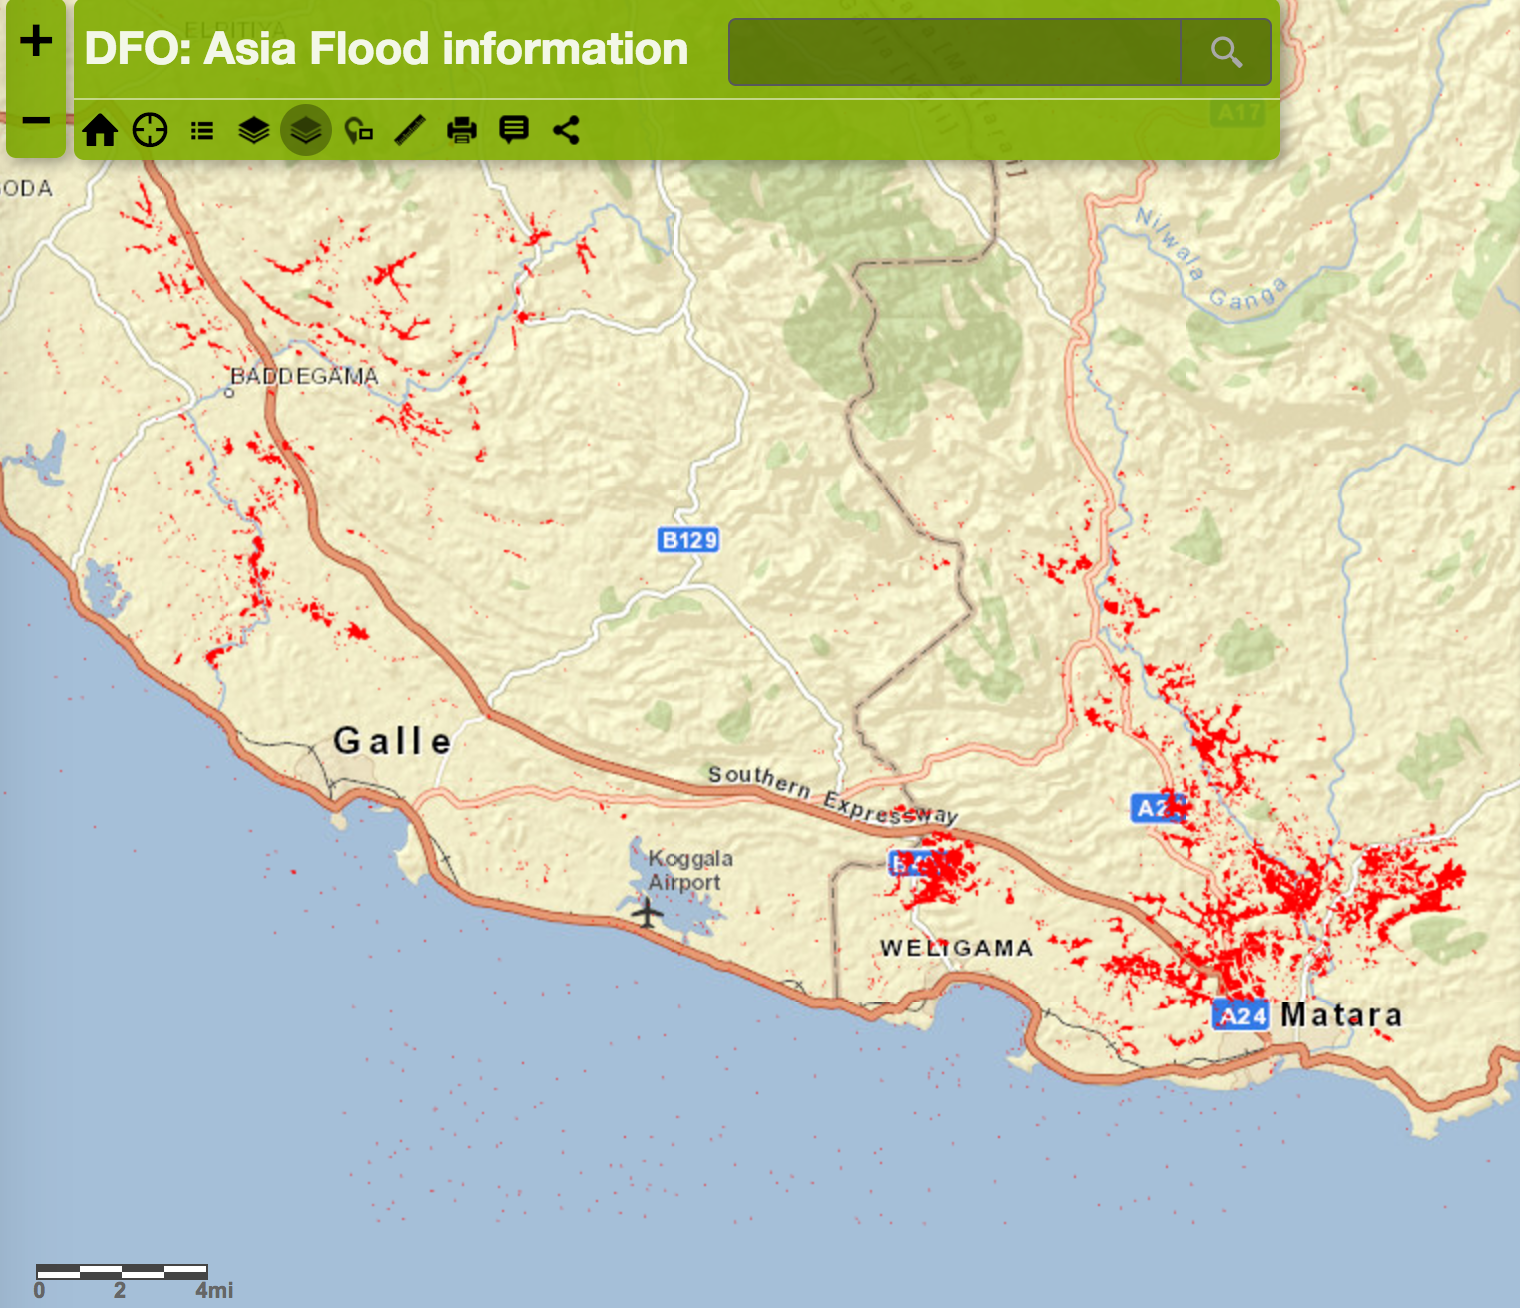
DFO#4474, Sri Lanka, May 24-30, 2017
Sample of flood mapping for this event below: from the DFO Web Map Service. GIS files are also available
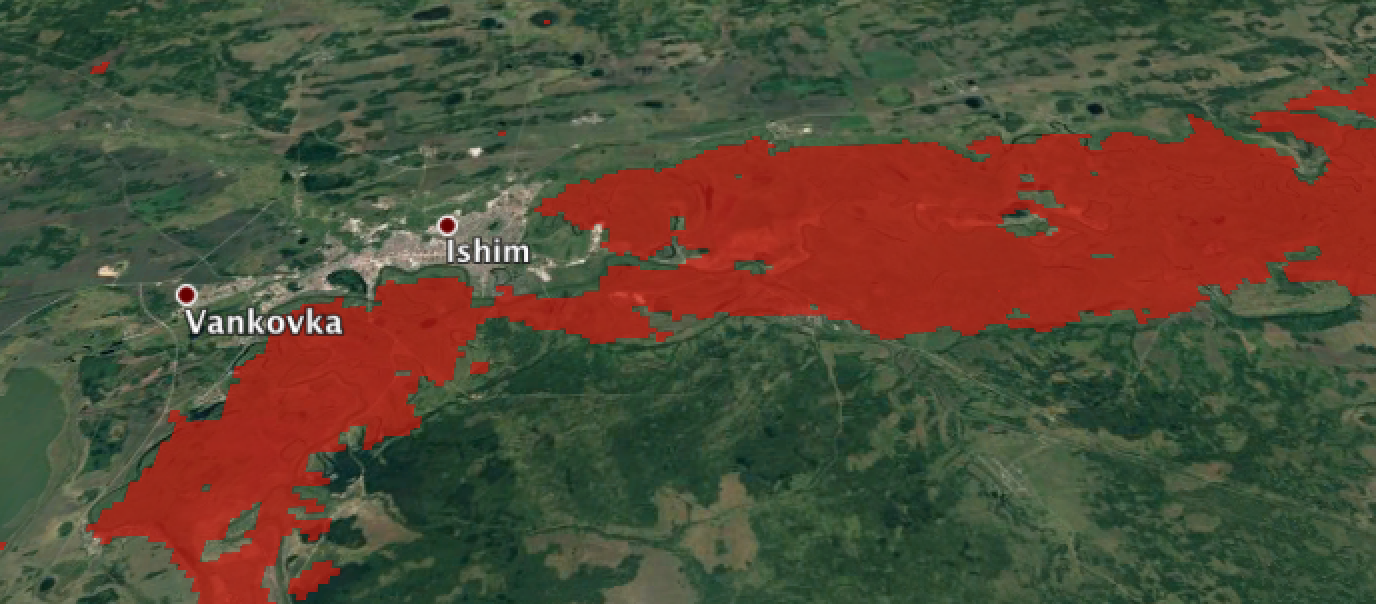
DFO#4473, Russian Republic, May, 2017
Image sample of this flood below, Google Earth view of MODIS-based flood water mapping
DFO#4472, Tebicuary River, Paraguay, May, 2017
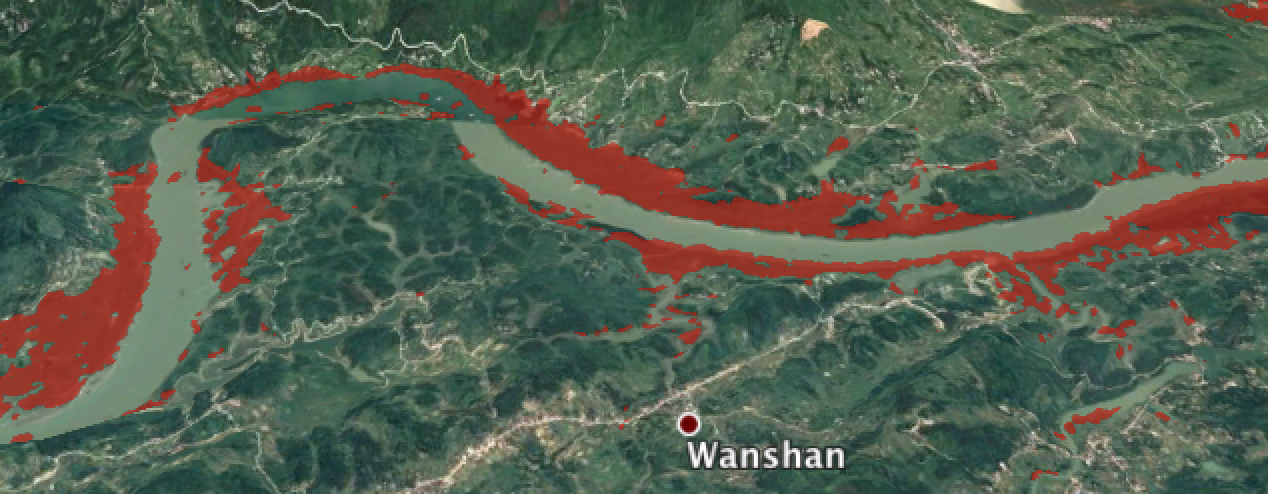
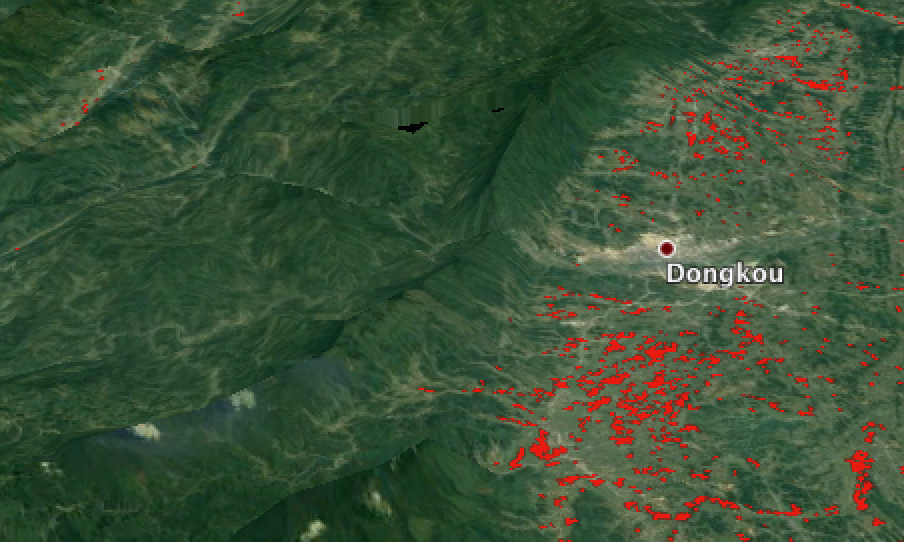
DFO#4471, China (various regions), May 16, 2017
Image sample below, Google Earth view of Copernicus/ESA Sentinel 1-based flood water mapping
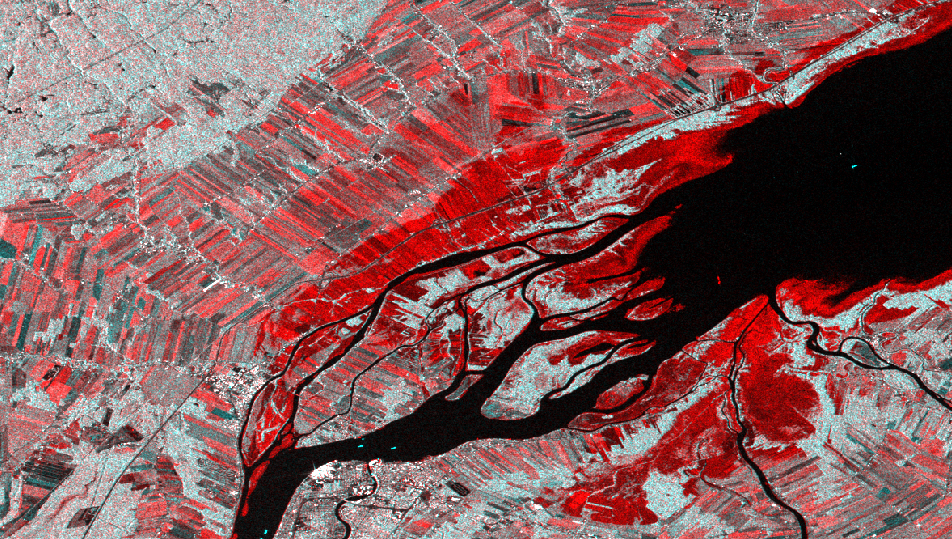
DFO#4470, Quebec, Canada, May 7, 2017
Image sample below, September 9, 2017/May 7, 2017 comparison using Copernicus/ESA Sentinel SAR information; flood water is red
DFO#4468, Central US, April 28, 2017
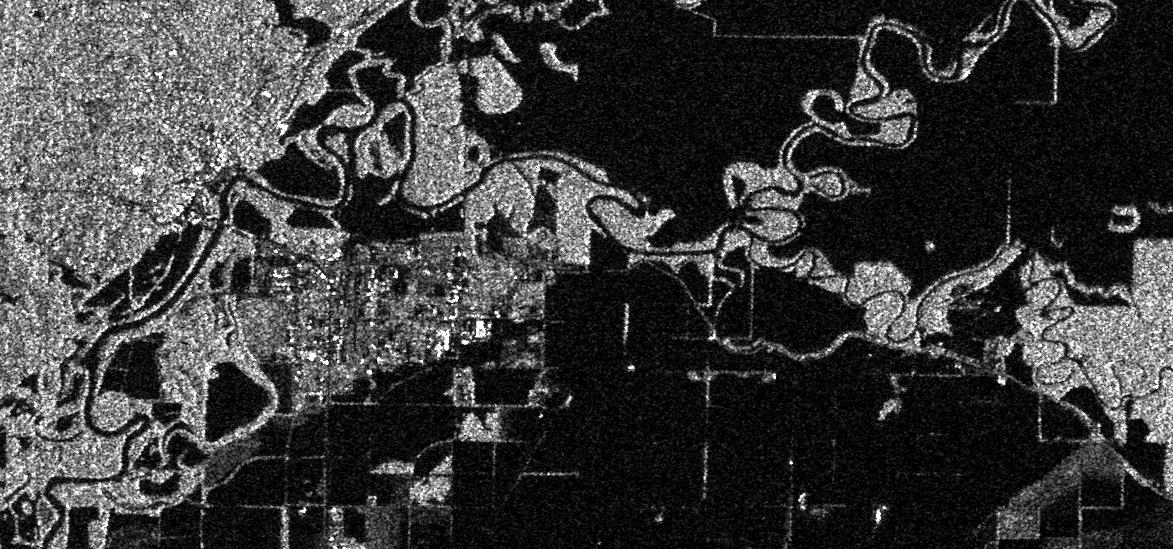
On May 4, Copernicus/ESA Sentinel 1 satellite imaged the levee breaks in Pocahontas, Arkansas (image sample below, water is black)
DFO#4467, Dominican Republic, April 25, 2017
DFO#4466, Bangladesh, April 24, 2017 (Google Earth sample below)
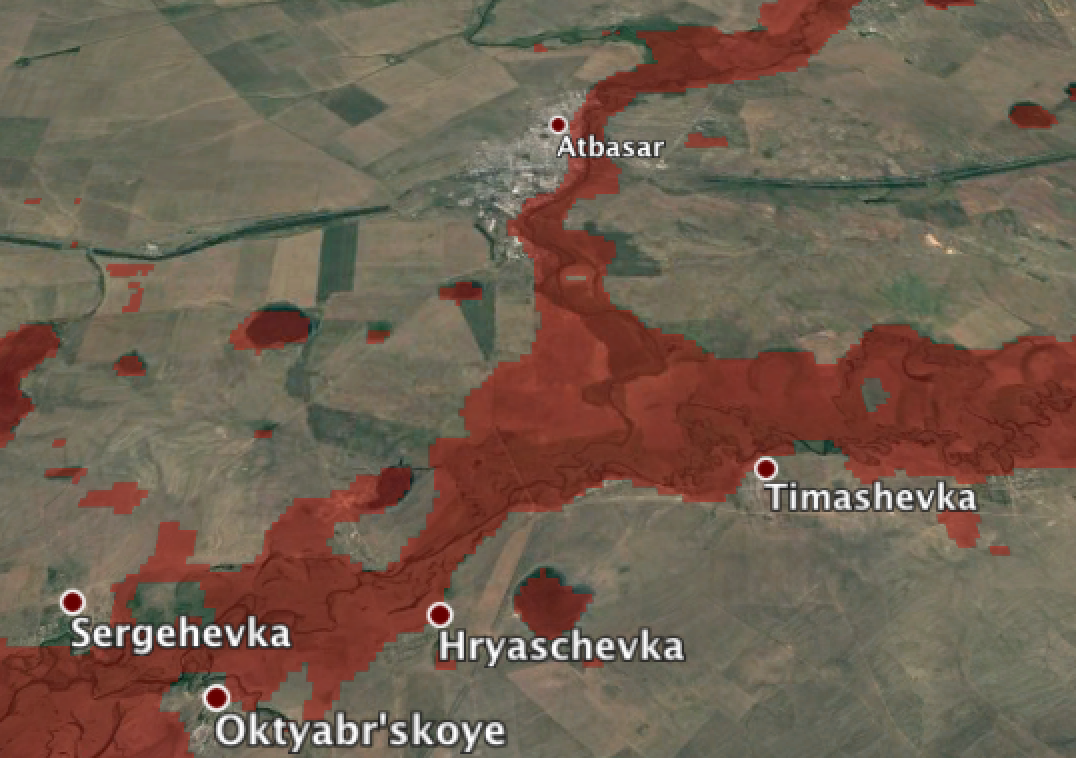
DFO#4465, Kazahkstan, April 20, 2017 (Google Earth version sample below)
Copernicus/ESA Sentinel 1 SAR-based mapping of flooding in Northern California, winter, 2017
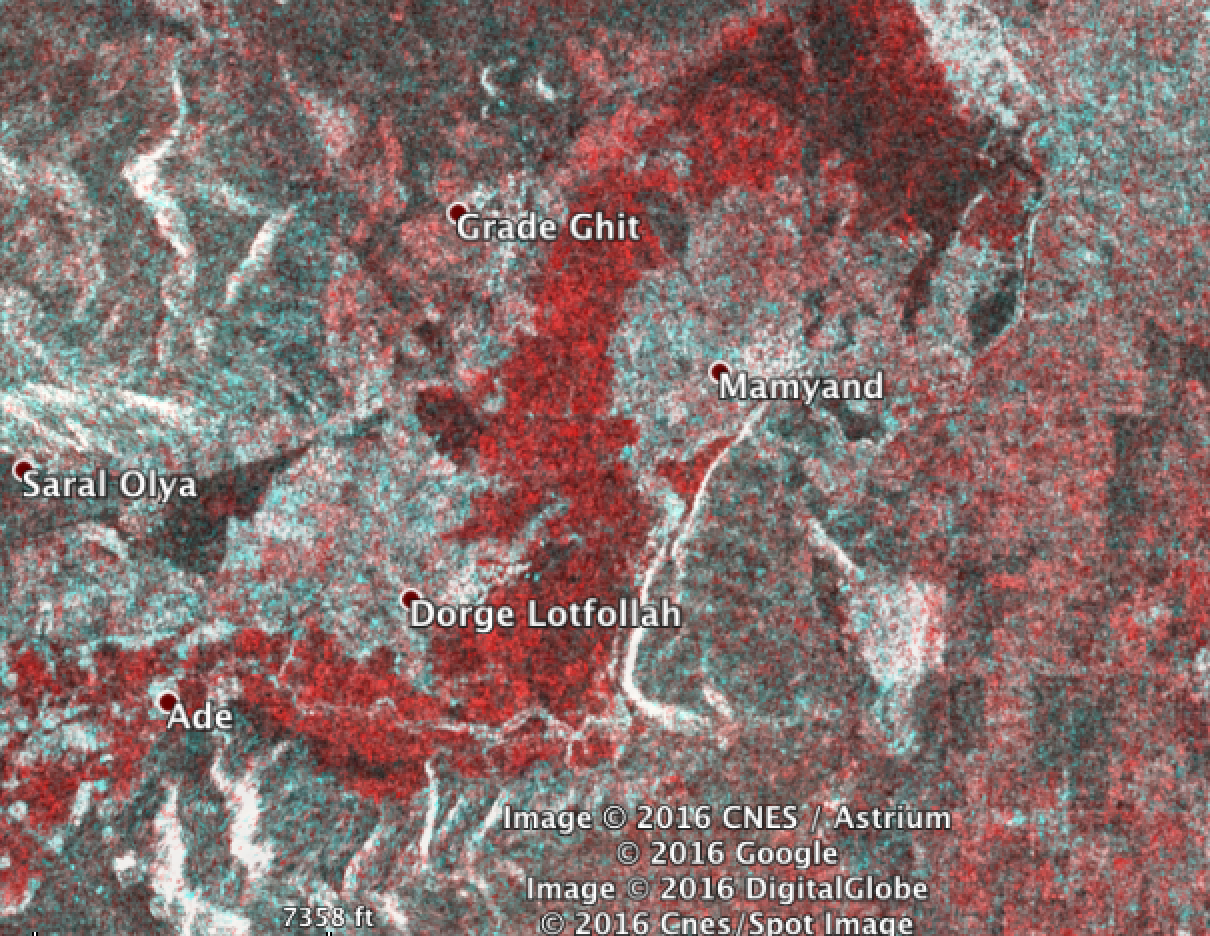
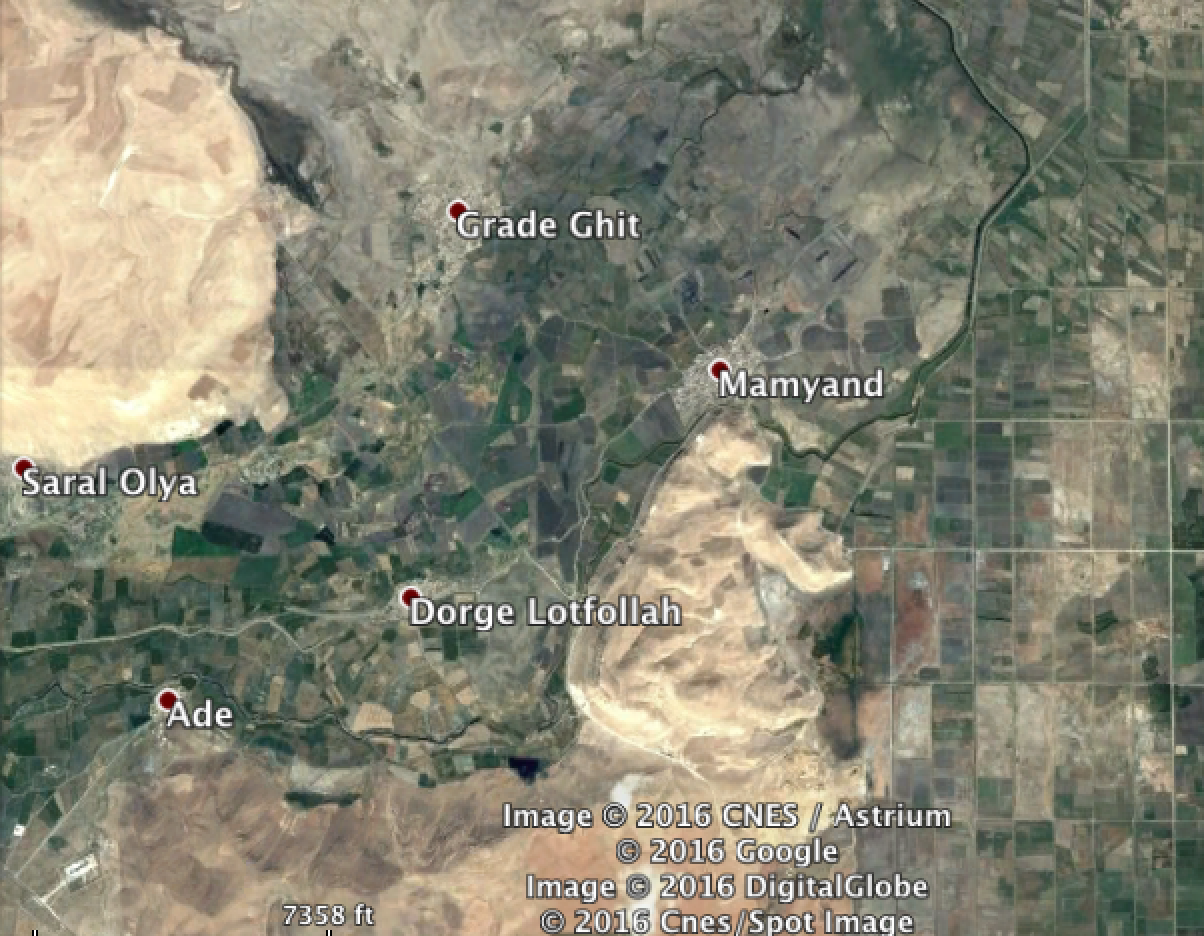
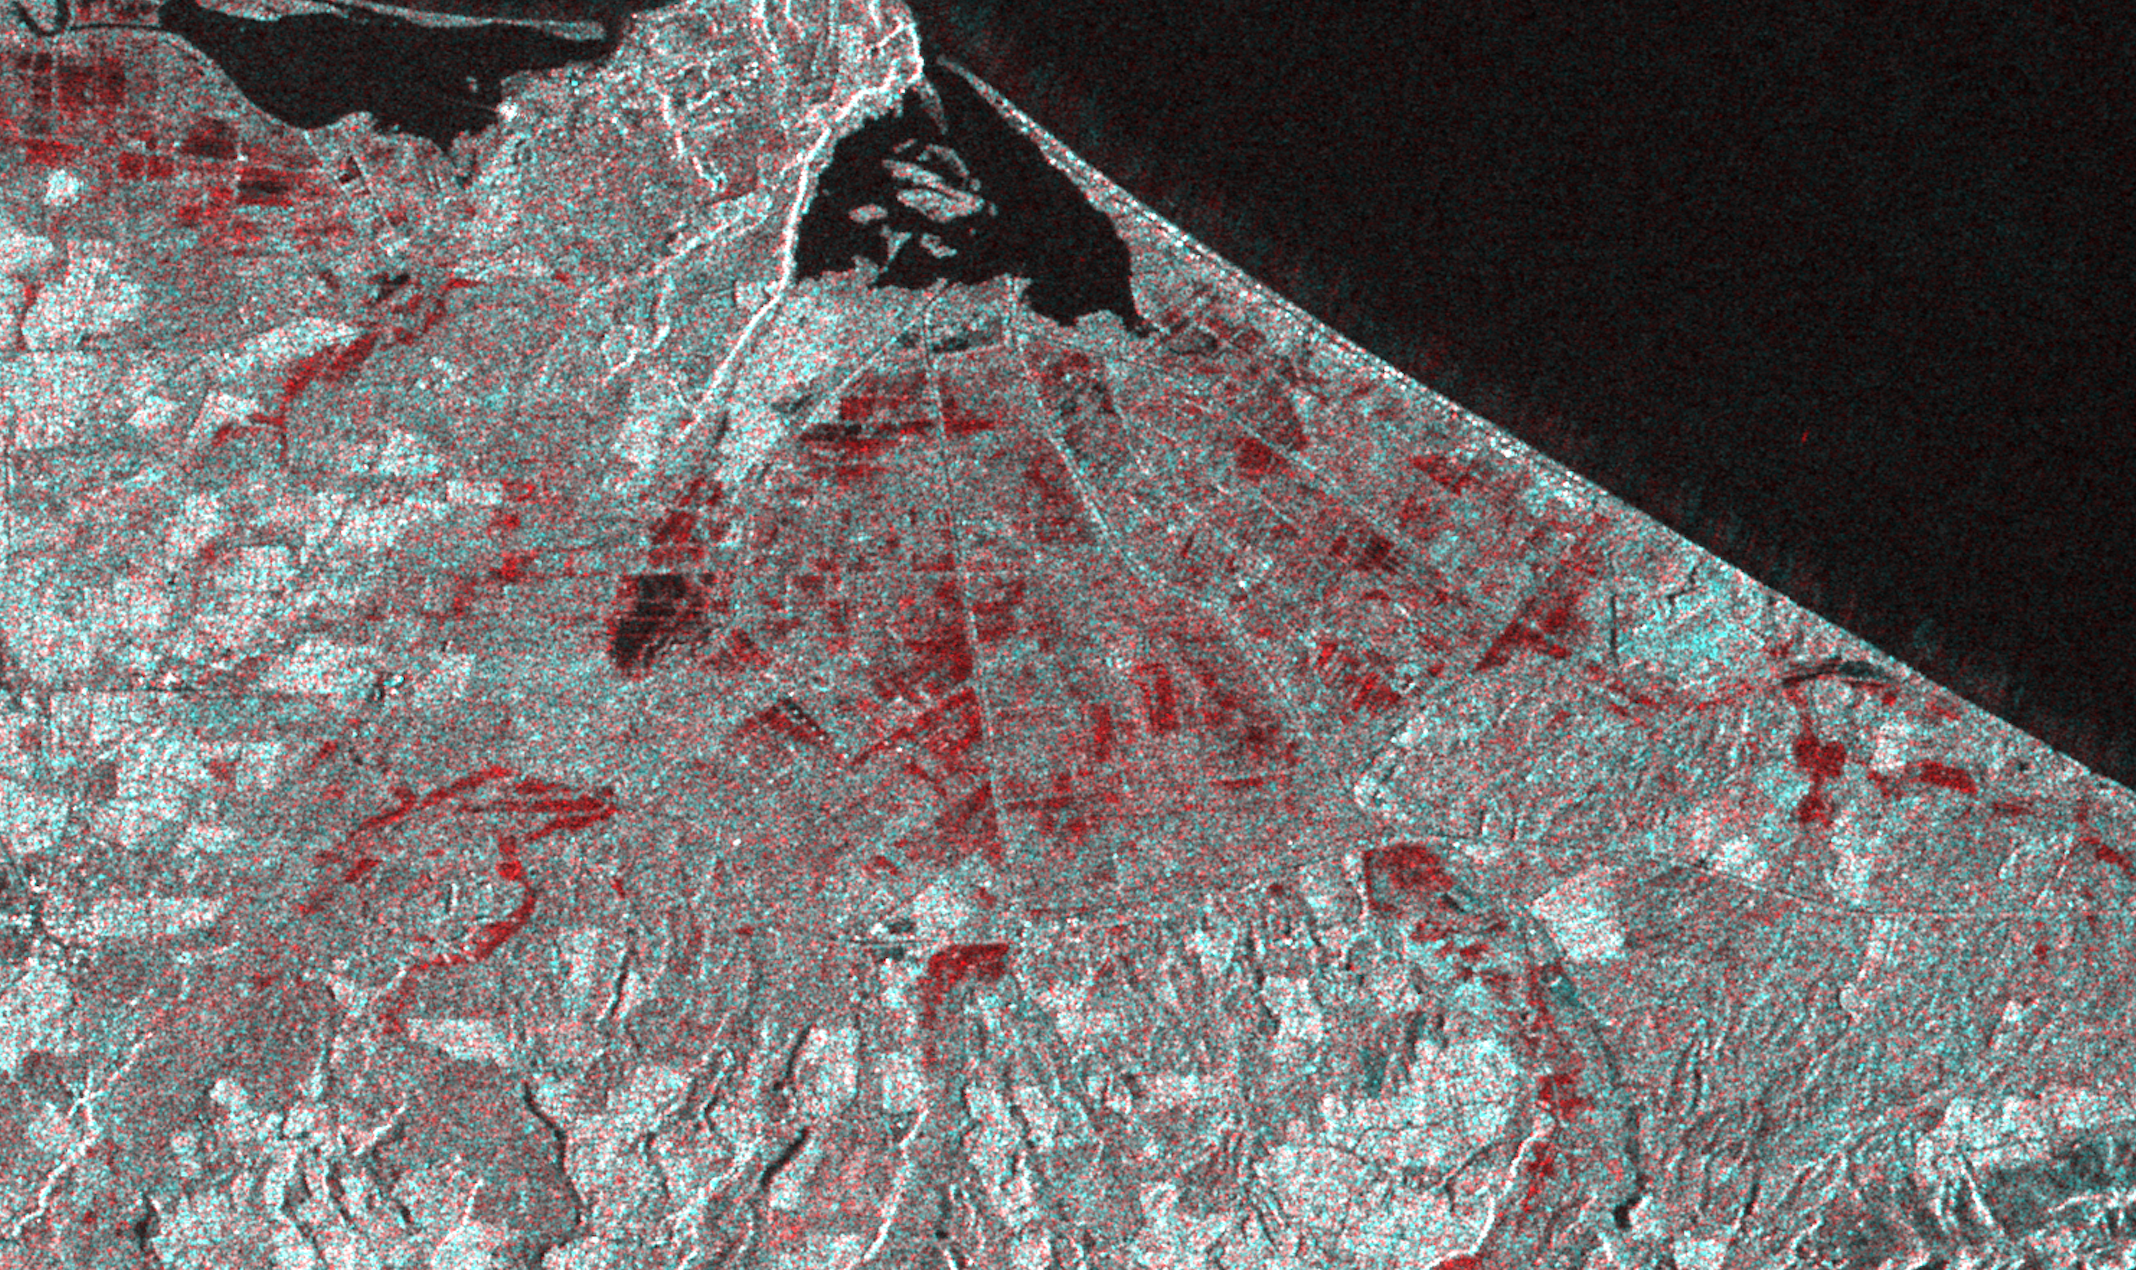
Major flash flooding, NW Iran, imaged April 16 and 18, 2017 by Copernicus/ESA Sentinel 1 and NASA MODIS sensors
Sample 1 (with GoogleEarth view below for comparison)
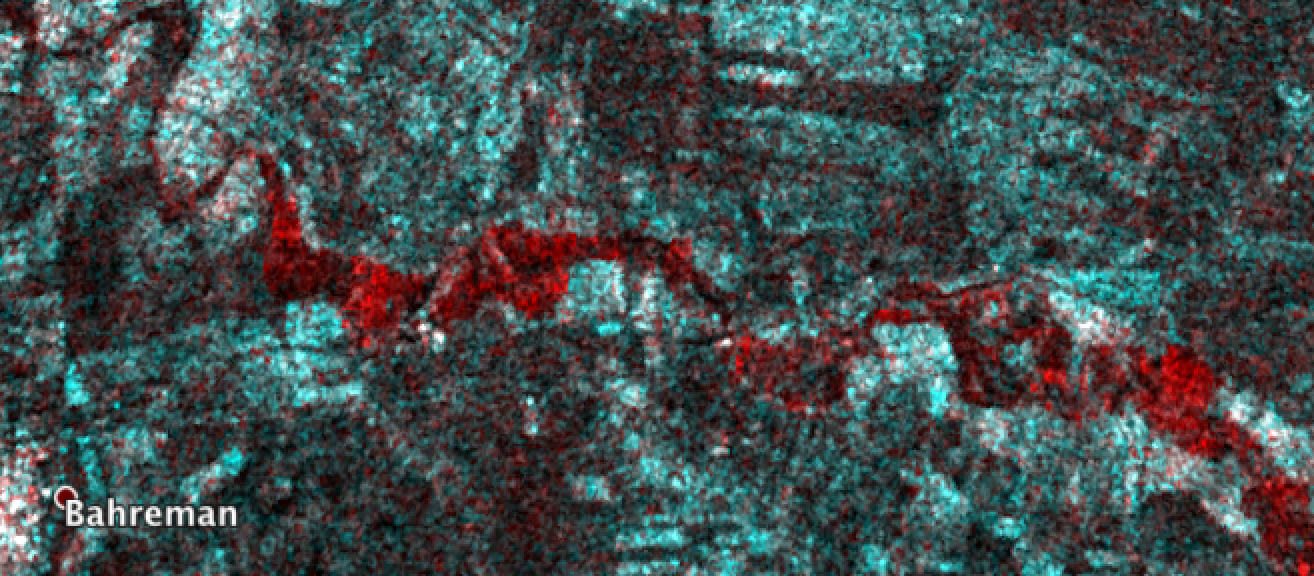
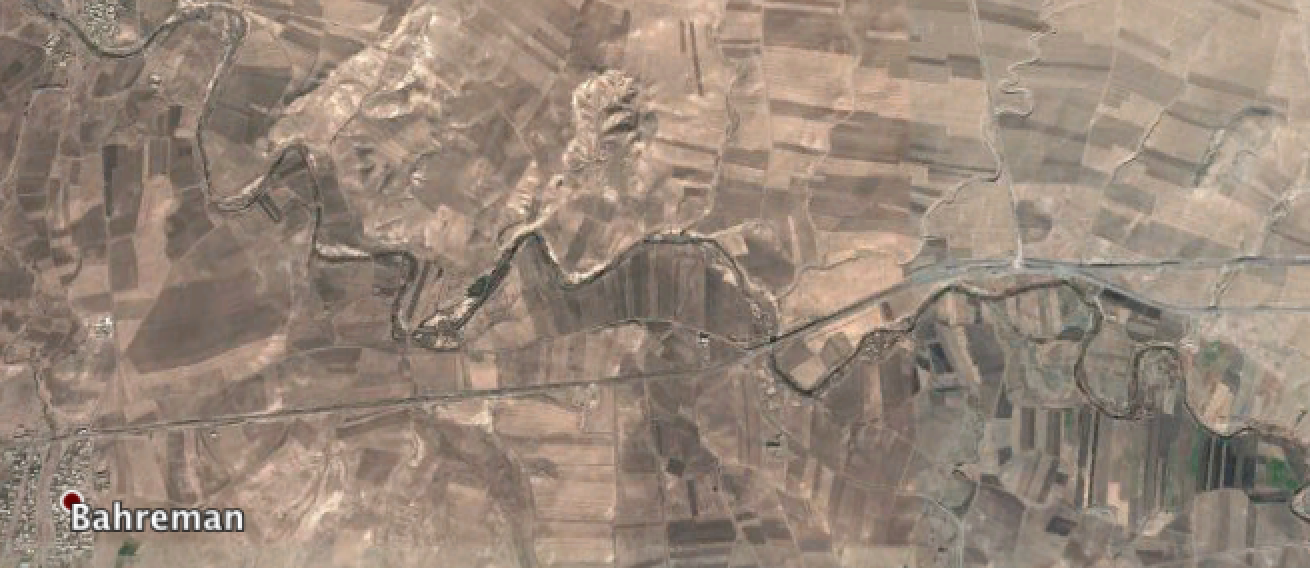
Sample 2 (with GoogleEarth view below for comparison)
DFO # 4464, Northern Argentina
DFO # 4462, Southern Argentina
Tropical Cyclone Debbie-related flooding, April 4, 2017 (DFO # 4461), North coast of North Island, New Zealand
Sample Copernicus/ESA Sentinel 1 SAR composite, April 4/March 11, below.
DFO # 4460, Northern Malawi
DFO # 4459, NE Bangladesh
DFO #4451 from Cyclone Debbie in Australia
(below, based on Copernicus/ESA Sentinel 1 SAR data, March 31, 2017
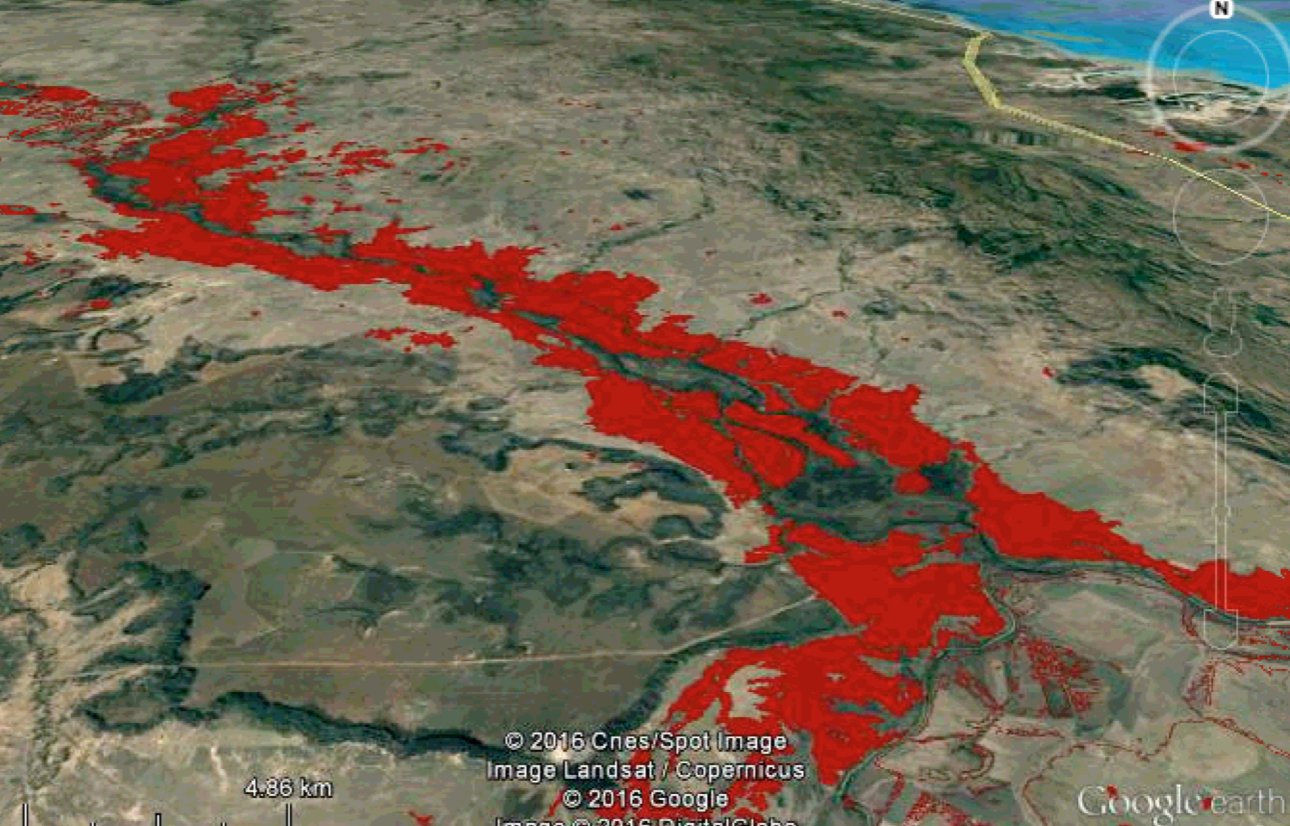
Also see the DFO Map Server using NRT Global Flood Mapping data (sample below)
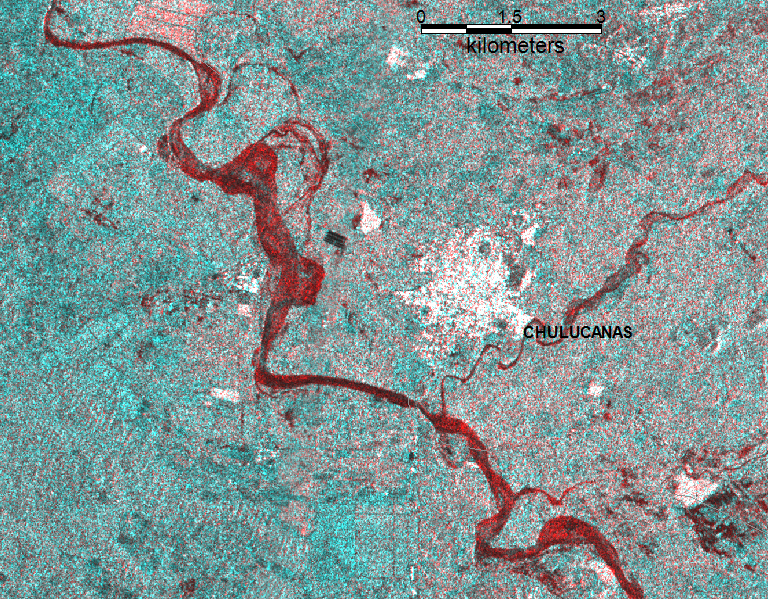
DFO #4450 in Peru
March 20 flooding, red, flooding from comparison of March 20 and January 19, 2017 Copernicus/ESA Sentinel 1 SAR data
DFO #4439 in Mozambique
DFO #4432 in southern Thailand and northern Malaysia
DFO #4434, California, USA. Sample of Copernicus/ESA Sentinel 1 SAR results below
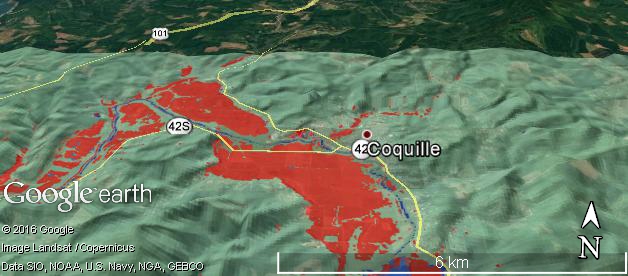
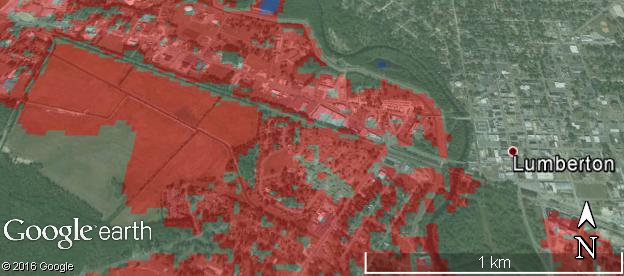
Flood Mapping for Hurricane Matthew, October, 2016
Sample of flood mapping in North Carolina displayed via Google Earth
(See also New York Times article)
Flood Mapping for Hurricane Otto, Costa Rica, November 28, 2016
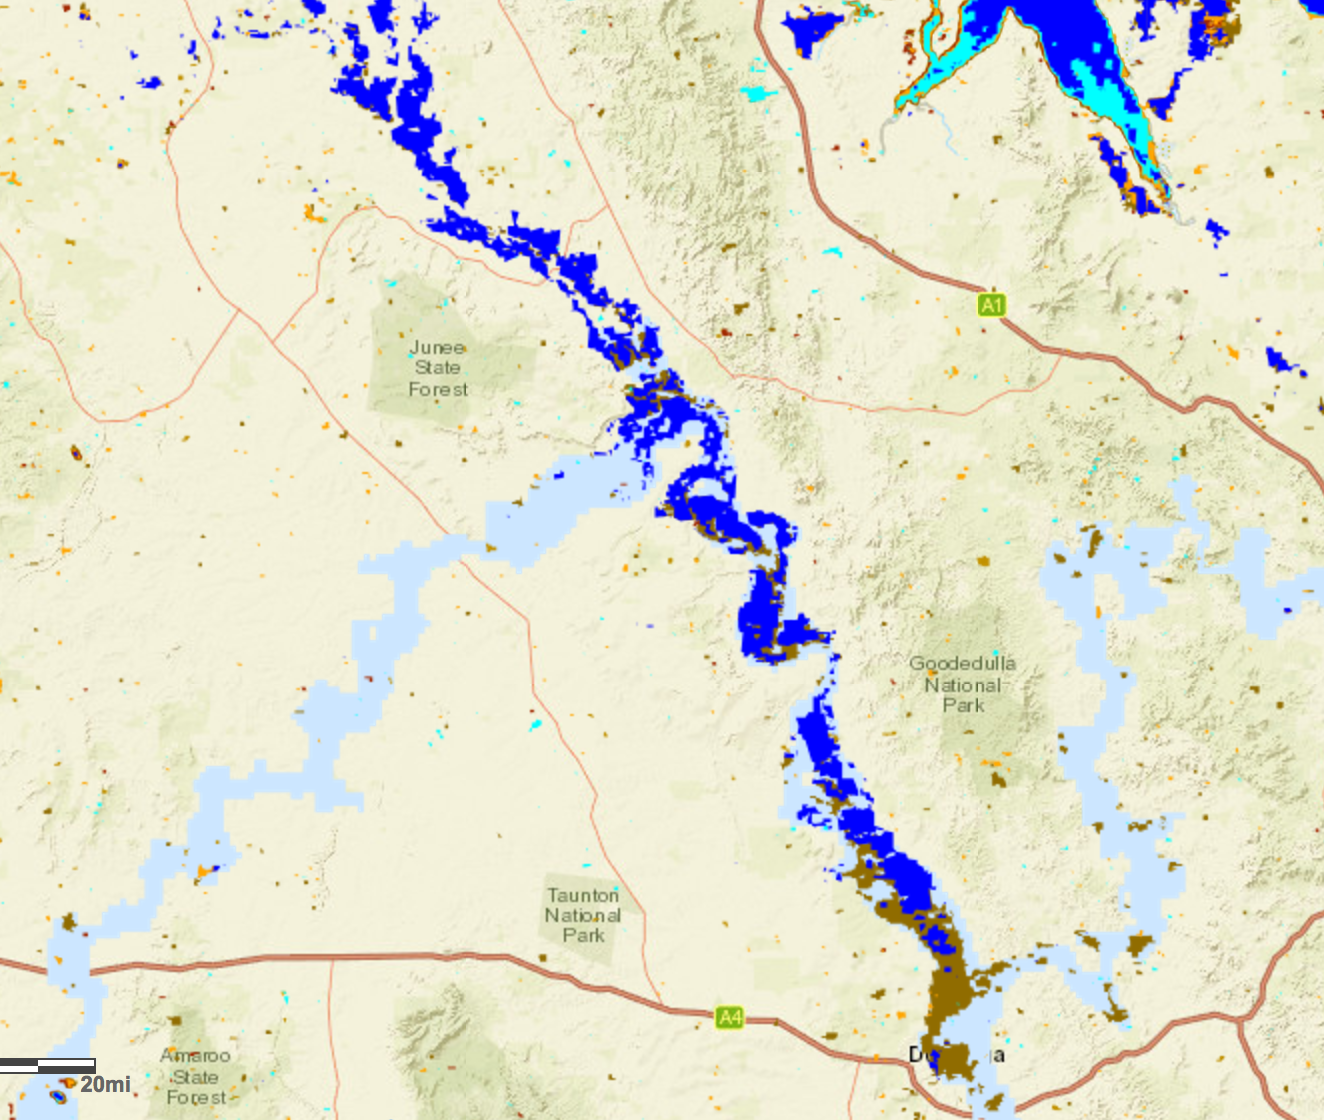
Flood Mapping for New South Wales, October, 2016
Flood Mapping for Iowa, Wisconsin, and Minnesota, August 27, 2016
Flood Mapping for Southern USA, August 1-15, 2016
Flood Mapping for North Korea, September 1-15, 2016
Flood Mapping for Sudan and South Sudan, July-September, 2016
Flood Mapping for Bangladesh, July-August, 2016
Flood Mapping for Bihar, India, July-August, 2016
Flood Mapping for Assam, India, July-August, 2016
Flood Mapping for Myanmar, July, 2016
Special Regional Displays (2017: under construction)
Ganges/Brahmaputra Flood Awareness and Prediction System
Ganges/Brahmaputra Current Flood Conditions
Myanmar Current Flood Conditions
(counting since September 19, 2017)

This work, web site, and associated data are by G. R. Brakenridge and A. J. Kettner and are provided here under the terms of a Creative Commons Attribution-NonCommercial-ShareAlike 4.0 International License. With attribution, they can be used and shared freely for non-commercial purposes. By permission, which is freely granted, they can also be used for commercial purposes. Please consult the Creative Commons license for details.
This work is made possible by data acquired by NASA, the Japanese Space Agency, and the European Space Agency, and funding support from NASA and the European Commission, through the Global Disaster Alert and Coordination System (GDACS) project, Joint Research Centre, Ispra, Italy. The Observatory was founded in 1993 at Dartmouth College, Hanover, NH USA and moved to the University of Colorado, INSTAAR, CSDMS in 2010. The institutional support of both universities is gratefully acknowledged.
http://floodobservatory.colorado.edu/Flood Observatory