


DFO Flood Event 4400
Iowa, Minnesota, and Wisconsin Flooding, September 27, 2016 from MODIS and Landsat 8 Data
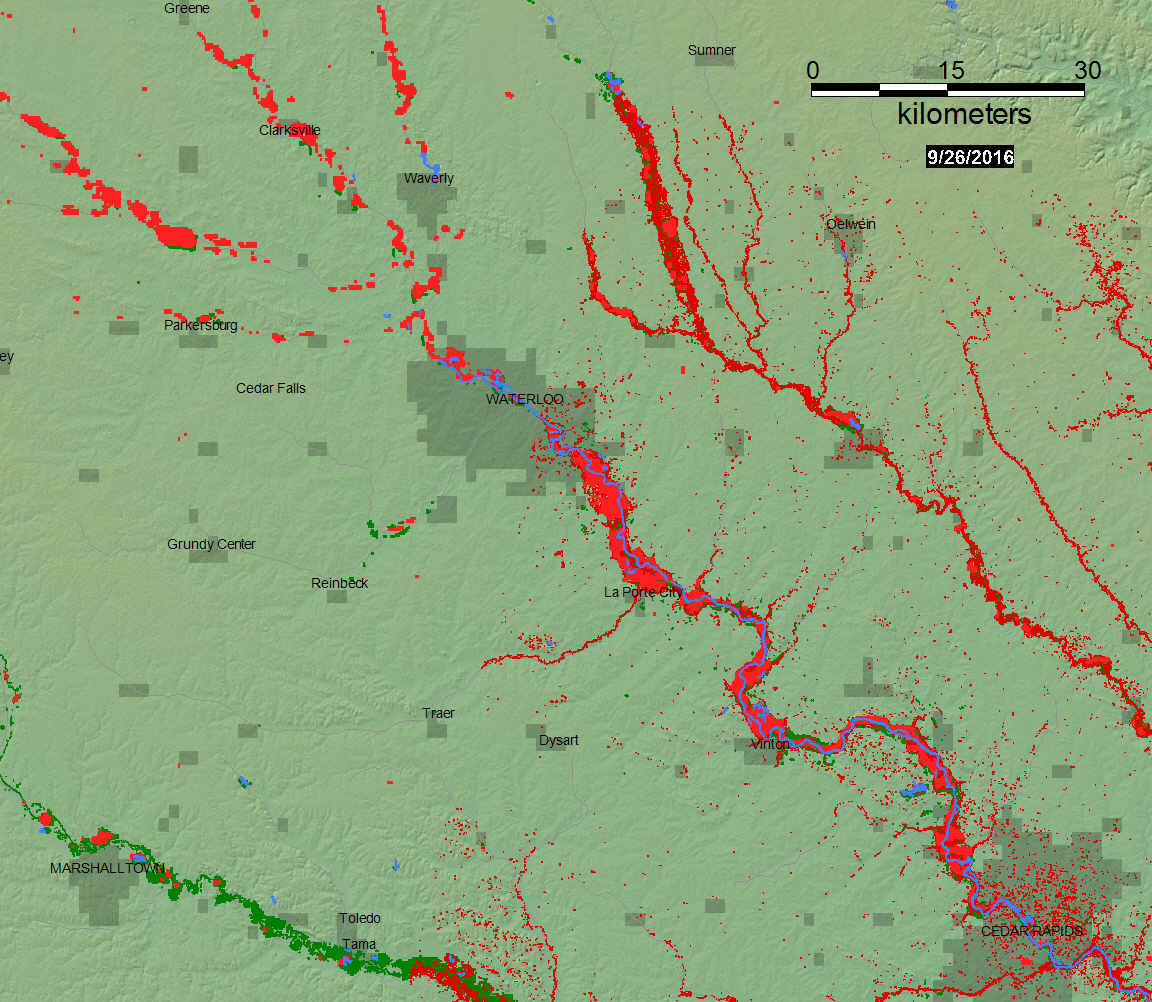
Flood Map (Waterloo, Iowa and vicinity)
Red is flood water during past 14 days from MODIS 250 m data. Dark red is flooding on date shown from Landsat 8. Green is previous flooding, 2000-present. Dark blue is permanent surface water
Geotif version
Google Earth kmz version
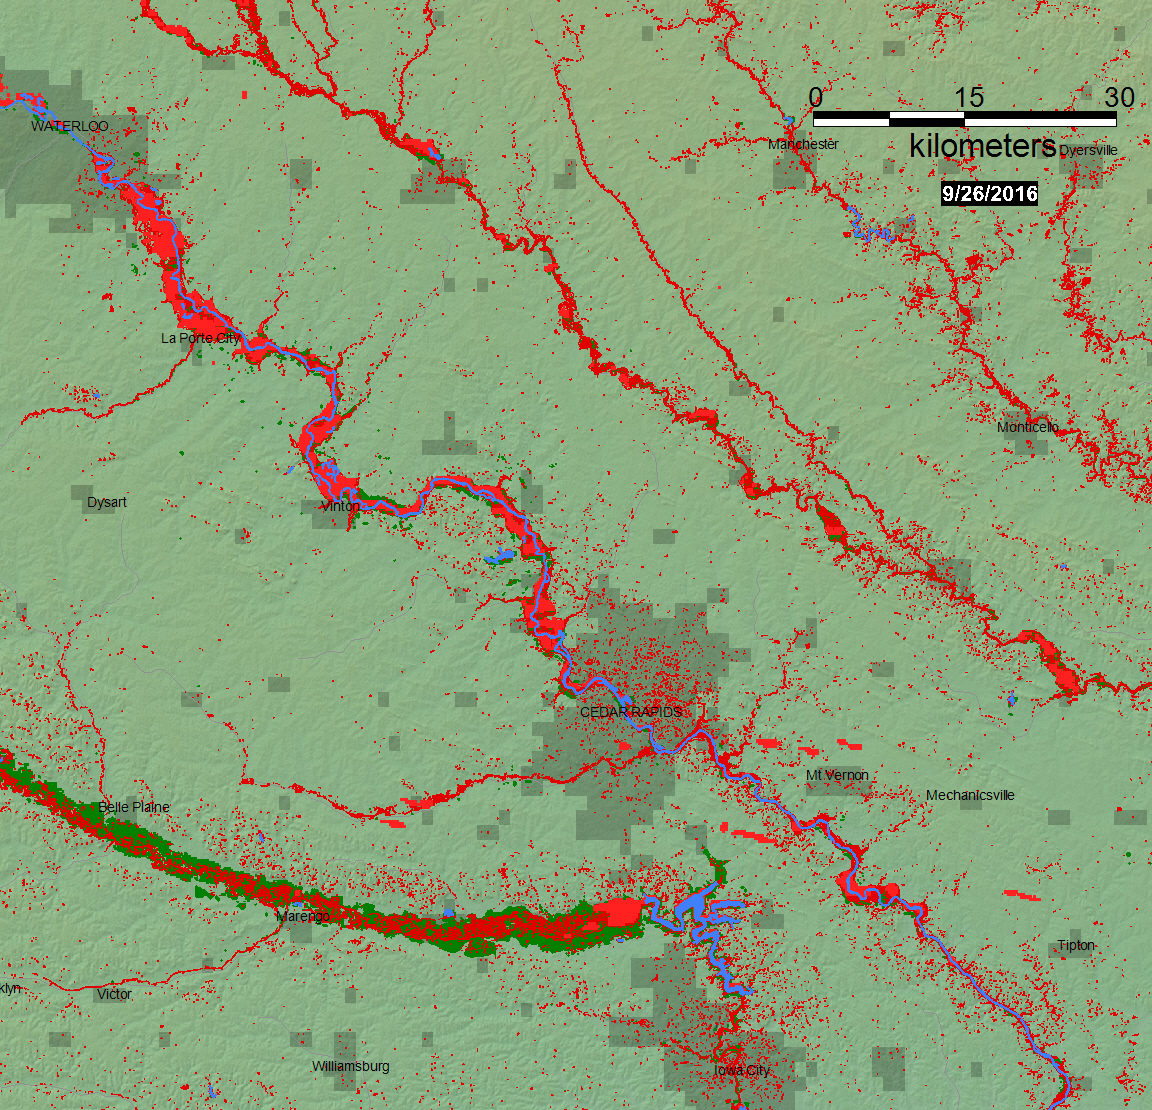
Flood Map (Cedar Rapids, Iowa and vicinity)
Red is flood water during past 14 days from MODIS 250 m data. Dark red is flooding on date shown from Landsat 8. Green is previous flooding, 2000-present. Dark blue is permanent surface water
Geotif version
Google Earth kmz version
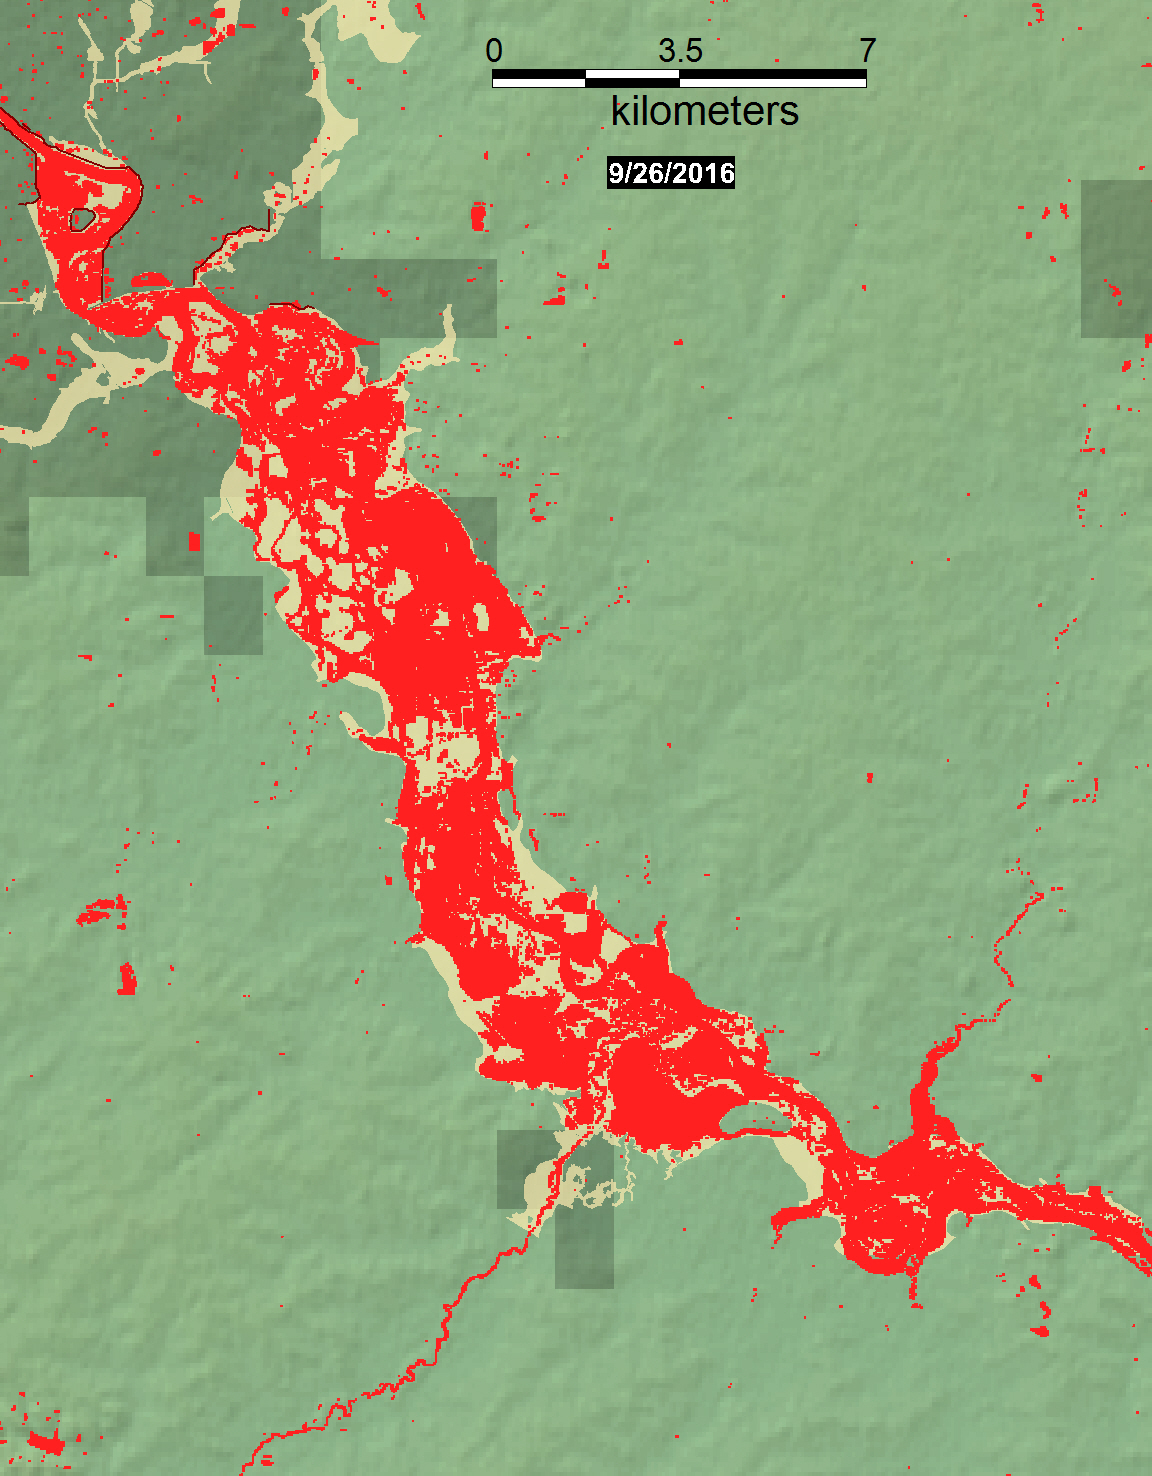
Flood Map with FEMA 100 yr Floodplain (light yellow)
(Waterloo, Iowa and vicinity)
Red is flood water from Landsat 8
Geotif version
Google Earth kmz version
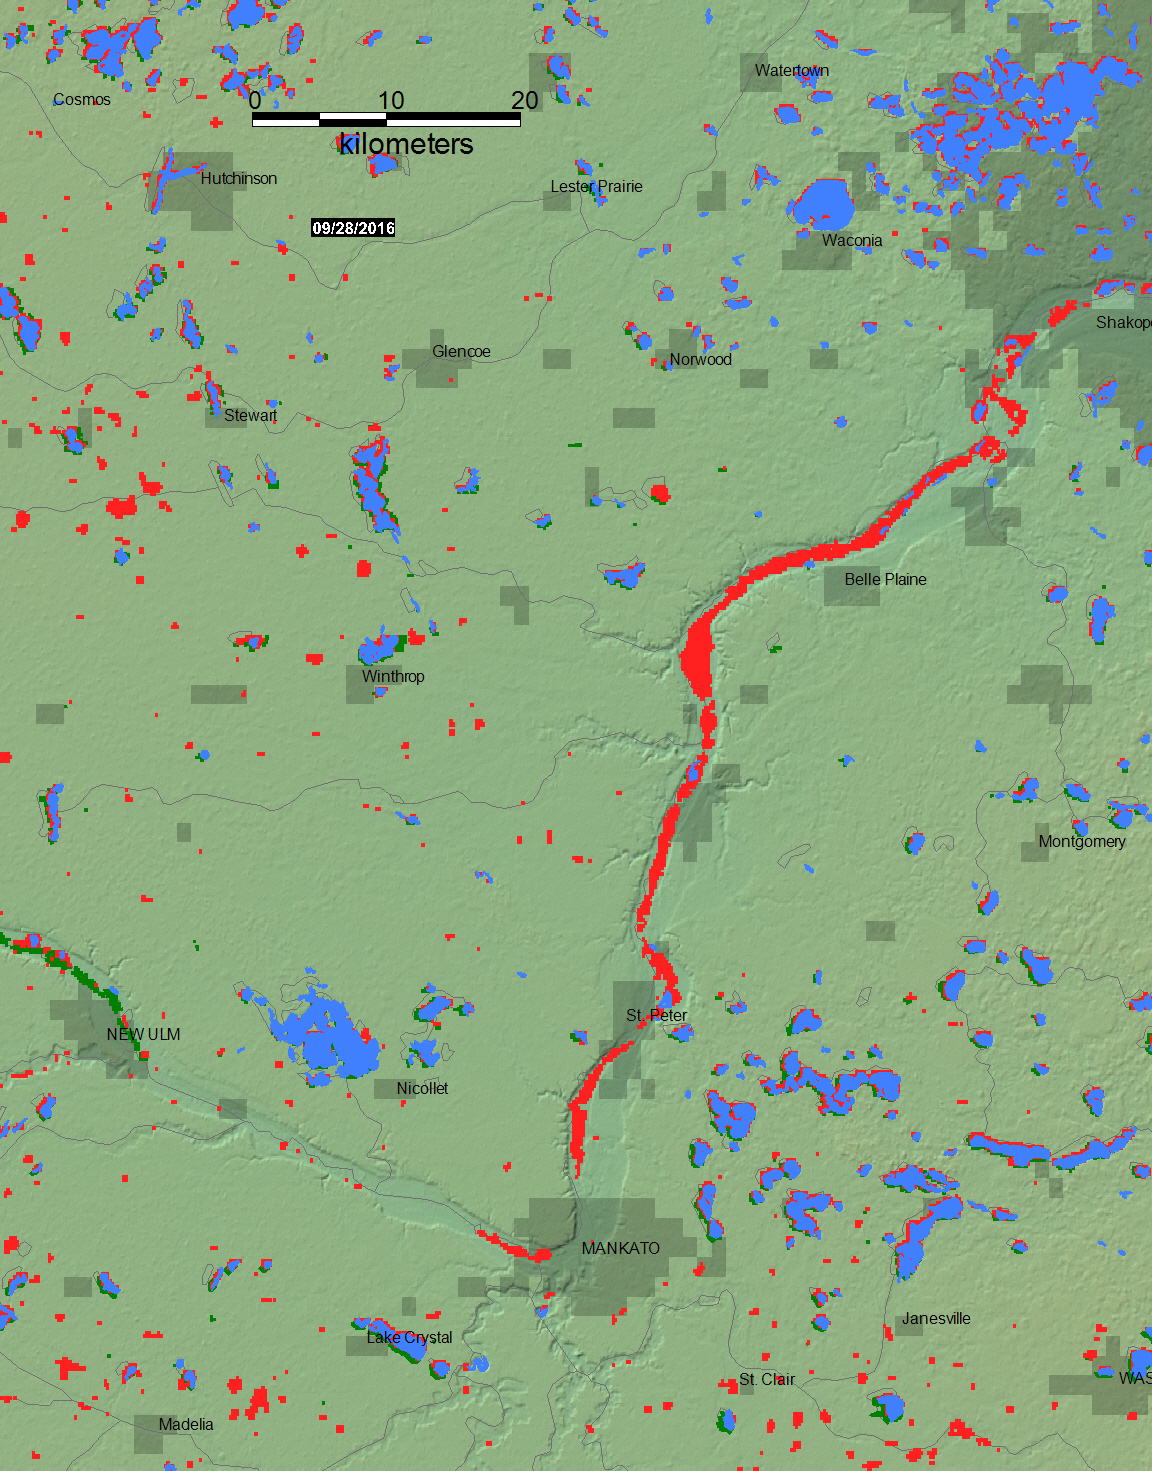
Flood Map (Minnesota)
Red is flood water during past 14 days. Dark red is previous flooding during this event. Green is previous flooding, 2000-present. Dark blue is permanent surface water
Geotif version
Google Earth kmz version
Explanation
Event Reporting:
The Flood Observatory maintains a Global Active Archive of large flood events, 1985 to present. It is available to the public in both spreadsheet and GIS formats (both formats together provide the complete Archive). New events are entered into this archive each week. As of the end of 2015, there were 4319 events; each has a unique archive number.
Event Mapping:
In some cases, severe or damaging floods become the focus of Observatory inundation mapping. As part of collaborations with other organizations, and the Global Flood Partnership, the Observatory's maps and other data are made available to the public. With attribution, they can be used freely, including for commercial purposes, under the terms of the Creative Commons Attribution 3.0 Unported License. Geotif versions and GIS files are also provided for these maps through the links below. This event is selected for Observatory production of map and GIS data products.This web page and associated image and map (GIS) files are the permanent Flood Observatory record of this event.
This Event:
This Flood List link provides a summary. According to Flood List: "Flooding and landslides caused by several days of heavy rain in parts of the Upper Midwest have left two people dead in Wisconsin and prompted evacuations there and in parts of northern Iowa and southern Minnesota. The Governors of Iowa and Wisconsin have declared a state of emergency for affected areas in their respective states. “More than 10 inches of rain fell this week which caused flooding and mudslides across the region of western Wisconsin,” Governor Scott Walker said. The city of Waseca recorded 9.15 inches in 24 hours to Thursday 22 September. At least 2 flood and rain related deaths have been reported in the state. A mudslide in Wheatland destroyed a house and left one man dead. A second victim died in his vehicle after attempting to drive through flood waters in Viroqua. Flooding has damaged homes and washed out roads. A stretch of railway track near the Mississippi River in Ferryville, Wisconsin, was washed away, derailing a train. Wisconsin emergency officials said 15 people who lived nearby were evacuated as a precaution. Meanwhile in Iowa, residents of Cedar Rapids are bracing themselves for potential flooding as levels of the Cedar River are predicted to jump 15 feet over the next 48 hours. Evacuations have been carried out in Mason City, Clarksville and Palo, and an evacuation advisory issued for parts of Cedar Rapids. The National Weather Service at La Crosse said that the 7 day period to 23 September saw rainfall levels in parts of the Midwest between 5 to 7.5 times higher than normal for this period."
Caution:
Floods in hilly or mountainous regions are difficult remote sensing targets and not always observable. Also, cloud cover or heavy vegetation may restrict the ability to capture peak inundation everywhere. The maps may not illustrate all areas of flooding, and cloud and terrain shadows may be misclassified and falsely mapped as flood water. Finally, due to the relatively coarse resolution of MODIS 250 m bands, some areas mapped as flooded may include smaller parcels of dry land and many small areas of flooding may not be detected and mapped.
Suggested citation:
Brakenridge, G.R., Kettner, A.J., Slayback, D., Lei, San Mei, and Policelli, F., date accessed, "DFO Flood Event 4400", Dartmouth Flood Observatory, University of Colorado, Boulder, Colorado, USA, http://floodobservatory.colorado.edu/Events/2016USA4400/2016USA4400.html
Mapping Data Sources:
The Land Atmosphere Near-real-time Capability for EOS (LANCE) system provides daily NASA MODIS data at 250 m spatial resolution. Landsat 8 data, if used, are provided by the U.S. Geological Survey Hazards Data Distribution System. Landsat 8 is jointly managed by NASA and the United States Geological Survey. VIIRS data are processed to flood maps by a NOAA-supported project at George Mason University and are provided courtesy Dr. Sanmei Lei. COSMO-SkyMed synthetic aperture radar (SAR) data, when used, are provided by the Italian Space Agency (ASI) as a contribution to the CEOS Flood Pilot. Sentinel SAR data, when used, are provided by the European Space Agency. NASA EO-1 satellite tasking and data are provided by Stuart Frye and colleagues at the NASA Goddard Space Flight Center. MODIS data beginning in year 2012 are based on an automated product provided by the MODIS NRT Flood project at the NASA Goddard Space Flight Center. Non-automated, MODIS-based .shp or MapInfo GIS files supporting this Flood Event Map are located in a map sheet folder here together with any other high resolution (using Landsat 8, EO-1, etc) GIS files.Click here for access to the automated daily .shp file GIS record (record commences in 2011). Choose appropriate 10 deg x 10 deg map sheet directory and appropriate dates; longitude and latitudes refer to upper left map sheet corner.
Related Data:
Global Flood Monitoring System (GFMS) displays, if provided, are from the University of Maryland. Reference: Wu, H., R. F. Adler, Y. Tian, G. J. Huffman, H. Li, and J. Wang (2014), Real-time global flood estimation using satellite-based precipitation and a coupled land surface and routing model, Water Resour. Res., 50, doi:10.1002/2013WR014710. Global Flood Awareness System (GloFAS) displays, if provided, are from the European Commission Joint Research Centre and the European Centre for Medium-Range Weather Forecasts. Reference: Alfieri, L., Burek, P., Dutra, E., Krzeminski, B., Muraro, D., Thielen, J., and Pappenberger, F.: GloFAS – global ensemble streamflow forecasting and flood early warning, Hydrol. Earth Syst. Sci., 17, 1161-1175, doi:10.5194/hess-17-1161-2013, 2013.
Support provided by:
The Disasters Program of NASA Applied Sciences to the University of Colorado. GPM and AMSR-2 satellite microwave data for River Watch specially processed first within GDACS at the Joint Research Center of the European Commission. DFO participates in the Global Flood Partnership.

(counting since August 27, 2016)