


The Flood Observatory maintains a Global Active Archive of large flood events, 1985 to present. New major flood events are entered into this archive each week. A hand-drawn GIS polygon for each event outlines the estimated total area affected.
In some cases, severe or damaging floods become the focus of Observatory flood extent mapping. As part of collaborations with other organizations, and the Global Flood Partnership, the Observatory's maps and other data are made available here to the public. With attribution, they can be used for non-commercial purposes. With permission, they can be used for commercial purposes. Consult the Creative Commons license shown below and contact Robert.Brakenridge or Albert.Kettner (at Colorado.edu) if questions. Geotif versions and GIS files are also provided.
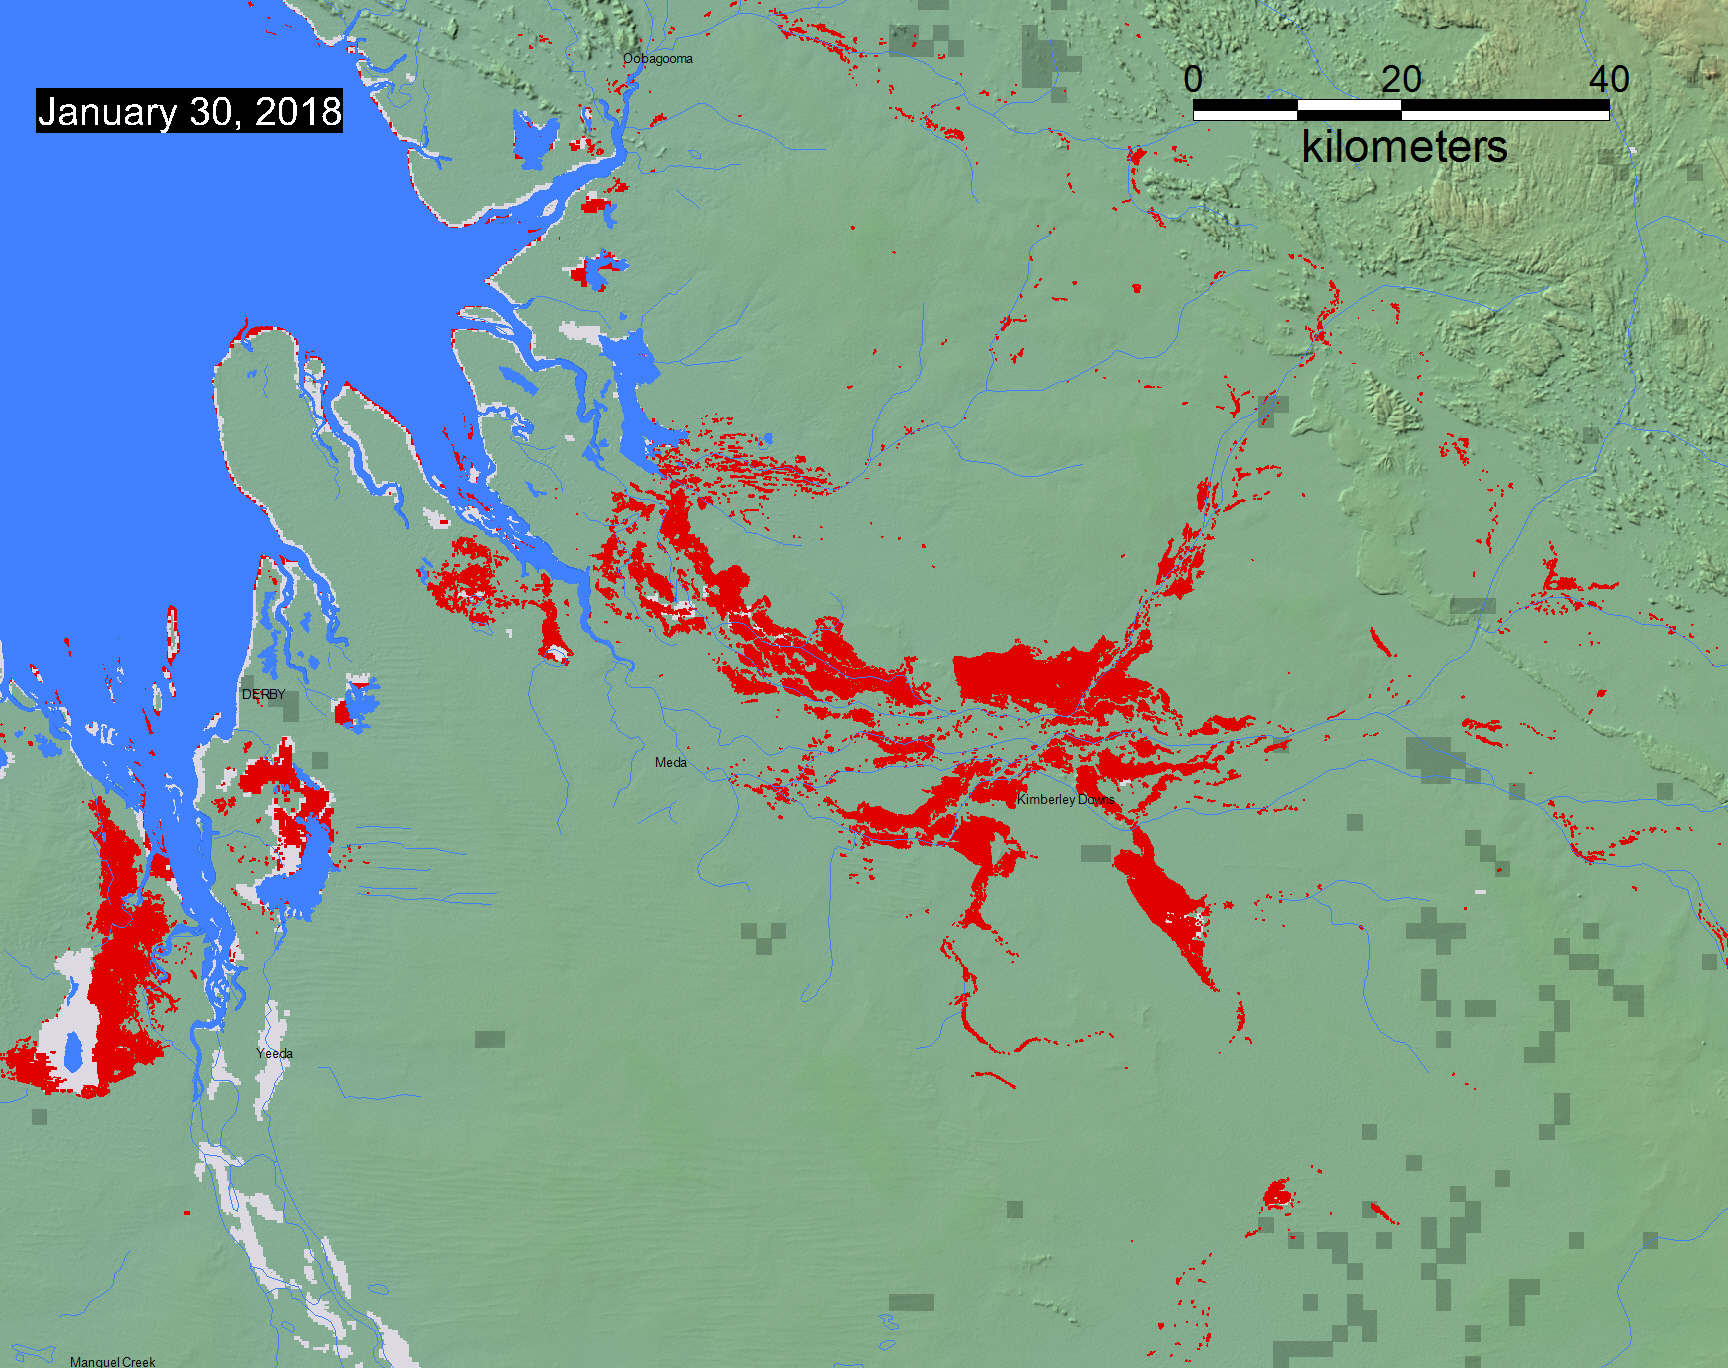
This event is selected for Observatory production of map and GIS data products.This web page and associated image and map (GIS) files are the permanent Flood Observatory record of this event. As the flood event proceeds, additional flood extent layers and maps may be added. The objective is mapping of the maximum extent flooded.
According to Flood List: "Australia – Record Rain, Floods and Evacuations in North 31 January, 2018 by Richard Davies in Australia and Oceania, News · 0 Comment Days of heavy rain in northern Australia caused flooding in parts of Kimberley in the state of Western Australia (WA) and the town of Daly River, Northern Territory (NT) state, where over 300 people have been evacuated. Some areas have recorded over 700 mm of rain in the last few days. During January, Broome in WA recorded its highest monthly rainfall on record with 942.2 mm. Australia’s Bureau of Meteorology (BoM) said that the heavy rains were as a result of an active phase of the monsoon and a tropical low. The highest weekly rainfall totals were observed in the Northern Territory, where many locations had falls in excess of 500 mm. Humpty Doo, a town in rural Darwin, and West Roebuck both received more than 700 mm during the last seven days. Broome and West Roebuck observed rainfall in excess of 400 mm on 30 January. BOM added that “during the last few days, a tropical low has focused the heaviest rainfall on the western Top End of the Northern Territory and the western Kimberley region.” “The low is forecast to track inland over coming days, moving further away from the open waters that provided its energy. As it does so, increasing amounts of dry air will infiltrate the system and it will steadily weaken,” BoM added. Western Australia The Kimberley town of Broome recorded 412.2 mm in 24 hours between 29 and 30 January, its second wettest day on record behind the 476.6 mm set in 1997. The tropical low also brought string winds of 100 kph, with gusts of up to 125kph. Home and businesses have been flooded and more than 450 residents lost power, according to local media. The Bureau of Meteorology said via Social Media, “Broome has recorded 697.2mm in the past 5 days which is the highest 5-day total on record going back to 1889. The previous highest 5-day total was 667.4mm in 1978. Broome also received their highest monthly rainfall on record with 942.2mm!” Emergency WA has warned residents in several areas of Kimberley, including Sandy Desert, West Kimberly and Fitzroy River catchments of possible flooding over the coming days."
In addition to the maps above, for web map service-based (WMS) versions of the same mapping results, visit this DFO link. Zoom in to location of interest, and turn on appropriate event and other data layers.
Brakenridge, G.R. and Kettner, A. J., date, "DFO Flood Event #", Dartmouth Flood Observatory, University of Colorado, Boulder, Colorado, USA, http address.

The maps and web pages provided here are by G. R. Brakenridge and A. J. Kettner and allowable use is guided by the terms of the Creative Commons Attribution-NonCommercial-ShareAlike 4.0 International License. Use for commercial purposes is by permission. Suggested attribution for this map: "Dartmouth Flood Observatory at the University of Colorado, from satellite data provided by NASA and Copernicus/European Space Agency".
NASA Landsat 8 and Copernicus/ESA Sentinel SAR data if used in this map were obtained from the the U.S. Geological Survey Hazards Data Distribution System. and the Sentinels Science Data hub, respectively. Landsat 8 is jointly managed by NASA and the United States Geological Survey. Copernicus is supported by the European Commission..
MODIS data processing
Click here for access to an automated daily MODIS-derived .shp file GIS record (record commences in 2011). Choose appropriate 10 deg x 10 deg map sheet directory and appropriate dates; longitude and latitudes refer to upper left map sheet corner. Not all floods are mappable at the MODIS spatial resolution of 250 m. Some DFO event maps also include these automated MODIS data. If provided in the GIS file directories, the relevant MODIS "Current" file used is renamed to show the date used. These files are an accumulation of all MODIS water for that date and 13 days prior. The data shown on the maximum flood extent maps also refer to the MODIS date range; other satellite image dates are within that date range.
Flood extent files (Shp or Mapinfo) supporting this Flood Event Map are located here.
These files may include high spatial resolution mapping such as from Sentinel or Landsat, or lower resolution files from MODIS. File names commonly include the sensor source (e.g., S1 for Sentinel 1, LS8 for Landsat, MODIS for MODIS) and the image date.
Data from the Global Surface Water Explorer is included as part of the light gray previous mapped maximum surface water extent. It is based on Landsat images at a spatial resolution of 30 m (Jean-Francois Pekel, Andrew Cottam, Noel Gorelick, Alan S. Belward, High-resolution mapping of global surface water and its long-term changes. Nature 540, 418-422, 2016). The NASA Shuttle Water Boundary Data (SWBD) surface water extent (90 m resolution), blue, was derived from NASA's the 11-day February, 2000, SRTM mission and this "permanent" water layer was also corrected using Landsat data. These data are not provided in the GIS directories.
When used in the maps, NASA NRT Global Flood Mapping maximum water extent for the years 2013-2015, at 250 m spatial resolution, provide part of the (light gray) previous satellite-mapped water extent layer. DFO creates these annual water extent layers from data provided by that project, by accumulating into one annual file all of the daily .shp files for each year. DFO has also produced flood extent files through mapping of individual floods (~ yr 2000 to present); these are also included in this layer.
When used in the maps, Copernicus Emergency Management Service data are imported as GIS files and installed in the GIS data folder. "Delineation" files refer to flood inundation extents. Dissemination Policy: Under Copernicus and Commission Delegated Regulations, the information produced by the Copernicus Emergency Management Service shall be made available to the public on a full, open and free-of-charge basis. Attribution of the source is required "Copernicus Emergency Management Service, Directorate Space, Security and Migration, European Commission Joint Research Centre (EC JRC). Accessed date. http://emergency.copernicus.eu/".
The NASA Earth Sciences Program, the Latin American Development Bank, the World Bank, the European Commission's Global Disaster Alert and Coordination System, GDACS, and Copernicus Emergency Management Service, the Google Earth Engine research awards program, the Committee on Earth Observation Satellites (CEOS) Disasters Working Group-Flood Pilot, the Japanese Space Agency, and the European Space Agency all have supported the Observatory's work via research grants and contracts or by provision of free satellite-derived data.
The Dartmouth Flood Observatory was founded in 1993 at Dartmouth College, Hanover, NH USA and moved to the University of Colorado, INSTAAR, CSDMS in 2010. Its sustained operation depends on continued grant and project support. Gift contributions can be accepted; if your organization uses these data and maps, please consider helping to sustain this effort. The institutional support of both universities is gratefully acknowledged.
(counting since January 31, 2018)