Active Archive of Large Floods, 1985-Present
Master Index of Inundation Maps

Myanmar Current Flood Conditions
Updated Daily at 16:45 Local (Denver) Time
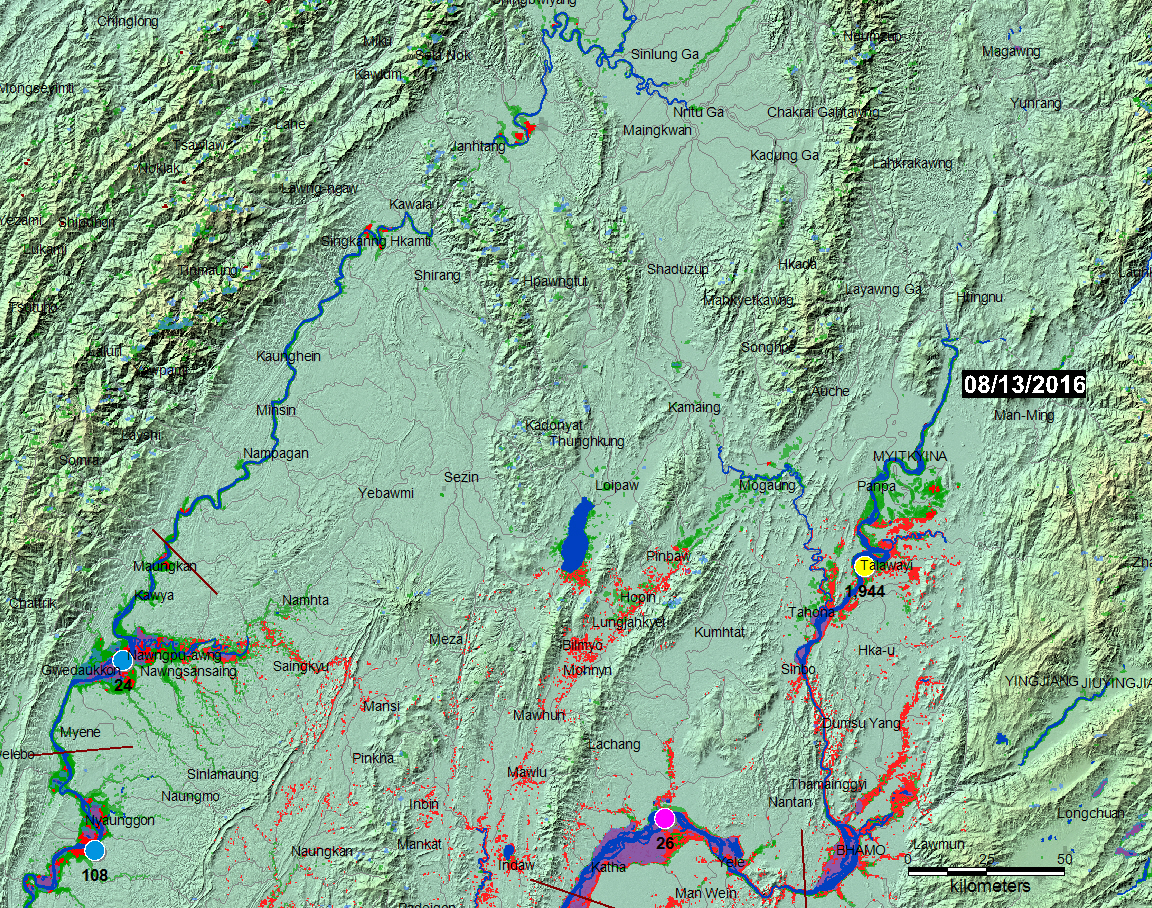
Northern Myanmar
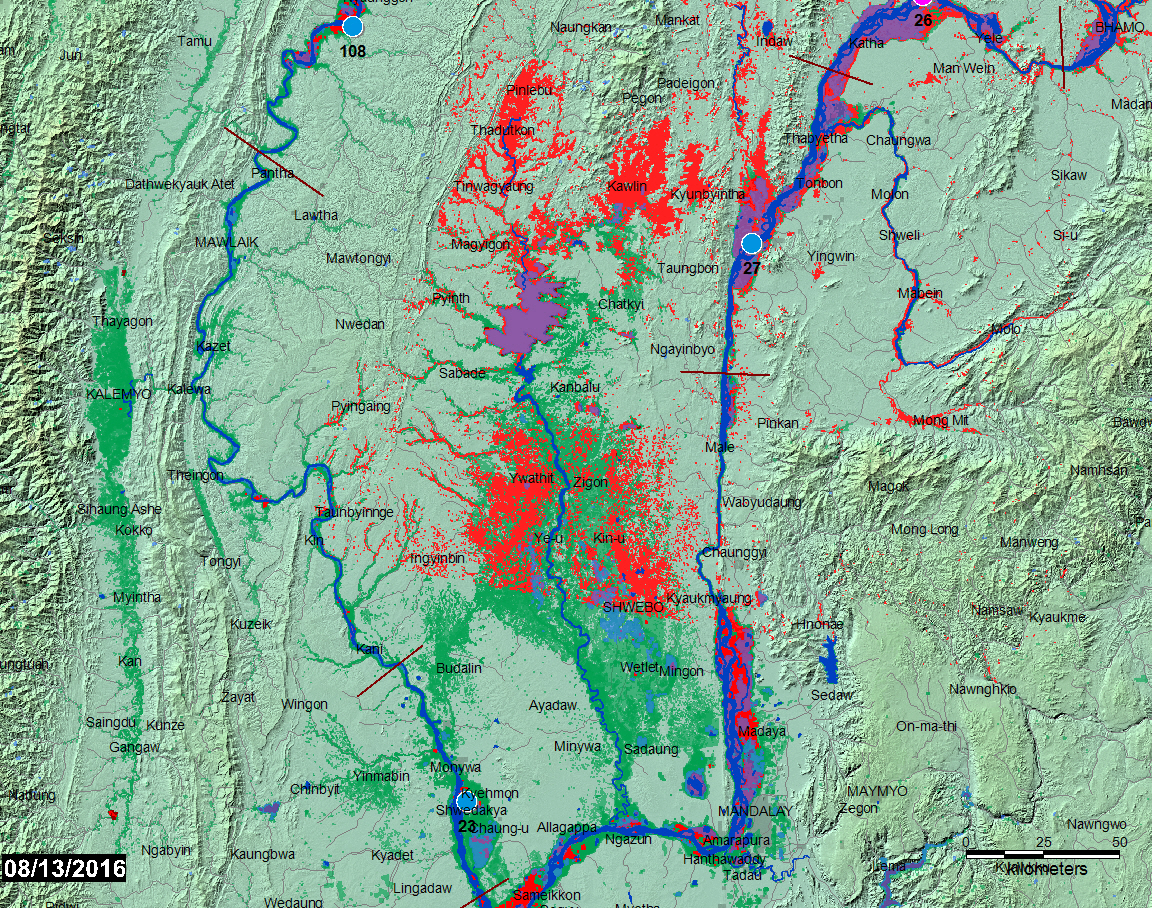
Central Myanmar
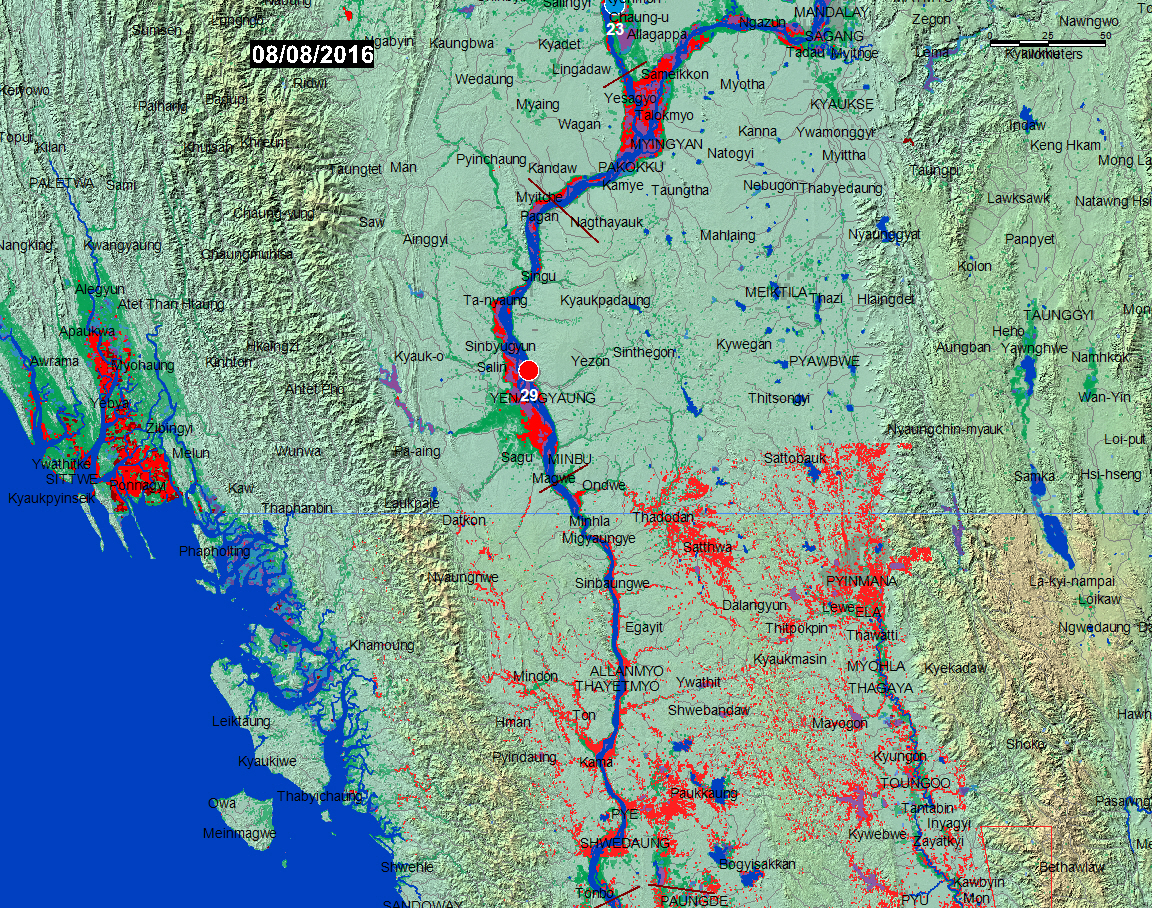
South-Central Myanmar
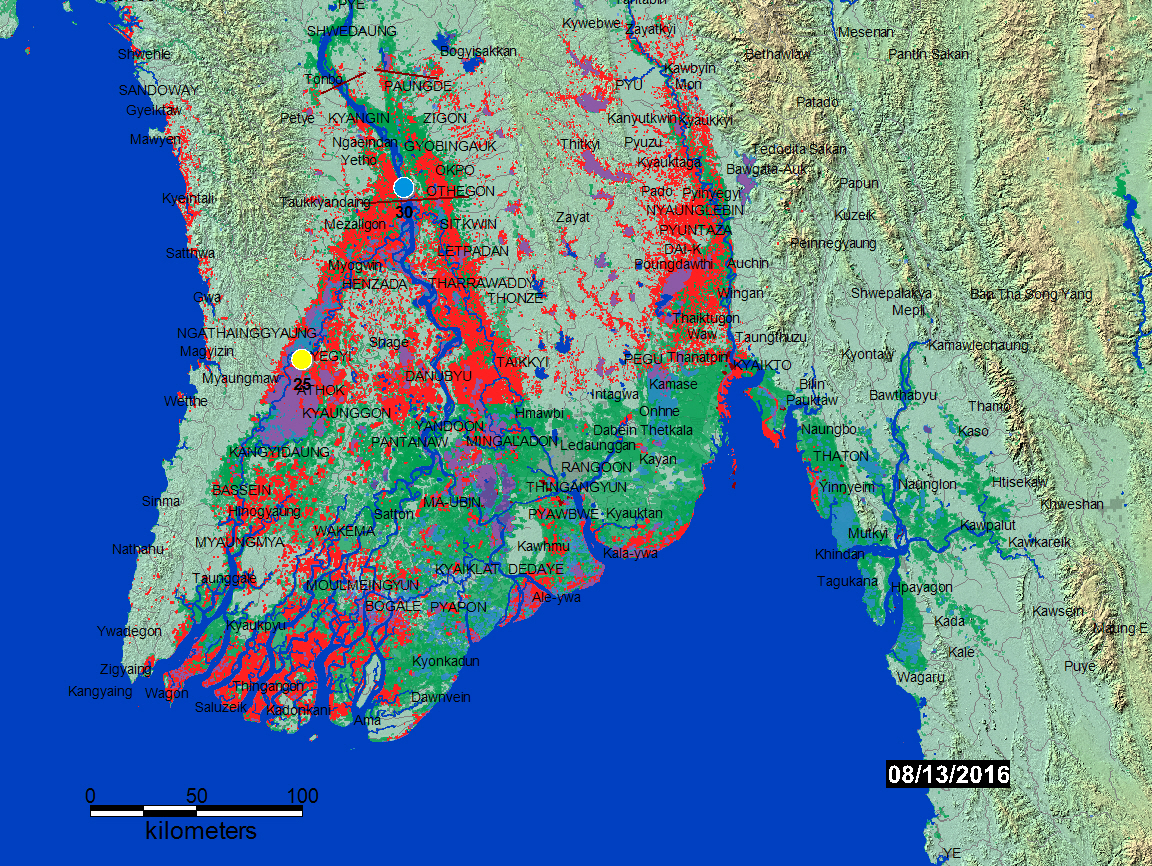
Southern Myanmar
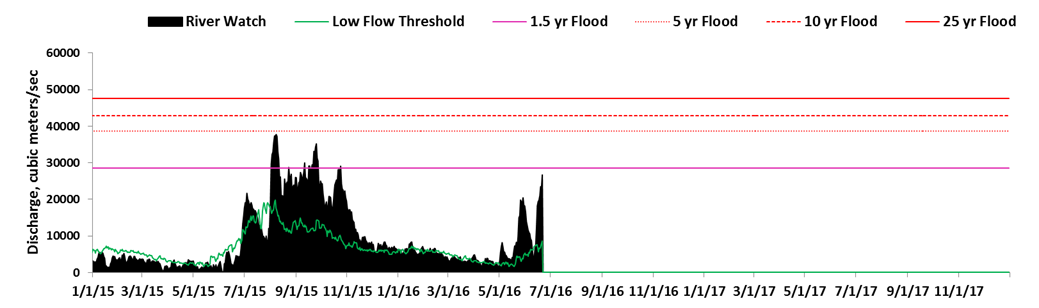
Representative River Watch Information (clickable dots above)
At selected locations, a time series of satellite microwave-based daily river discharge measurements are available from the Flood Observatory. See River Watch Global Display for more information. A sample from Site 30 is shown below.
Explanation
Map Symbology:
Red, flooding. Surface water is larger in extent than the Blue reference water. Blue, Average Annual High Water. Magenta, Surface water is present but within limits of the reference water. Dark Blue, Winter surface water. Light Blue. Previously flooded areas.Source Data:
MODIS water mapping information at a spatial resolution of 250 m is from NASA's Terra and Aqua satellites via an automated water classifier. The Flood Observatory accumulates daily files from a special processor at the NASA GSFC over 14 days (running forward, updated each day). This red and magenta layer provides nearly complete geographic coverage even under cloudy conditions. New artificial reservoirs built since 2000 also appear as magenta.Interpreting These Maps:
Floods in hilly or mountainous regions are difficult remote sensing targets and not always observable. Also, cloud cover or heavy vegetation may restrict the ability to capture flood inundation everywhere. The maps may not illustrate all areas of flooding, and cloud and terrain shadows may be misclassified and falsely mapped as flood water. Current surface water includes both magenta and red colors; red areas are water extended beyond the normal maximum annual extent. Finally, due to the relatively coarse resolution of MODIS 250 m bands, some areas mapped as flooded may include smaller parcels of dry land.Suggested citation:
Brakenridge, G.R., Kettner, A.J., Slayback, D. and Policelli, F., date accessed, "Myanmar Current Flood Conditions", Dartmouth Flood Observatory, University of Colorado, Boulder, Colorado, USA, http://floodobservatory.colorado.edu/Myanmar.htmlSource Data Details:
The Land Atmosphere Near-real-time Capability for EOS (LANCE) system provides daily NASA MODIS data at 250 m spatial resolution. Landsat 8 data, if used, are provided by the U.S. Geological Survey Hazards Data Distribution System. Click here for access to the automated daily .shp file GIS record (record commences in 2011). Choose appropriate 10 deg x 10 deg map sheet directory and appropriate dates; longitude and latitudes refer to upper left map sheet corner.
(counting since June 16, 2016)

This web site and associated data by G. Robert Brakenridge and Albert J. Kettner are licensed under a Creative Commons Attribution 3.0 Unported License.
This work is made possible by data acquired by NASA, the Japanese Space Agency, and the European Space Agency, and funding support from NASA and the European Commission, through the Global Disaster Alert and Coordination System (GDACS) project, Joint Research Centre, Ispra, Italy. The Observatory was founded in 1993 at Dartmouth College, Hanover, NH USA and moved to the University of Colorado, INSTAAR, CSDMS in 2010. The institutional support of both universities is gratefully acknowledged.
http://floodobservatory.colorado.edu/Flood Observatory