


DFO Flood Event 4432
Draft
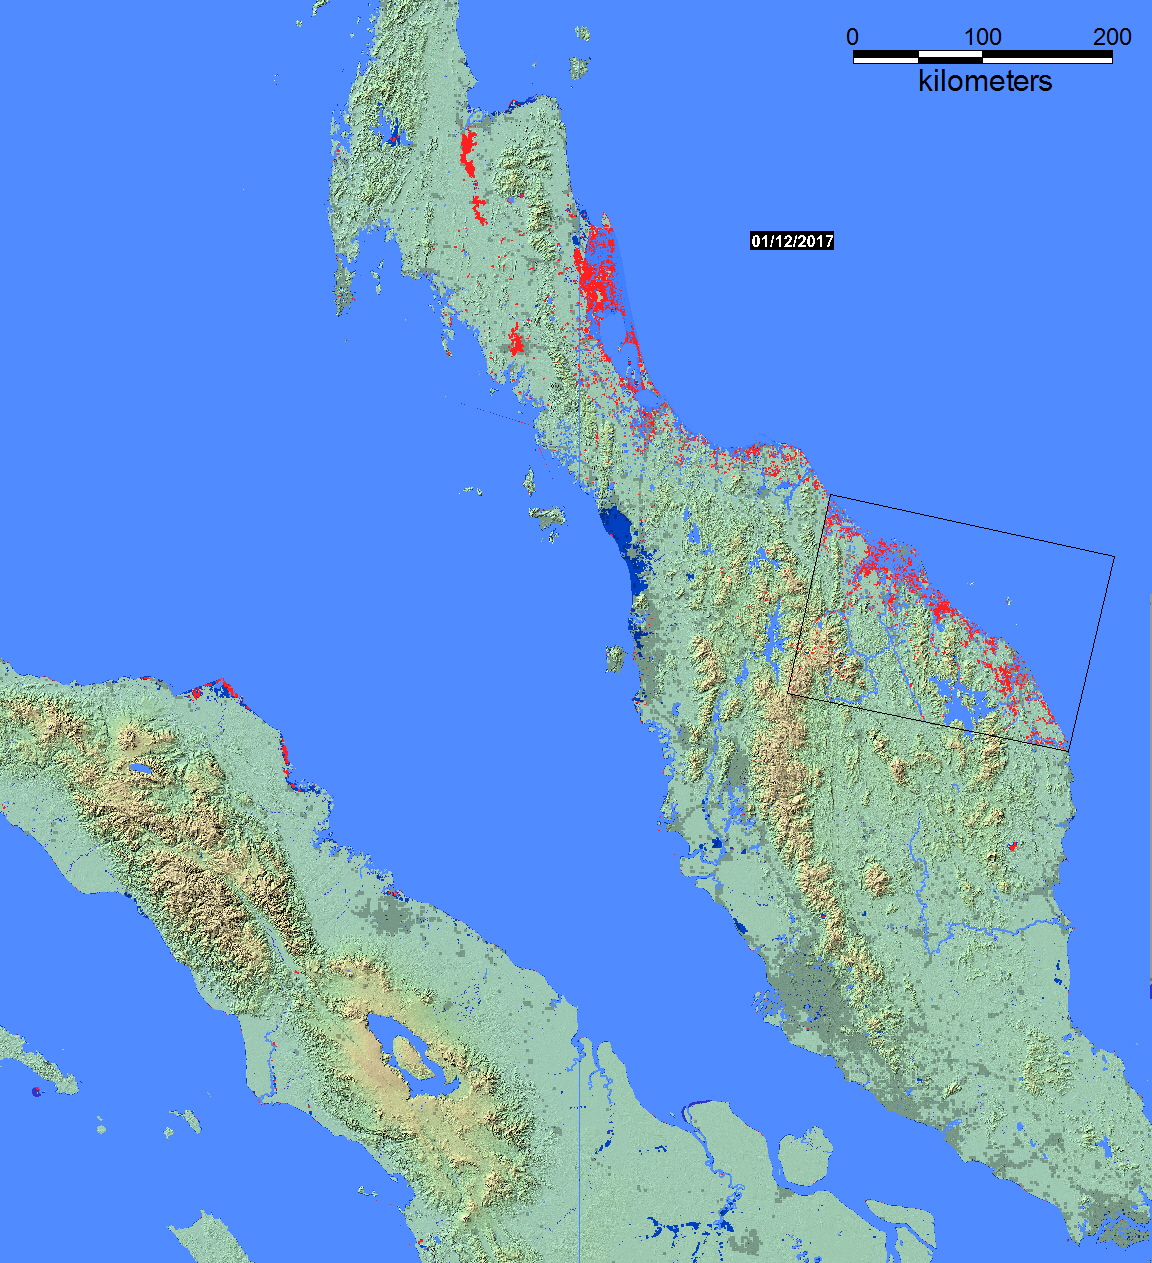
Thailand and Malaysia Flooding, January 10, 2017
Flood Map
Layers, top to bottom: Blue is pre-flood ("normal") surface water mapped by UNOSAT using ESA Sentinel 1, or from NASA SRTM. Red is flood water mapped from ESA Sentinel 1 SAR data by UNOSAT/UNITAR (black frame, see below) or via MODIS. Dark blue is maximum water extent mapped via Landsat or Modis.
Large Geotif version
Google Earth kmz version
Related Data
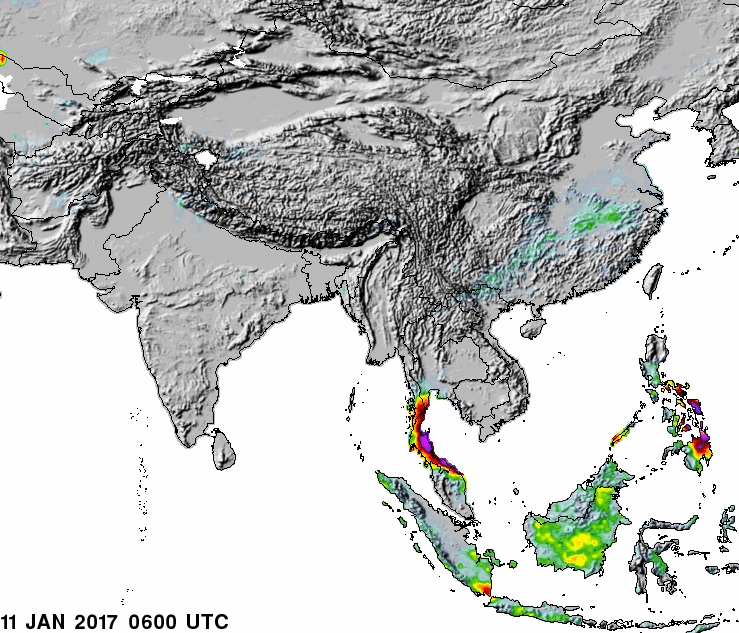
Satellite-measured precipitation, modeled flooding, and atmospheric moisture related to this flood event
 |
 |
.png) |
|
|
Flood depth above threshold, from GFMS.
|
Explanation
Event Reporting:
The Flood Observatory maintains a Global Active Archive of large flood events, 1985 to present. It is available to the public in both spreadsheet and GIS formats (both formats together provide the complete Archive). New events are entered into this archive each week. As of the end of 2016, there were 4432 events; each has a unique archive number.
Event Mapping:
In some cases, severe or damaging floods become the focus of Observatory inundation mapping. As part of collaborations with other organizations, and the Global Flood Partnership, the Observatory's maps and other data are made available to the public. With attribution, they can be used freely, including for commercial purposes, under the terms of the Creative Commons Attribution 3.0 Unported License. Geotif versions and GIS files are also provided for these maps through the links below. This event is selected for Observatory production of map and GIS data products.This web page and associated image and map (GIS) files are the permanent Flood Observatory record of this event.
This Event:
This Flood List link provides a summary. According to Flood List: "Thailand’s Department of Disaster Prevention and Mitigation (DDPM) report that 21 people have now died in the floods affecting southern provinces of the country. At least 11 provinces are in emergency situations as a result of flooding which has affected over 1 million people. Thai Meteorological Department have forecast further heavy rain until Tuesday, 10 January. Nakhon Si Thammarat airport closed from 06 January and will possibly re-open today, 09 January. Thai news agency NNT said that the province of Nakhon Si Thammarat has suffered its worst flood crisis in 30 years with 300,000 people affected and seven people dead. Unusually heavy rain for this time of year, influenced by low depression and the strong northeast monsoon, has caused widespread flooding in southern provinces of Thailand since 01 January, 2017. This is the second deadly flood event within a month in south Thailand. At least 11 people died and 350,000 were affected after flooding struck southern provinces in December 2016. As of 07 January the affected provinces included Pattani, Yala, Narathiwat, Songkhla, Phattalung, Trang, Nakhon Sri Thammarat, Krabi, Surat Thani, Chumphon and Ranong "
Suggested citation:
Brakenridge, G.R.., date accessed, "DFO Flood Event 4432", Dartmouth Flood Observatory, University of Colorado, Boulder, Colorado, USA, http://floodobservatory.colorado.edu/Events/2017Thailand4432/2017Thailand44328.html
Image Data Sources:
NASA Landsat 8 and ESA Sentinel 1data used in this map were obtained from the the U.S. Geological Survey Hazards Data Distribution System. Landsat 8 is jointly managed by NASA and the United States Geological Survey. Flood modeling results are from the NASA/University of Maryland Global Flood Monitoring System (GFMS), Drs. Robert Adler and Huan Wu, University of Maryland/ESSIC.
GIS Data Sources:
GIS files supporting this Flood Event Map are located here. In this map, GIS normal and flood inundation limits from ESA Sentinel data published by UNOSAT/UNITAR are included (black frame).
Click here for access to the automated daily MODIS-derived .shp file GIS record (record commences in 2011). Choose appropriate 10 deg x 10 deg map sheet directory and appropriate dates; longitude and latitudes refer to upper left map sheet corner.
The Global Surface Water Explorer provides part of the (dark blue) maximum surface water extent layer. It is based on Landsat data at a spatial resolution of ~ 30m (Jean-Francois Pekel, Andrew Cottam, Noel Gorelick, Alan S. Belward, High-resolution mapping of global surface water and its long-term changes. Nature 540, 418-422, 2016). On the map, it is shown together with NASA NRT Global Flood Mapping maximum water extent for the years 2013-2015. DFO creates these annual water extent layers from data provided by that project by accumulating into one annual file all of the daily .shp files.
Related Data:
Global Flood Monitoring System (GFMS) displays, if provided, are from the University of Maryland. Reference: Wu, H., R. F. Adler, Y. Tian, G. J. Huffman, H. Li, and J. Wang (2014), Real-time global flood estimation using satellite-based precipitation and a coupled land surface and routing model, Water Resour. Res., 50, doi:10.1002/2013WR014710. Global Flood Awareness System (GloFAS) displays, if provided, are from the European Commission Joint Research Centre and the European Centre for Medium-Range Weather Forecasts. Reference: Alfieri, L., Burek, P., Dutra, E., Krzeminski, B., Muraro, D., Thielen, J., and Pappenberger, F.: GloFAS – global ensemble streamflow forecasting and flood early warning, Hydrol. Earth Syst. Sci., 17, 1161-1175, doi:10.5194/hess-17-1161-2013, 2013.
Support provided by:
The Disasters Program of NASA Applied Sciences to the University of Colorado. GPM and AMSR-2 satellite microwave data for River Watch specially processed first within GDACS at the Joint Research Center of the European Commission. DFO participates in the Global Flood Partnership.

(counting since January 10, 2017)