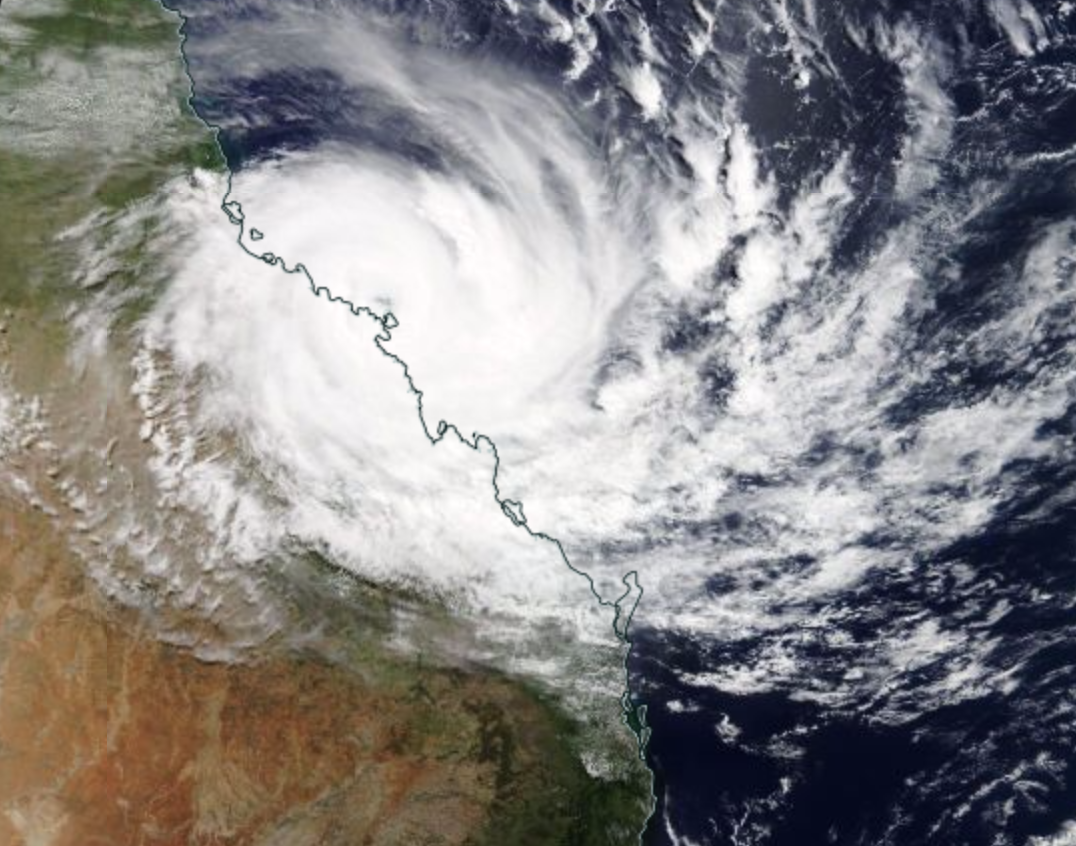
Landfall of Debbie, March 28, 2017, from NASA WORLDVIEW MODIS Data
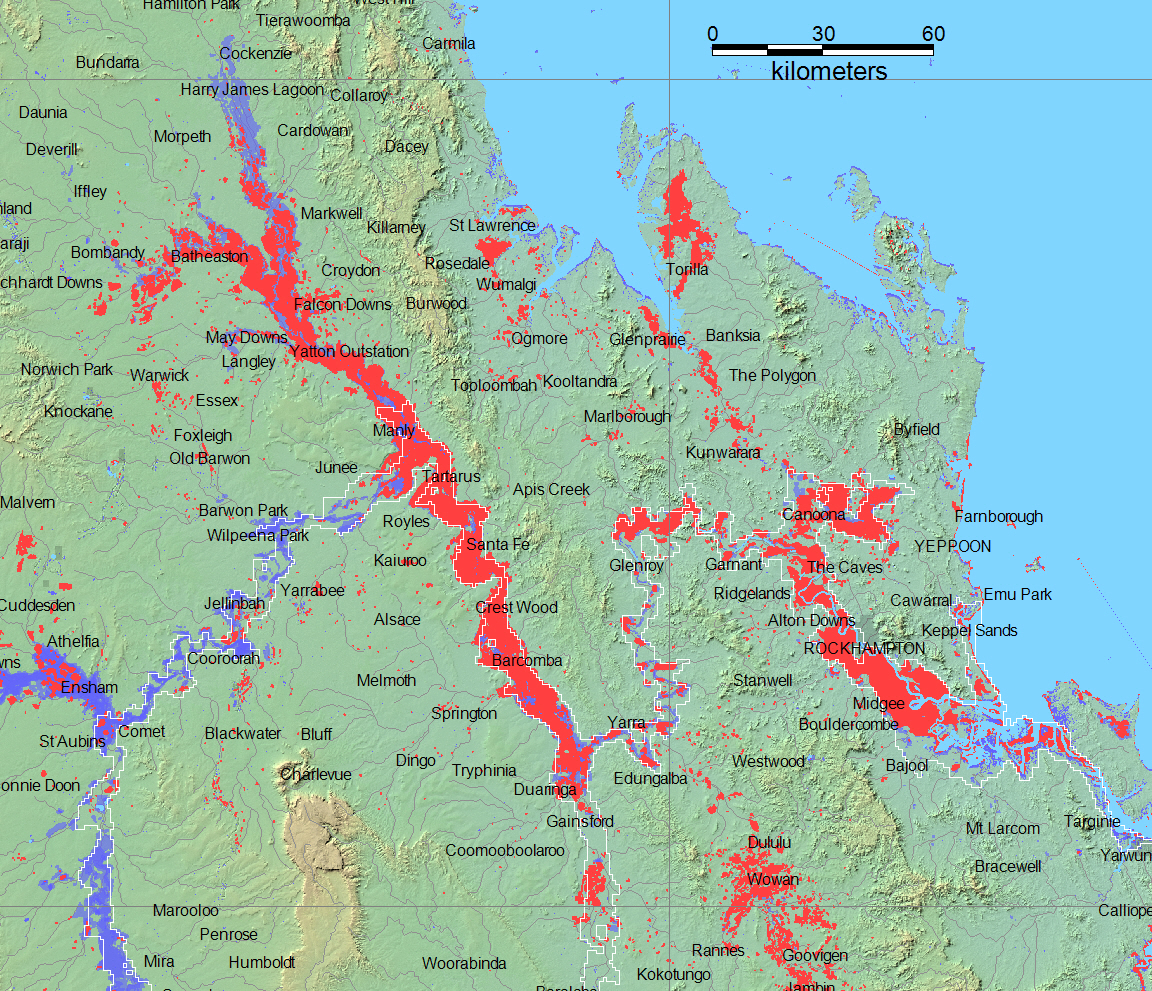
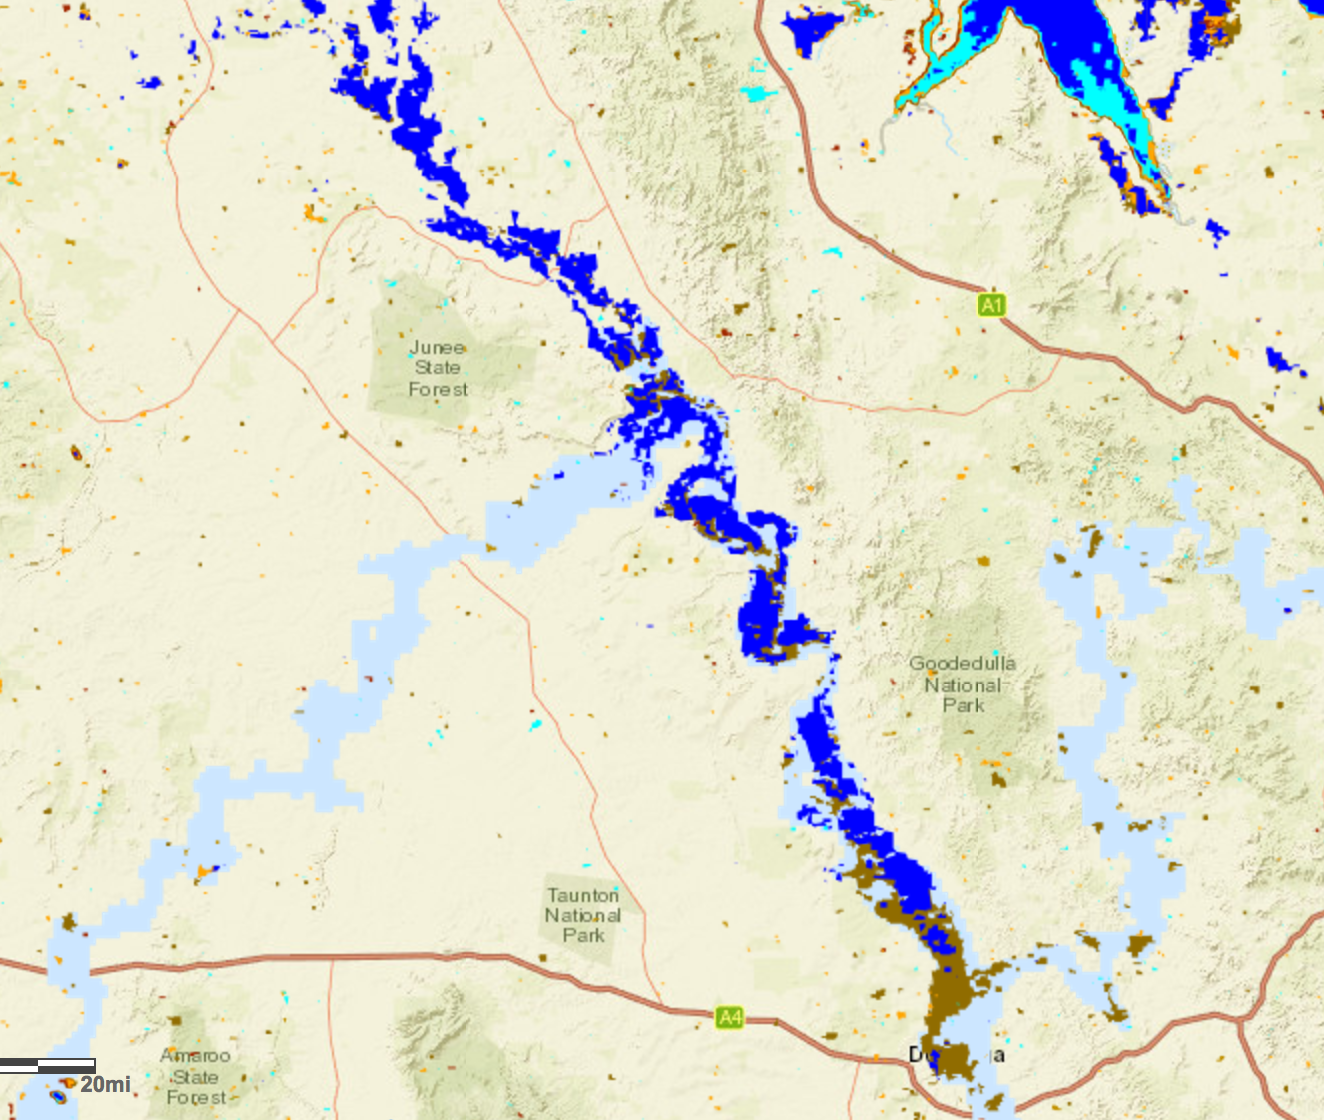
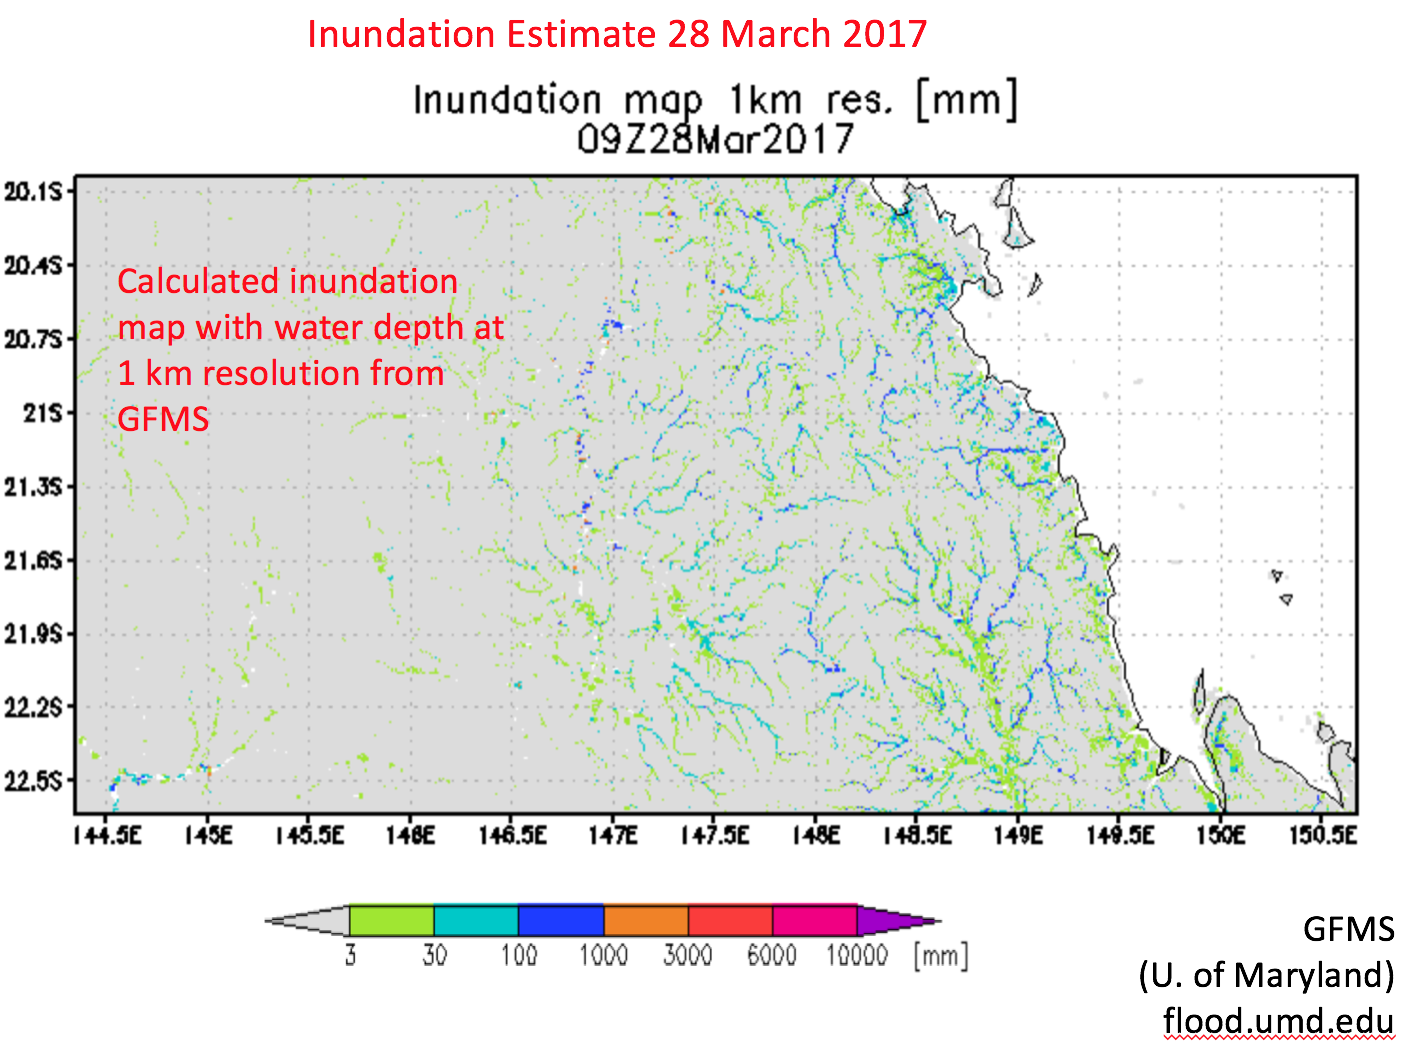
Predicted Inundation For March 28, 2017 |
Also see DFO Web Map Server (sample below) |
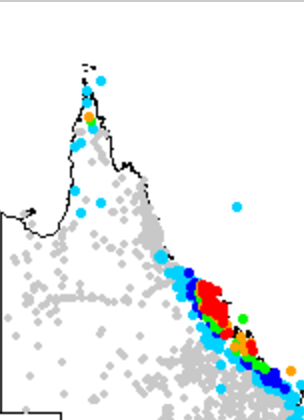
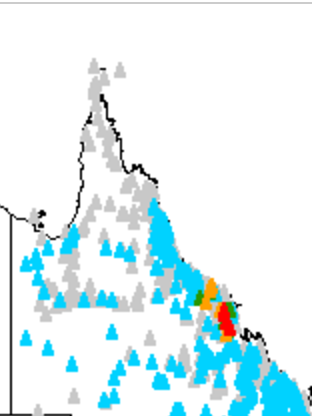
Forecast of flooding from University of Maryland Global Flood Monitoring Sytem March 30, 2017
|
|---|---|---|
 |
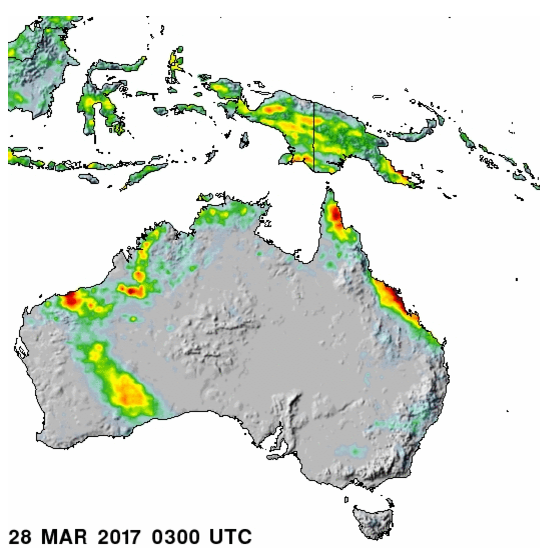
24 hour precipitation, March 28, 2017, from Australian Bureau of Meteorology |
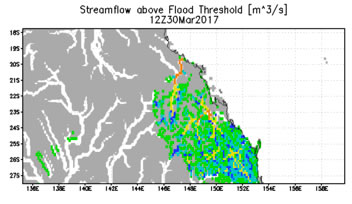
River conditions, March 28, 2017, from Australian Bureau of Meteorology |
7-day satellite rainfall, from NASA GSFC
|
|---|---|---|
The Flood Observatory maintains a Global Active Archive of large flood events, 1985 to present. It is available to the public in both spreadsheet and GIS formats (both formats together provide the complete Archive). New events are entered into this archive each week. As of the end of 2016, there were 4432 events; each has a unique archive number.
This Flood List link provides a summary. According to Flood List (March 31, 2017): "Heavy rainfall in the wake of ex-Cyclone Debbie has caused major flooding in the states of Queensland and New South Wales. Canungra in Queensland recorded 285 mm of rain in 1 day. In New South Wales Mullumbimby recorded over 300 mm of rain in 24 hours and the Tweed River reached levels not seen for over 40 years.Authorities have ordered over 20,000 people to evacuate their homes. Police in New South Wales have reported 2 possible flood-related deaths".
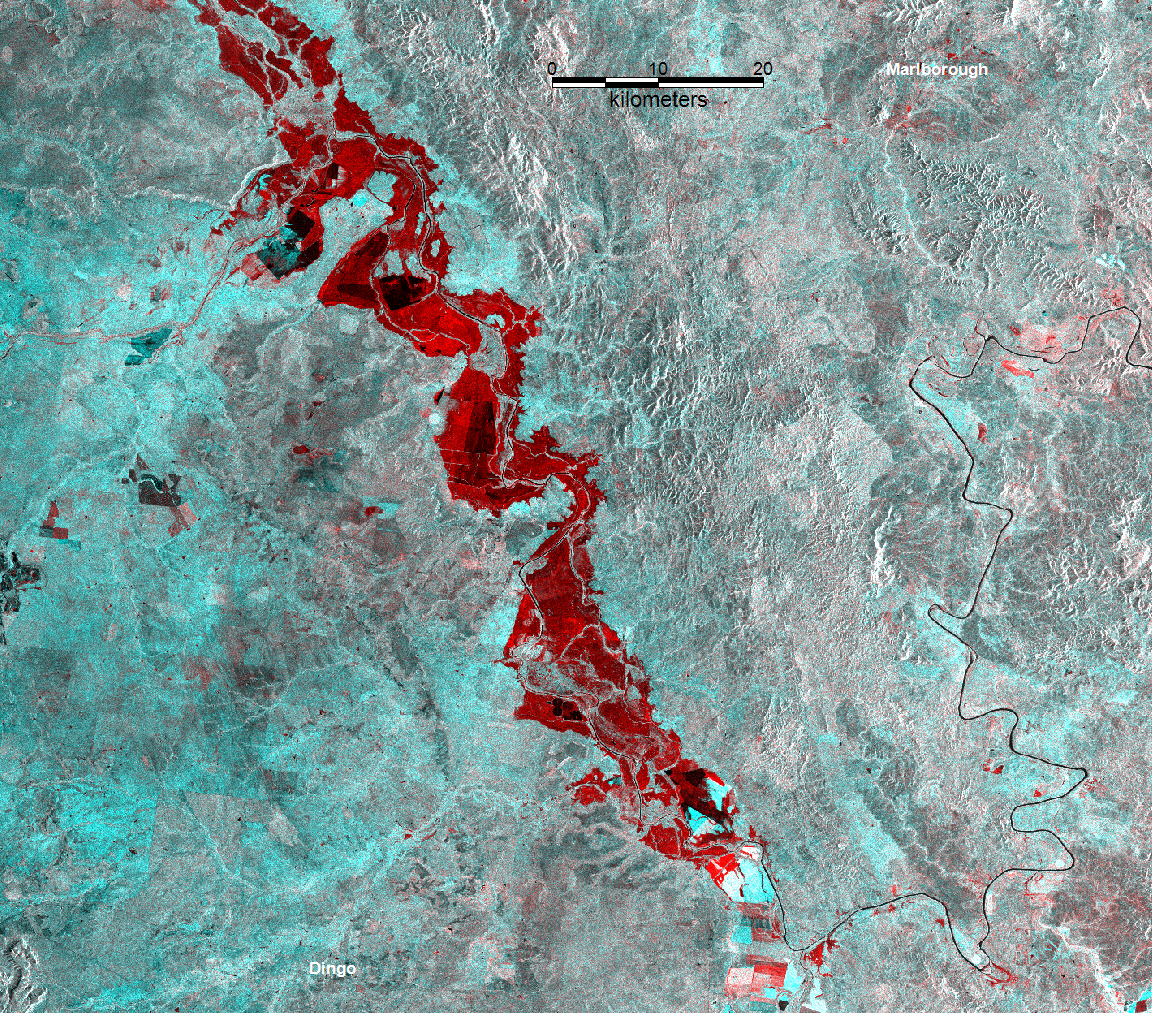
NASA Landsat 8 and ESA Sentinel SAR data if used in this map were obtained from the the U.S. Geological Survey Hazards Data Distribution System. and the Sentinels Science Data hub, respectively. Landsat 8 is jointly managed by NASA and the United States Geological Survey. Flood modeling results if used are from the NASA/University of Maryland Global Flood Monitoring System (GFMS), Drs. Robert Adler and Huan Wu, University of Maryland/ESSIC.
GIS Data Sources:
GIS files supporting this Flood Event Map are located here.
Click here for access to the automated daily MODIS-derived .shp file GIS record (record commences in 2011). Choose appropriate 10 deg x 10 deg map sheet directory and appropriate dates; longitude and latitudes refer to upper left map sheet corner.
The Global Surface Water Explorer provides part of the (dark blue) annual surface water extent layer. It is based on Landsat data at a spatial resolution of 30 m (Jean-Francois Pekel, Andrew Cottam, Noel Gorelick, Alan S. Belward, High-resolution mapping of global surface water and its long-term changes. Nature 540, 418-422, 2016). On the map, it is shown together with the NASA Shuttle Water Boundary Data (SWBD) surface water extent (90 m resolution) processed from the 11-day February, 2000, SRTM mission and corrected using Landsat data. Large flood events are not normally depicted in either data set. Thus, red areas on our maps show flood extent beyond these more typical water extents
When used, NASA NRT Global Flood Mapping maximum water extent for the years 2013-2015, at 250 m spatial resolution, provide part of the (dark blue) maximum flood mapped. DFO creates these annual water extent layers from data provided by that project, by accumulating into one annual file all of the daily .shp files for each year. DFO has also produced flood extent files through mapping of individual floods (~ yr 2000 to present); these are also included where available in this maximum flood extent layer.
(counting since March 28, 2017)