


DFO Flood Event 4384
Bihar, India Flooding, July 23-September 1, 2016 from MODIS and SNP/VIIRS Data
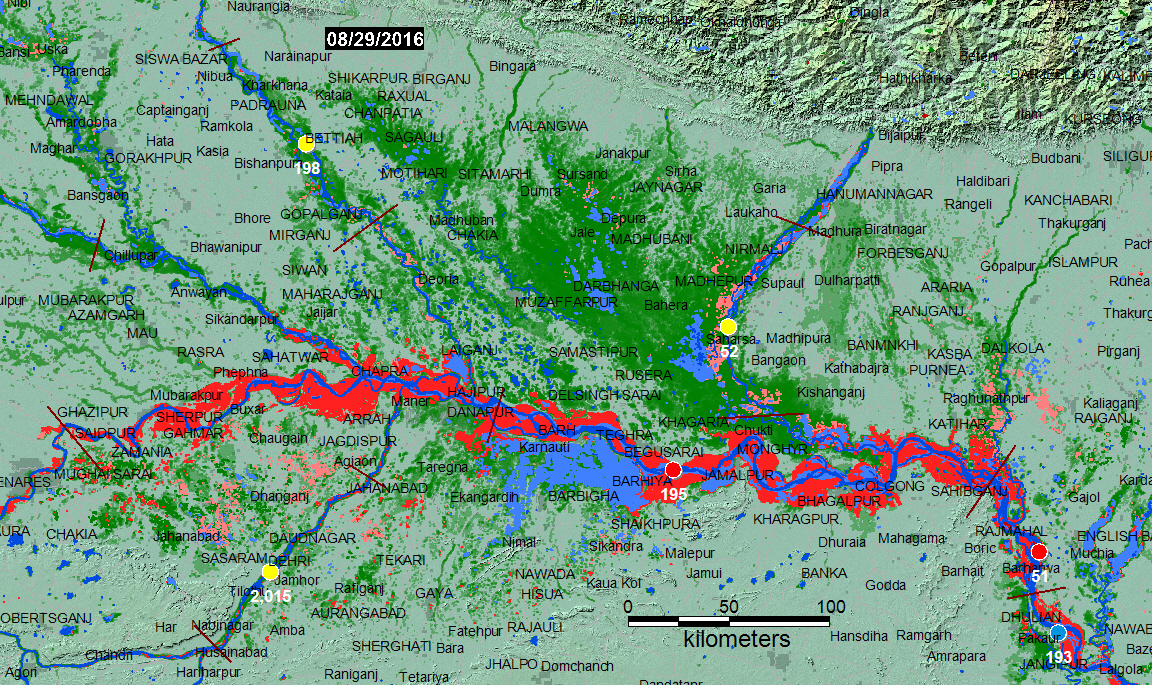
Flood Map With Typical Annual High Water Mask
Red is flood water during past 14 days exceeding typical annual high water. Light red is previous flooding during this event. Green is previous flooding, 2000-present. Dark blue is surface water during February 2002. Light blue is typical annual high water (2014).
Geotif version
Google Earth kmz version
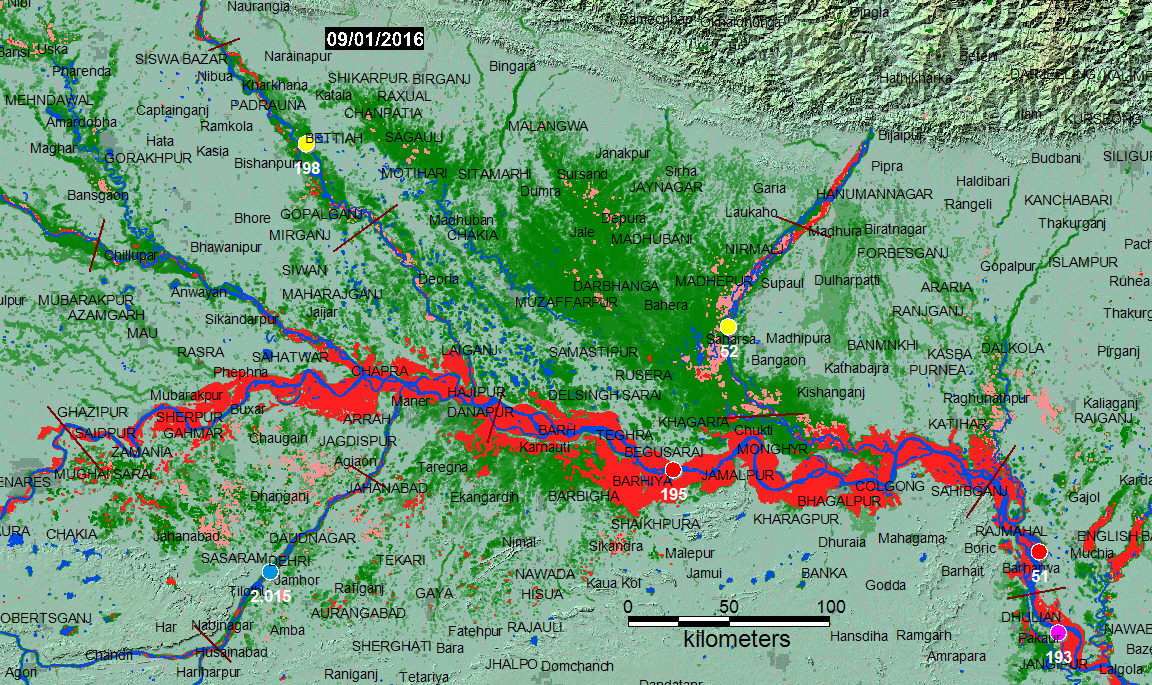
Flood Map Without Typical Annual High Water Mask
Red is flood water during past 14 days. Light red is previously flooded land during this event. Green is previous flooding, 2000-present. Dark blue is surface water during February 2002. Red and Light Red together show maximum flood extent for this event.
Geotif version
Google Earth kmz version
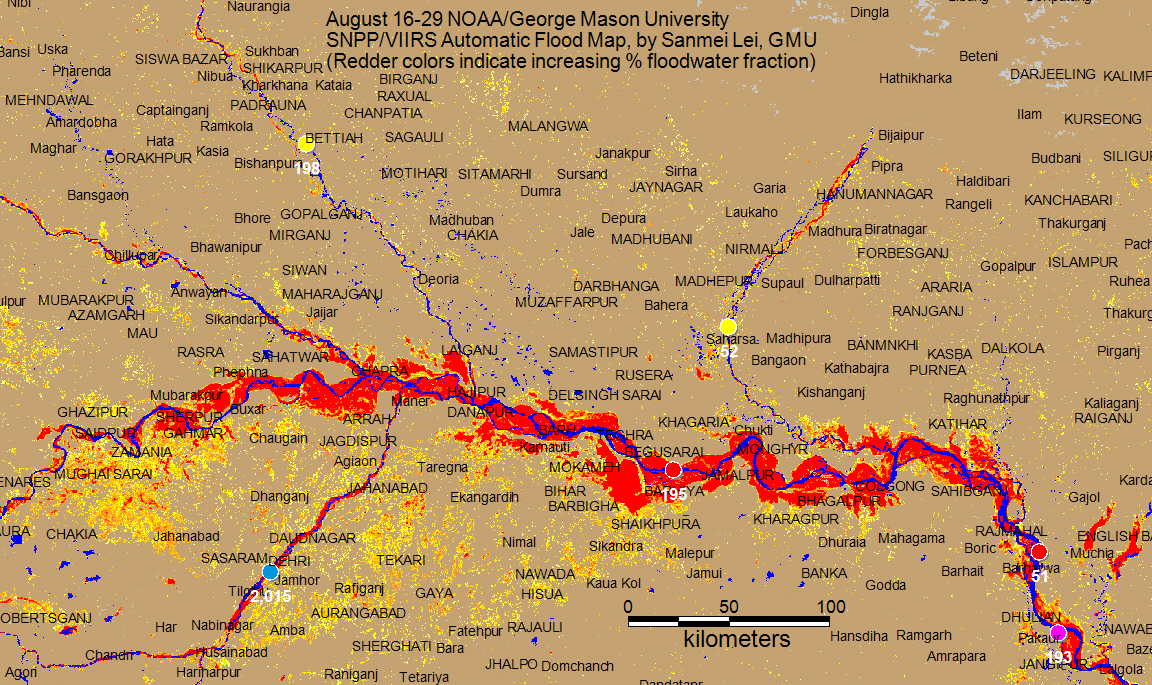
NOAA/George Mason University Flood Map Without Typical Annual High Water Mask
Red is flood water for compositing period shown; redder colors indicate increasing % floodwater fraction. Dark blue is permanent surface water.
Geotif version
Google Earth kmz version
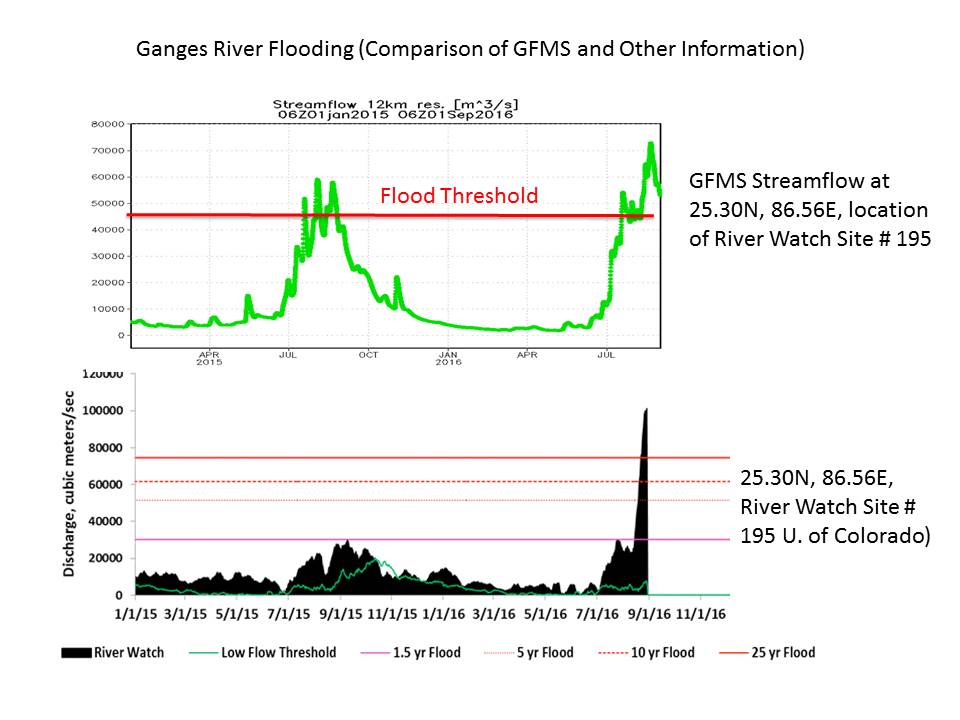
Representative River Watch Flood Hydrograph (clickable dots above)
At selected locations, a time series of satellite microwave-based daily river discharge measurements are available from the Flood Observatory. See River Watch Global Display for more information. A sample from Site 195 is shown below.
Explanation
Event Reporting:
The Flood Observatory maintains a Global Active Archive of large flood events, 1985 to present. It is available to the public in both spreadsheet and GIS formats (both formats together provide the complete Archive). New events are entered into this archive each week. As of the end of 2015, there were 4319 events; each has a unique archive number.
Event Mapping:
In some cases, severe or damaging floods become the focus of Observatory inundation mapping. As part of collaborations with other organizations, and the Global Flood Partnership, the Observatory's maps and other data are made available to the public. With attribution, they can be used freely, including for commercial purposes, under the terms of the Creative Commons Attribution 3.0 Unported License. Geotif versions and GIS files are also provided for these maps through the links below. This event is selected for Observatory production of map and GIS data products.This web page and associated image and map (GIS) files are the permanent Flood Observatory record of this event.
This Event:
This Flood List link provides a summary. According to Flood List:"Over 20 people have died in the last 2 days as the flood situation in Bihar, India, worsened once again.The Department of Disaster Management in Bihar reported yesterday that 22 people have been killed in the floods since 01 August. The brings the total number of flood-related fatalities to 60 since the current flooding began in mid July.The deaths were reported from Purnea (24), Katihar (15), Supual (8), Kisanganj (5), Madhepura (4), Gopalganj (2), and 1 each in Saharsa and Araria.On 28 July, officials reports said that over 1,500 villages had been flooded. That figure has since risen dramatically and, as of 02 August, stood at 2,200." See also updated Flood List summary.
According to several River Watch sites along the Ganges River, flooding in late July-early August exceeded the calculated 25 yr recurrence interval and was the flood of record, 1998-2016.
Caution:
Floods in hilly or mountainous regions are difficult remote sensing targets and not always observable. Also, cloud cover or heavy vegetation may restrict the ability to capture peak inundation everywhere. The maps may not illustrate all areas of flooding, and cloud and terrain shadows may be misclassified and falsely mapped as flood water. Finally, due to the relatively coarse resolution of MODIS 250 m bands, some areas mapped as flooded may include smaller parcels of dry land and many small areas of flooding may not be detected and mapped.
Suggested citation:
Brakenridge, G.R., Kettner, A.J., Slayback, D., Lei, San Mei, and Policelli, F., date accessed, "Flood Event 2016-India-4384", Dartmouth Flood Observatory, University of Colorado, Boulder, Colorado, USA, http://floodobservatory.colorado.edu/Events/2016India4384/2016India4384.html
Mapping Data Sources:
The Land Atmosphere Near-real-time Capability for EOS (LANCE) system provides daily NASA MODIS data at 250 m spatial resolution. Landsat 8 data, if used, are provided by the U.S. Geological Survey Hazards Data Distribution System. Landsat 8 is jointly managed by NASA and the United States Geological Survey. VIIRS data are processed to flood maps by a NOAA-supported project at George Mason University and are provided courtesy Dr. Sanmei Lei. COSMO-SkyMed synthetic aperture radar (SAR) data, when used, are provided by the Italian Space Agency (ASI) as a contribution to the CEOS Flood Pilot. Sentinel SAR data, when used, are provided by the European Space Agency. NASA EO-1 satellite tasking and data are provided by Stuart Frye and colleagues at the NASA Goddard Space Flight Center. MODIS data beginning in year 2012 are based on an automated product provided by the MODIS NRT Flood project at the NASA Goddard Space Flight Center. Non-automated, MODIS-based .shp or MapInfo GIS files supporting this Flood Event Map are located in a map sheet folder here together with any other high resolution (using Landsat 8, EO-1, etc) GIS files.Click here for access to the automated daily .shp file GIS record (record commences in 2011). Choose appropriate 10 deg x 10 deg map sheet directory and appropriate dates; longitude and latitudes refer to upper left map sheet corner.
Related Data:
Global Flood Monitoring System (GFMS) displays, if provided, are from the University of Maryland. Reference: Wu, H., R. F. Adler, Y. Tian, G. J. Huffman, H. Li, and J. Wang (2014), Real-time global flood estimation using satellite-based precipitation and a coupled land surface and routing model, Water Resour. Res., 50, doi:10.1002/2013WR014710. Global Flood Awareness System (GloFAS) displays, if provided, are from the European Commission Joint Research Centre and the European Centre for Medium-Range Weather Forecasts. Reference: Alfieri, L., Burek, P., Dutra, E., Krzeminski, B., Muraro, D., Thielen, J., and Pappenberger, F.: GloFAS – global ensemble streamflow forecasting and flood early warning, Hydrol. Earth Syst. Sci., 17, 1161-1175, doi:10.5194/hess-17-1161-2013, 2013.
Support provided by:
The Disasters Program of NASA Applied Sciences to the University of Colorado. GPM and AMSR-2 satellite microwave data for River Watch specially processed first within GDACS at the Joint Research Center of the European Commission. DFO participates in the Global Flood Partnership.
(counting since August 5, 2016)