


The Flood Observatory maintains a Global Active Archive of large flood events, 1985 to present. This listing is available to the public in both spreadsheet and GIS formats (both formats together provide the complete Archive). New events are entered into this archive each week. As of the end of 2016, there were 4432 events; each has a unique archive number. A single GIS polygon for each event defines in approximate terms the total area affected.
In some cases, severe or damaging floods become the focus of Observatory inundation mapping. As part of collaborations with other organizations, and the Global Flood Partnership, the Observatory's maps and other data are made available to the public. With attribution, they can be used freely, including for commercial purposes, under the terms of the Creative Commons license shown below. Geotif versions and GIS files are also provided for these maps through the links below.
This event is selected for Observatory production of map and GIS data products.This web page and associated image and map (GIS) files are the permanent Flood Observatory record of this event. As the flood event proceeds, additional flood extent layers are added; the objective is mapping of the maximum extent flooded.
Provided here is brief information leading to the selection of this flood for mapping.
Media/Agency reports: According to UN OCHA ReliefWeb: "April 13, 2017, Argentina, Bolivia, Paraguay y Uruguay Argentina, Bolivia, Paraguay and Uruguay are also responding to emergencies caused by the heavy rains. Flooding on the Argentine-Paraguay border has displaced thousands of people on both sides of the border. Paraguayan authorities have mobilized some 13 tons of humanitarian aid to the area. In Argentina, more than 90,000 people are affected by the floods and authorities have sent food aid to the area. In northern Uruguay, about 830 people have evacuated from flooded areas and three main roads are closed. In Bolivia, the accumulation of rain since December has killed 20 people and affected about 75,000."
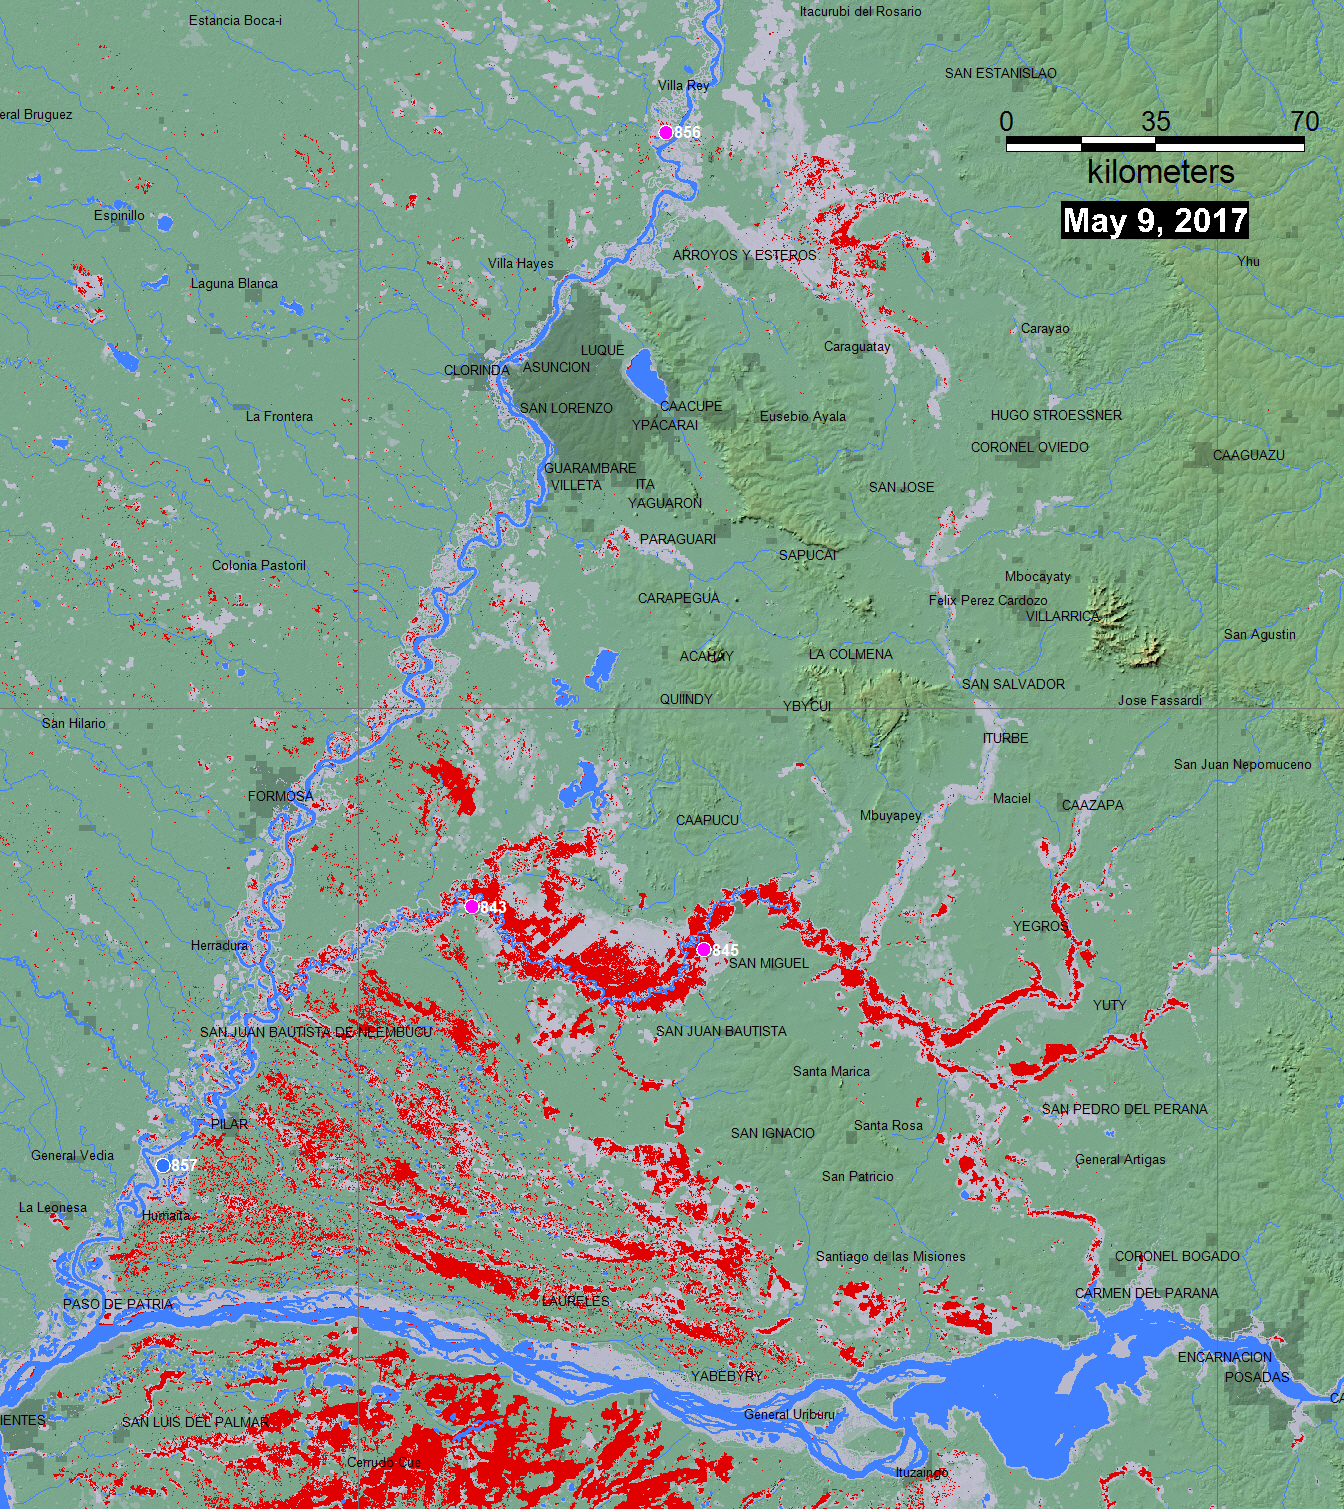
From the map: As of May 9, Tebicuary River was in flood, and River WatchSsite 845iindicate this to be major flooding: nearly the 10 year event, based on the 1998-present period of record. The mapped flood along much of this river reach is larger than the maximum surface water extent obtained in 2016 (at Site 845, early 2016 experienced approximately the 5 year event).
In addition to the maps above, for web map service-based (WMS) information visit this DFO link. Zoom in to location of interest, and turn on appropriate event and other data layers. See this link for examples of WMS output for this flood.
Brakenridge, G.R. and Kettner, A. J., date accessed, "DFO Flood Event #", Dartmouth Flood Observatory, University of Colorado, Boulder, Colorado, USA, http address. Other citations to data incorporated in DFO maps are provided below.

The maps and web page are by G. R. Brakenridge and A. J. Kettner and are provided here under the terms of a Creative Commons Attribution-NonCommercial-ShareAlike 4.0 International License.
NASA Landsat 8 and ESA Sentinel SAR data if used in this map were obtained from the the U.S. Geological Survey Hazards Data Distribution System. and the Sentinels Science Data hub, respectively. Landsat 8 is jointly managed by NASA and the United States Geological Survey.
Notes on Sentinel SAR data processing: Most commonly, two "exact repeat" images are retrieved from ESA's Sentinels Data hub, from before the flood and during the flood. ESA SNAP software is used to reproject the two images into a geographic (latitude and longitude) coordinate system. A 5x5 low pass filter is applied to both images. A threshold ranging from 50-60 is applied to the flood image, resulting in a subset of only very dark (interpreted as water) pixels. A threshold of .5-.7 is applied to a flood image/preflood image ratio product, resulting in a subset of pixels much darker in the flood image then before (this removes permanent surface water). A Boolean "AND" step then provides only pixels that satisfy both conditions.The exact thresholds used vary in the ranges provided; more strict thresholds map less flood water but also produce less false-positive errors. GIS vectors (polygons) are fit around pixels in the final "flood water" result: the red areas on the flood event maps, and the provided shp files.
Flood extent files (Shp or Mapinfo) supporting this Flood Event Map are located here.
These files may include high spatial resolution mapping such as from Sentinel or Landsat, or lower resolution files from MODIS. File names commonly include the sensor source (e.g., S1 for Sentinel 1, LS8 for Landsat, MODIS for MODIS).
Click here for access to an automated daily MODIS-derived .shp file GIS record (record commences in 2011). Choose appropriate 10 deg x 10 deg map sheet directory and appropriate dates; longitude and latitudes refer to upper left map sheet corner. Not all floods are mappable at the MODIS spatial resolution of 250 m, Some DFO event maps also include these automated MODIS data.
Data from the Global Surface Water Explorer is included as part of the light gray previous satellite-mapped water extent. It is based on Landsat data at a spatial resolution of 30 m (Jean-Francois Pekel, Andrew Cottam, Noel Gorelick, Alan S. Belward, High-resolution mapping of global surface water and its long-term changes. Nature 540, 418-422, 2016). The NASA Shuttle Water Boundary Data (SWBD) surface water extent (90 m resolution), blue, was derived from NASA's the 11-day February, 2000, SRTM mission and this "permanent" water layer was also corrected using Landsat data.
When used, NASA NRT Global Flood Mapping maximum water extent for the years 2013-2015, at 250 m spatial resolution, provide part of the (light gray) previous satellite-mapped water extent layer. DFO creates these annual water extent layers from data provided by that project, by accumulating into one annual file all of the daily .shp files for each year. DFO has also produced flood extent files through mapping of individual floods (~ yr 2000 to present); these are also included in this layer.
River Watch satellite gauging sites provide passive microwave radiometry-based measurements of daily river discharge. Click on the colored map dots to retrieve the discharge record. The graphic below shows an example result from Site 845. At this site on the Tebicuary River, flooding was almost as large as the 10 year recurrence interval event.
The AIST Flood Model layer, if provided here, represents a 6-year simulation (2006-2011) of flood inundation from the 2-D LISFLOOD-FP flood model and shows the predicted maximum extent of flooding during that period. The model is conditioned on event-continuous flows as simulated by the Water Balance Model (WBM), a large-scale hydrological model. The river network used in the 2-D flood model is based on Landsat, for rivers larger than 50 m in width, and the floodplain topography is from the SRTM-DEM. The resulting accuracy of floodplain inundation is affected by the accuracy of the flow simulation and by any errors in the topography. DFO combines this flood model layer with all previously mapped flooding to produce a flood hazard layer suitable for comparison with new flood events.
Global Flood Monitoring System (GFMS) displays, if provided here, are from the University of Maryland. Reference: Wu, H., R. F. Adler, Y. Tian, G. J. Huffman, H. Li, and J. Wang (2014), Real-time global flood estimation using satellite-based precipitation and a coupled land surface and routing model, Water Resour. Res., 50, doi:10.1002/2013WR014710.
Global Flood Awareness System (GloFAS) displays, if provided, are from the European Commission Joint Research Centre and the European Centre for Medium-Range Weather Forecasts. Reference: Alfieri, L., Burek, P., Dutra, E., Krzeminski, B., Muraro, D., Thielen, J., and Pappenberger, F.: GloFAS – global ensemble streamflow forecasting and flood early warning, Hydrol. Earth Syst. Sci., 17, 1161-1175, doi:10.5194/hess-17-1161-2013, 2013.
From: the NASA Earth Sciences Program, the Latin American Development Bank, the World Bank, the European Commission (Global Disaster Alert and Coordination System, GDACS), the Google Earth Engine research awards program, the Committee on Earth Observation Satellites (CEOS) Disasters Working Group-Flood Pilot, the Japanese Space Agency, and the European Space Agency. All support this work via research grants and contracs or by provision of free satellite-derived data.
The Dartmouth Flood Observatory was founded in 1993 at Dartmouth College, Hanover, NH USA and moved to the University of Colorado, INSTAAR, CSDMS in 2010. The institutional support of both universities is gratefully acknowledged.
(counting since May 21, 2017)