


The Flood Observatory maintains a Global Active Archive of large flood events, 1985 to present. It is available to the public in both spreadsheet and GIS formats (both formats together provide the complete Archive). New events are entered into this archive each week. As of the end of 2016, there were 4432 events; each has a unique archive number.
According to Flood List: "USA – More Record Rain in California, 1000s Evacuate Floods in San Jose (Updated) 22 FEBRUARY, 2017 BY RICHARD DAVIES IN NEWS, USA Update The mandatory evacuation area in San Jose has been expanded and now includes around 14,00 residents. In a statement earlier today, the City said: "Although the rain has largely stopped, flooding is continuing along Coyote Creek as reservoirs continue to spill and creek flow is extremely high. The area for mandatory evacuation has expanded and includes approximately 14,000 residents…" The area is along Coyote Creek, in the Coyote Creek 100 year flood zone plus approximately 250 feet, running from north of 280 to south of 101. Residents in the San Jose area should stay informed of events and can check regular updates here. Original Report, 10:20 CET, 22 February 2017 Hundreds of residents in San José were evacuated yesterday, 21 February, after levels of the Coyote Creek rose rapidly following further heavy rainfall in California. In Tuolumne County the heavy rain forced officials to open a spillway at the Don Pedro reservoir for the first time in 20 years. The latest series of downpours swept across northern California from Sunday 19 February to Tuesday 22 February. The National Weather Service (NWS) said the storm had weakened on Tuesday but further heavy storms are expected to hit Northern California this weekend. Venado in Sonoma County recorded more than 230 mm of rain in 72 hours. NWS said that daily rainfall records were broken in San Jose and San Francisco. Coyote Creek at Edenvale reached its highest ever level.".
For a web map service-based information, visit this DFO link and, zoom in to location of interest, and turn on appropriate data layers.
NASA Landsat 8 and ESA Sentinel SAR data if used in this map were obtained from the the U.S. Geological Survey Hazards Data Distribution System. and the Sentinels Science Data hub, respectively. Landsat 8 is jointly managed by NASA and the United States Geological Survey. Flood modeling results if used are from the NASA/University of Maryland Global Flood Monitoring System (GFMS), Drs. Robert Adler and Huan Wu, University of Maryland/ESSIC.
Event-specific water extent files supporting this Flood Event Map are located here. These may include high spatial resolution mapping such as from Sentinel or Landsat, or lower resolution files from MODIS. Draft versions may be posted and later revised; such revisions will include in the file names "r1", "r2", etc. The older files remain in this folder but generally should not be used. Both MapInfo and Shp formats are provided.
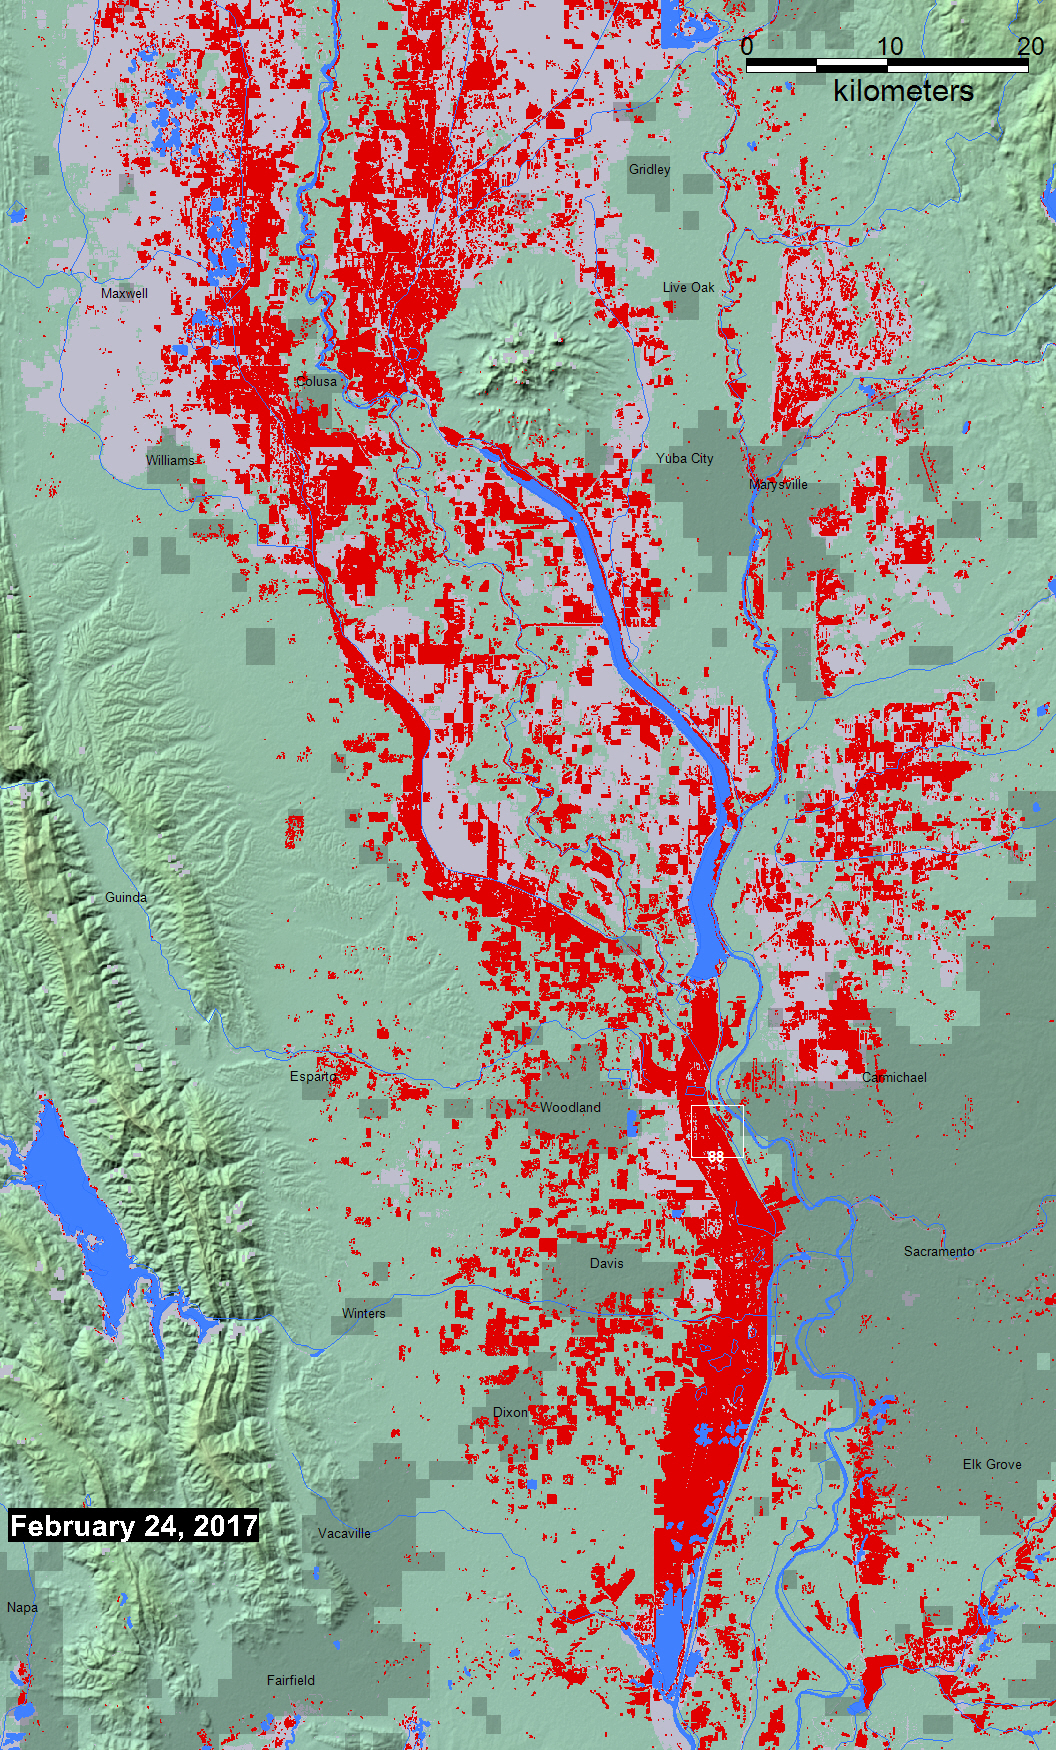
Notes on Sentinel SAR data processingj for this map: Two "exact repeat" images were retrieved from ESA's Sentinels Data hub, from before the flood (February 25, 2015) and during the flood (February 24, 2017). ESA SNAP software was used to reproject the two images intoa geographic (latitude and longitude) coordinate system. A 5x5 low pass filter was applied to both images. A threshold of 30 was applied to the flood image, resulting in a subset of only very dark (interpreted as water) pixels. A threshold of .3 was applied to a flood image/preflood image ratio product, resulting in a subset of pixels much darker in the flood image then before (this removes permanent surface water). A boolean "AND" step then provides only pixels that satisfy both conditions. GIS vectors (polygons) were then fit around pixels in this "flood water" result: red area on this map, and also provided as a shp file.
Click here for access to the automated daily MODIS-derived .shp file GIS record (record commences in 2011).
Data from the Global Surface Water Explorer (a download data link is provided) is included as part the light reddish gray maximum previous water extent layer. It is based on Landsat data at a spatial resolution of 30 m (Jean-Francois Pekel, Andrew Cottam, Noel Gorelick, Alan S. Belward, High-resolution mapping of global surface water and its long-term changes. Nature 540, 418-422, 2016). On the map, it is shown beneath the NASA Shuttle Water Boundary Data (SWBD) surface water extent (90 m resolution), blue, processed from the 11-day February, 2000, SRTM mission and corrected using Landsat data.
When used, NASA NRT Global Flood Mapping maximum water extent for the years 2013-2015, at 250 m spatial resolution, provide part of the (light reddish gray) maximum flood mapped. DFO creates these annual water extent layers from data provided by that project, by accumulating into one annual file all of the daily .shp files for each year. DFO has also produced flood extent files through mapping of individual floods (~ yr 2000 to present); these are also included where available in this maximum flood extent layer.
At selected locations, a time series of satellite microwave-based daily river discharge measurements are available from the Flood Observatory. See River Watch Global Display for more information. A sample from Site 88 is shown below.
Global Flood Monitoring System (GFMS) displays, if provided here, are from the University of Maryland. Reference: Wu, H., R. F. Adler, Y. Tian, G. J. Huffman, H. Li, and J. Wang (2014), Real-time global flood estimation using satellite-based precipitation and a coupled land surface and routing model, Water Resour. Res., 50, doi:10.1002/2013WR014710. Global Flood Awareness System (GloFAS) displays, if provided, are from the European Commission Joint Research Centre and the European Centre for Medium-Range Weather Forecasts. Reference: Alfieri, L., Burek, P., Dutra, E., Krzeminski, B., Muraro, D., Thielen, J., and Pappenberger, F.: GloFAS – global ensemble streamflow forecasting and flood early warning, Hydrol. Earth Syst. Sci., 17, 1161-1175, doi:10.5194/hess-17-1161-2013, 2013.
(counting since April 25, 2017)