


The Flood Observatory maintains a Global Active Archive of large flood events, 1985 to present. It is available to the public in both spreadsheet and GIS formats (both formats together provide the complete Archive). New events are entered into this archive each week. As of the end of 2016, there were 4432 events; each has a unique archive number.
According to Flood List: "Dominican Republic – Floods Displace Thousands After 400 mm of Rain in 24 Hours 26 April, 2017 by Richard Davies in Americas, News. Flooding has caused major problems in at least 6 provinces in the Dominican Republic after staggering amounts of rainfall over the last few days. According to the country’s meteorological office (ONAMET), almost 400 mm of rain fell in 24 hours in Barahona between 22 and 23 April, 2017. Further heavy rain has fallen since, mostly in southern areas of the country. In their latest report of 25 April, the Emergency Operations Centre (Centro de Operaciones de Emergencias – COE) says that flooding has affected several areas in Santo Domingo, San Cristóbal, Monte Plata, Sánchez Ramírez, Duarte and Barahona provinces. Several rivers have overflowed, including the Ozama, Yuna, Cevicos, Manoguayabo and Haina. As many as 3,429 homes have been damaged or affected by the flooding, with around 9 houses completely destroyed. Emergency services and military have rescued 153 people. COE says that 17,145 people have been forced to evacuate their homes. Just over 300 people were being housed in official shelters in San Cristóbal (297) and Barahona (14). The heavy rain is part of the same server weather system that has brought flooding to Jamaica and Haiti over the last few days. This is the second major flood event in 2 months in the Dominican Republic. In March 2017 flooding in northern areas displaced around 1,7000 people. Late last year the country suffered two devastating floods. In October Hurricane Matthew caused deaths and major damage. The following month several days of heavy rain caused flooding in northern areas once again, displacing around 20,000."
For a web map service-based information, visit this DFO link and, zoom in to location of interest, and turn on appropriate data layers.
NASA Landsat 8 and ESA Sentinel SAR data if used in this map were obtained from the the U.S. Geological Survey Hazards Data Distribution System. and the Sentinels Science Data hub, respectively. Landsat 8 is jointly managed by NASA and the United States Geological Survey. Flood modeling results if used are from the NASA/University of Maryland Global Flood Monitoring System (GFMS), Drs. Robert Adler and Huan Wu, University of Maryland/ESSIC.
Event-specific water extent files supporting this Flood Event Map are located here. These may include high spatial resolution mapping such as from Sentinel or Landsat, or lower resolution files from MODIS. Draft versions may be posted and later revised; such revisions will include in the file names "r1", "r2", etc. The older files remain in this folder but generally should not be used. Both MapInfo and Shp formats are provided.
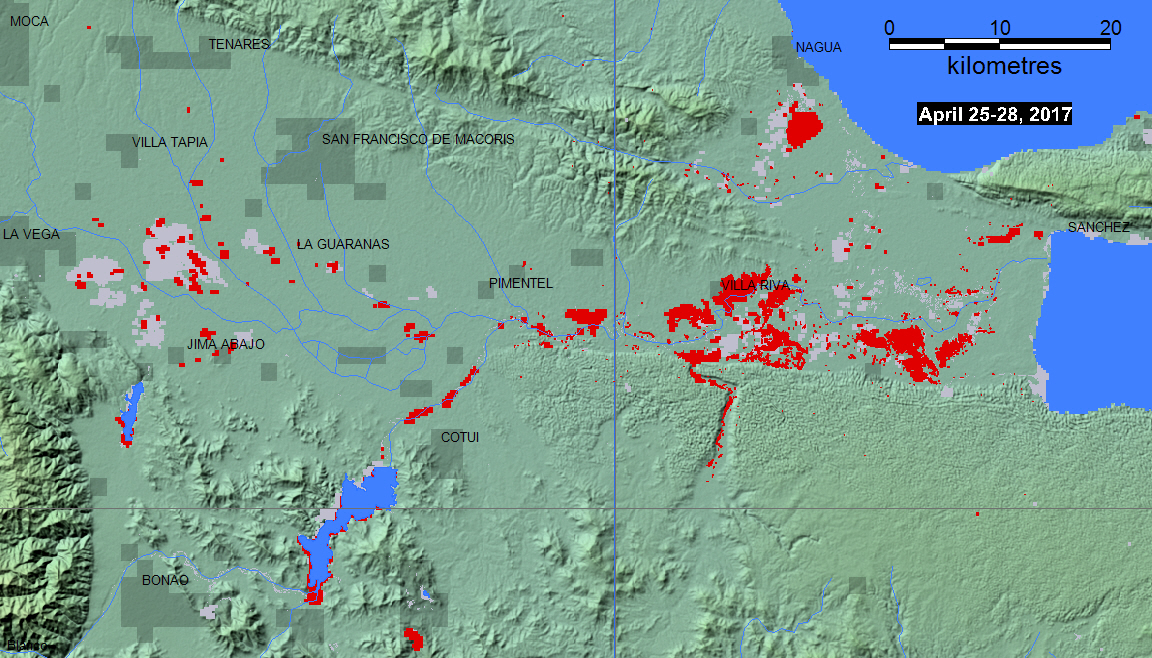
Notes on Sentinel SAR data processingj for this map: Two "exact repeat" images were retrieved from ESA's Sentinels Data hub, from before the flood (February 25, 2015) and during the flood (February 24, 2017). ESA SNAP software was used to reproject the two images intoa geographic (latitude and longitude) coordinate system. A 5x5 low pass filter was applied to both images. A threshold of 50 was applied to the flood image, resulting in a subset of only very dark (interpreted as water) pixels. A threshold of .7 was applied to a flood image/preflood image ratio product, resulting in a subset of pixels much darker in the flood image then before (this removes permanent surface water). A Boolean "AND" step then provides only pixels that satisfy both conditions. GIS vectors (polygons) were fit around pixels in this "flood water" result: red area on this map, and also provided as a shp file.
Click here for access to the automated daily MODIS-derived .shp file GIS record (record commences in 2011). Choose appropriate 10 deg x 10 deg map sheet directory and appropriate dates; longitude and latitudes refer to upper left map sheet corner; not all floods are mappable at the MODIS spatial resolution of 250 m)
Data from the Global Surface Water Explorer (a download data link is provided) is included as part the light reddish gray maximum previous water extent layer. It is based on Landsat data at a spatial resolution of 30 m (Jean-Francois Pekel, Andrew Cottam, Noel Gorelick, Alan S. Belward, High-resolution mapping of global surface water and its long-term changes. Nature 540, 418-422, 2016). On the map, it is shown beneath the NASA Shuttle Water Boundary Data (SWBD) surface water extent (90 m resolution), blue, processed from the 11-day February, 2000, SRTM mission and corrected using Landsat data.
When used, NASA NRT Global Flood Mapping maximum water extent for the years 2013-2015, at 250 m spatial resolution, provide part of the (light reddish gray) maximum flood mapped. DFO creates these annual water extent layers from data provided by that project, by accumulating into one annual file all of the daily .shp files for each year. DFO has also produced flood extent files through mapping of individual floods (~ yr 2000 to present); these are also included where available in this maximum flood extent layer.
(counting since April 28, 2017)