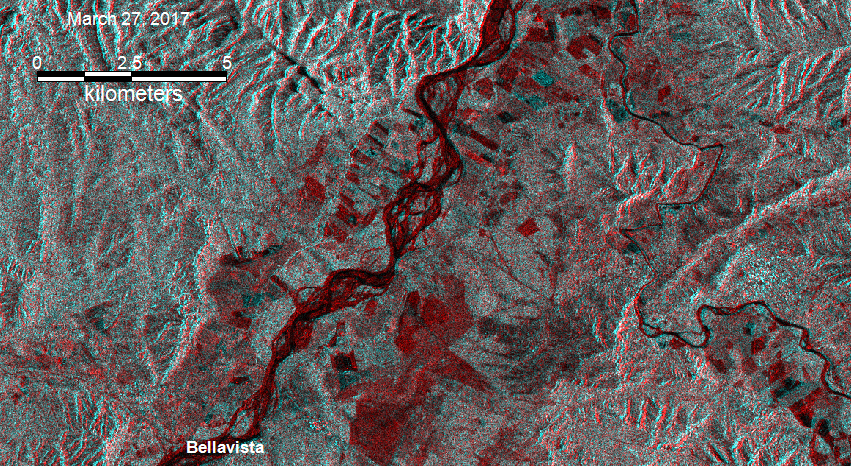
Imagery Sample: Flooding along the Maranon River, northcentral Peru, March 27, 2017 (red) compared to January 19, from ESA Sentinel 1 SAR data
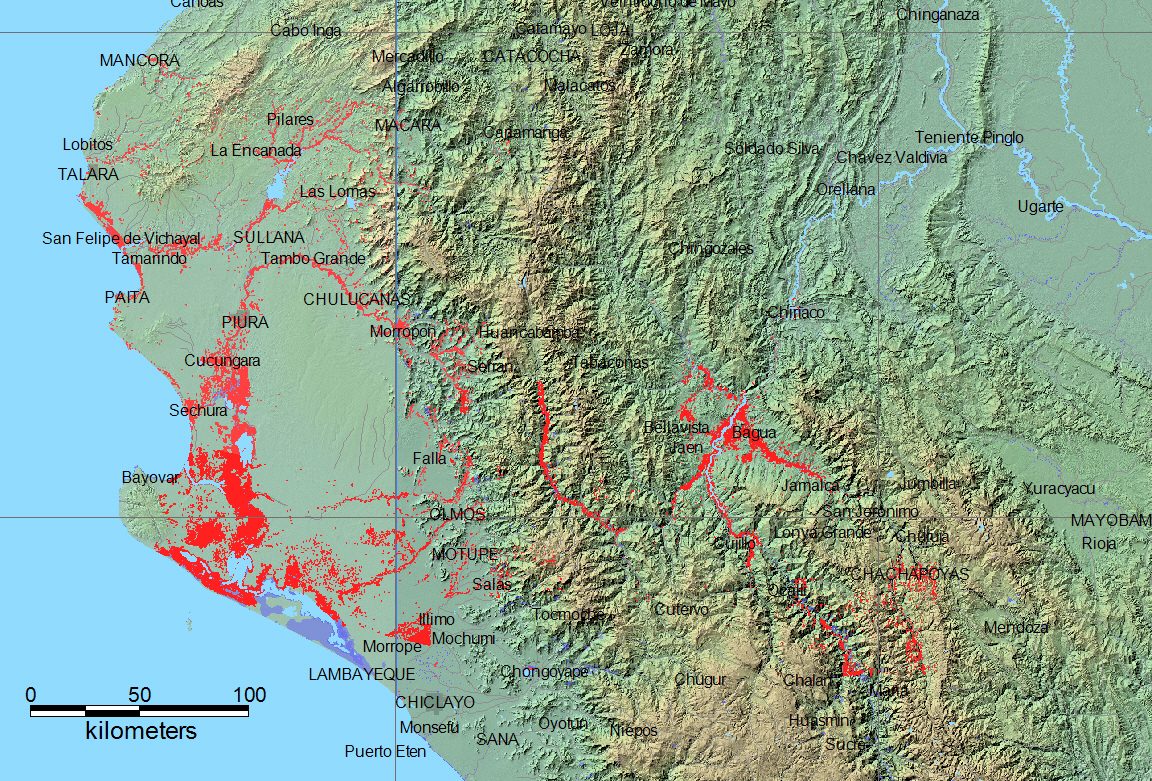
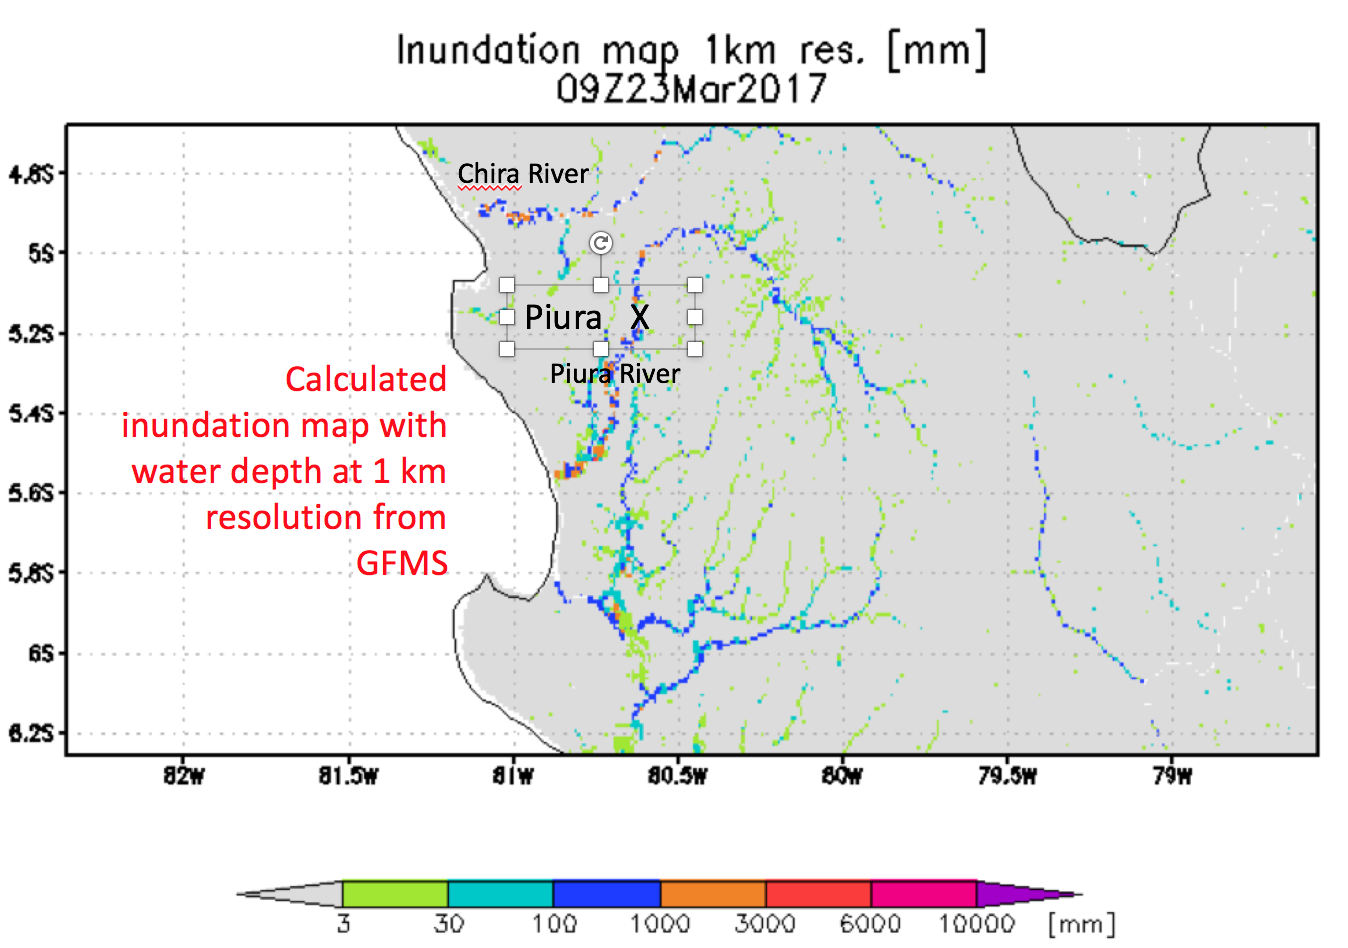
Sample Ouput courtesy Dr. Robert Adler, from Global Flood Monitoring System (U. of Maryland) flood.umd.edu
Predicted Inundation For March 23, 2017 |
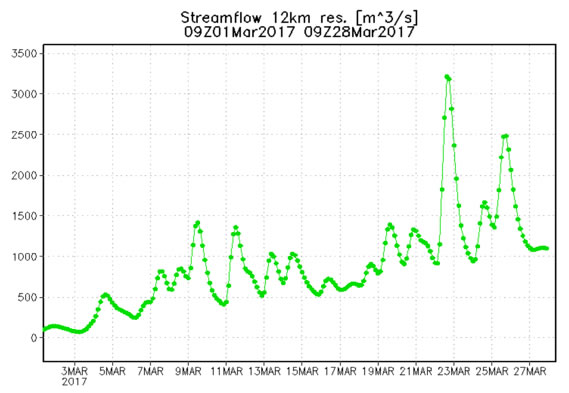
Streamflow at city of Piura already estimated to be well above flood threshold is forecast to decrease today and then have another relative maximum on 25 March . |
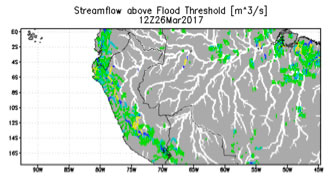
Forecast of Flooding (Streamflow above Flood Threshold) over 23-27 March
|
|---|---|---|
This Flood List link provides a summary. According to Flood List (March 22, 2017): "Heavy rainfall has been affecting the country since December 2016, causing floods and landslides. Local observers are calling the unusual climatic conditions “El Niño Costero” and are blaming the heavy rainfall on higher temperatures of the eastern Pacific Ocean waters. Over the past few days the situation has deteriorated with the death toll now standing at 78 people since December 2016." Also: "On March 10, Climate.gov's Tom DiLiberto said rainfall in this region is running 10 times that of normal: With more than a month left to the season, 2017 is already likely one of the wettest years on record for San Miguel in the Piura province. Around 10 inches of rain has fallen since January 1, when, on average, the entire rainy season usually totals just two inches of rain. Farther inland in the Piura region, a weather station in Morropón recorded 43 inches of rain since the start of 2017. At this point of the year — early March — Morropón's average rainfall is about 4 inches. See Climate.gov report. Also this flood forecast summary from R. Adler at the University of Maryland (ESSIC).
At selected locations, a time series of satellite microwave-based daily river discharge measurements are available from the Flood Observatory. See River Watch Global Display for more information. A sample from Site 1083 is shown below or click on the site location dot above.
NASA Landsat 8 and ESA Sentinel SAR data if used in this map were obtained from the the U.S. Geological Survey Hazards Data Distribution System. and the Sentinels Science Data hub, respectively. Landsat 8 is jointly managed by NASA and the United States Geological Survey. Flood modeling results if used are from the NASA/University of Maryland Global Flood Monitoring System (GFMS), Drs. Robert Adler and Huan Wu, University of Maryland/ESSIC.
GIS Data Sources:
GIS files supporting this Flood Event Map are located here.
Click here for access to the automated daily MODIS-derived .shp file GIS record (record commences in 2011). Choose appropriate 10 deg x 10 deg map sheet directory and appropriate dates; longitude and latitudes refer to upper left map sheet corner.
The Global Surface Water Explorer provides part of the (dark blue) annual surface water extent layer. It is based on Landsat data at a spatial resolution of ~ 30m (Jean-Francois Pekel, Andrew Cottam, Noel Gorelick, Alan S. Belward, High-resolution mapping of global surface water and its long-term changes. Nature 540, 418-422, 2016). On the map, it is shown together with the NASA Shuttle Water Boundary Data (SWBD) surface water extent (90 m resolution) processed from the 11-day February, 2000, SRTM mission. The SWBD information was corrected using Landsat data. Large flood events are not normally depicted in either data set. Thus, red areas on our maps show flood extent beyond these nomal annual limits
When used, NASA NRT Global Flood Mapping maximum water extent for the years 2013-2015, at 250 m spatial resolution, provide part of the (dark blue) maximum flood mapped. DFO creates these annual water extent layers from data provided by that project, by accumulating into one annual file all of the daily .shp files for each year. DFO has also produced abundant flood extent files through mapping of individual floods; these are also included where available in this maximum flood extent layer.
(counting since March 24, 2017)