


DFO Flood Event 4402
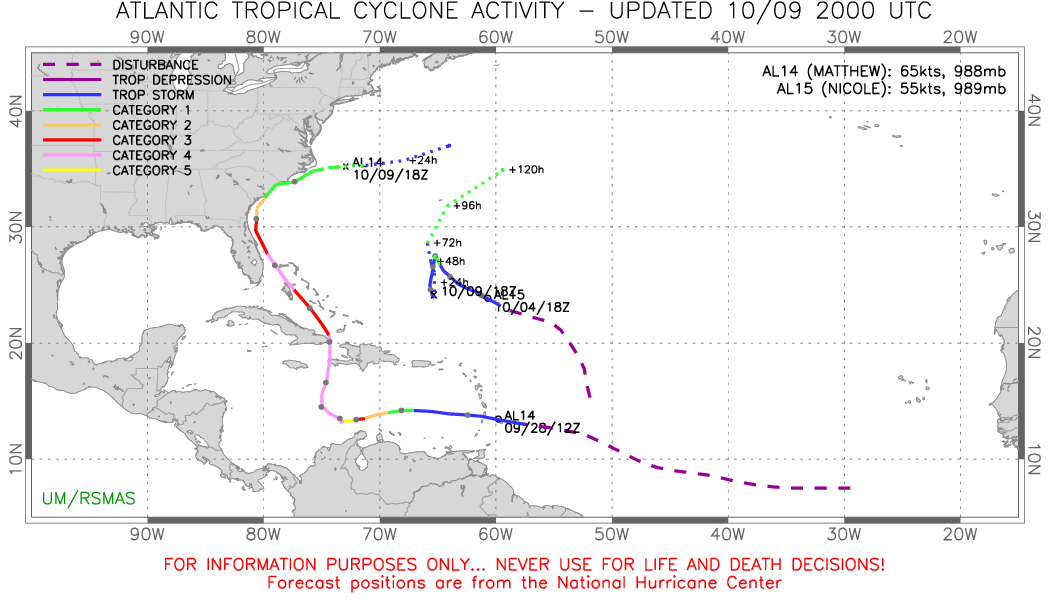
Hurricane Matthew Flooding, USA, Hispaniola and Cuba October 4-22, 2016
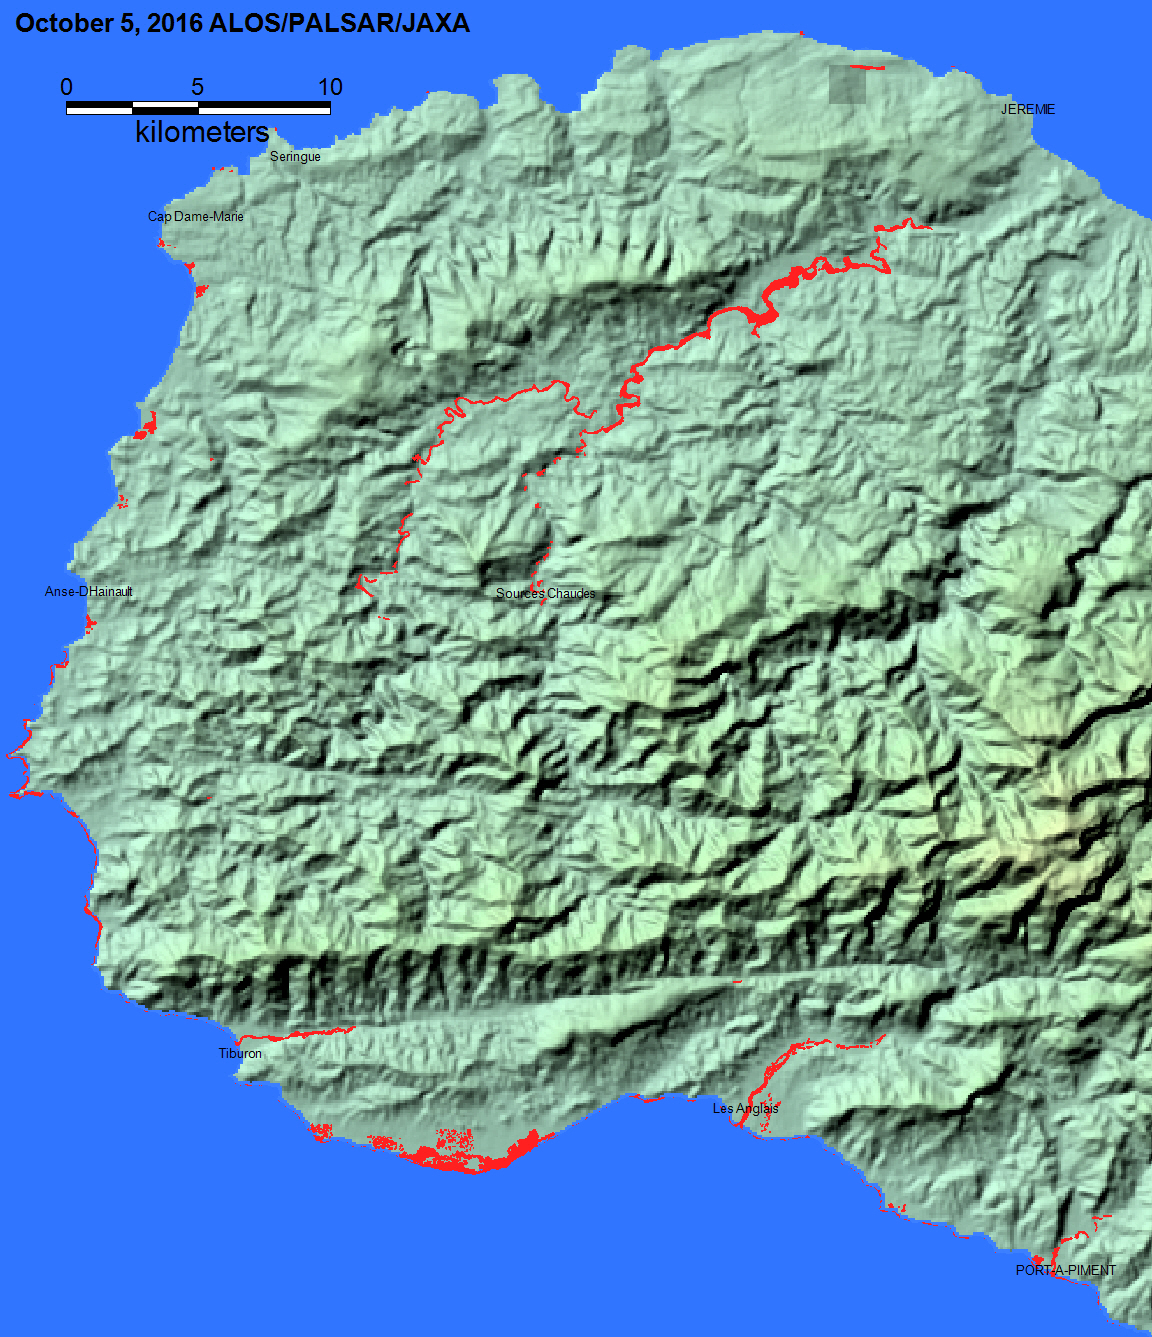
Flood Map (Grand' Anse SUD, Haiti)
Red is all surface water mapped from satellite sources. Dark blue is permanent surface water.
Geotif version
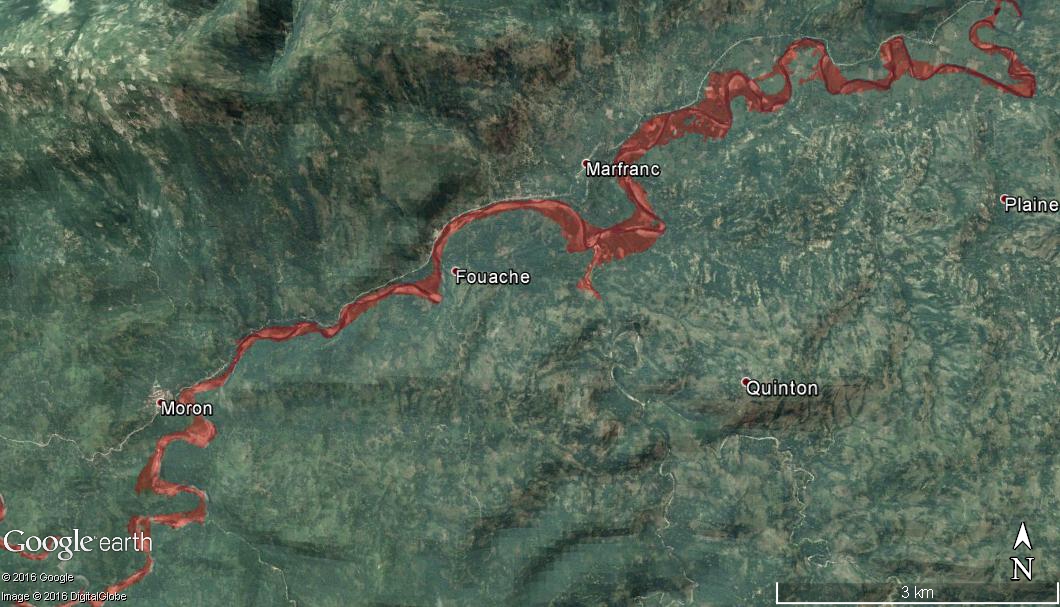
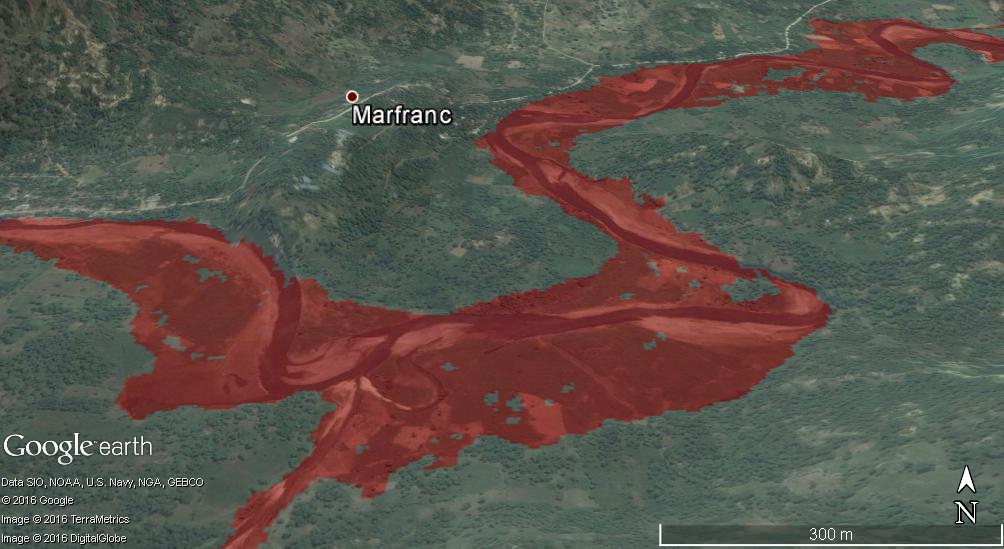
GoogleEarth kmz version
Samples of same data viewed in Google Earth
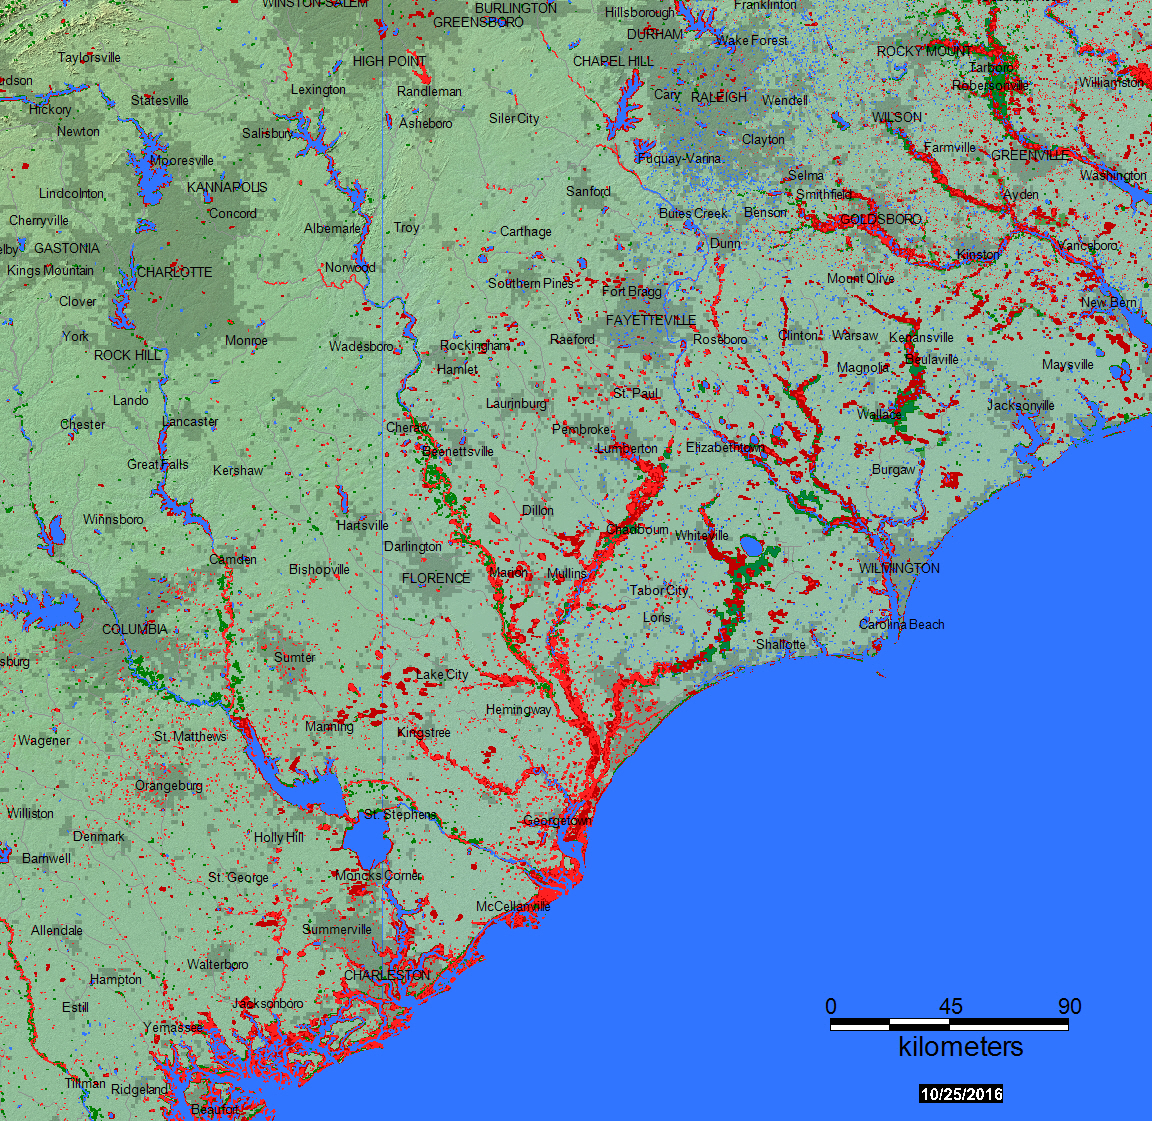
Flood Map (Southeastern U.S. Coast and Vicinity)
Red colors are flood water during past 14 days from MODIS 250 m and Landsat 8 data. Green is previous flooding, 2000-present. Dark blue is permanent surface water
Geotif version
Geotif version without historical flood layer (green layer)
Google Earth kmz version
 |
 |
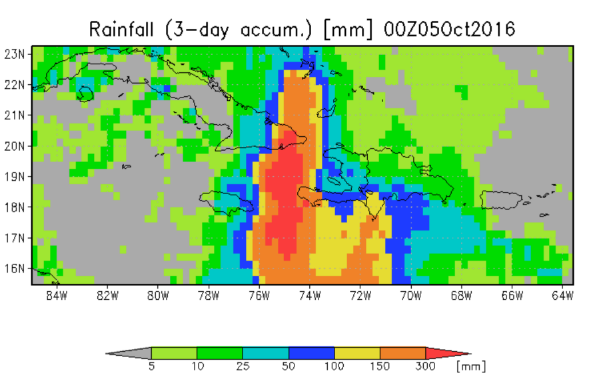
Forecast storm precipitation produced morning of October 3, 2016 for 0 hours UTC October 5. According to GEOS-5, rainfall of ~200 mm over southwest Haiti and >300 mm is predicted over eastern Cuba. Graphics provided by Dr. Robert Adler, University of Maryland/ESSIC |
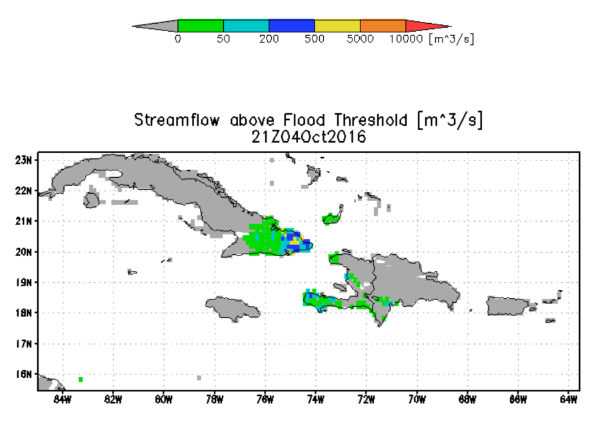
Forecast storm discharge, produced morning of October 3, 2016, for 21 hour UTC, October 4, from the NASA/University of Maryland Global Flood Monitoring System (GFMS). Graphics provided by Drs. Robert Adler and Huan Wu, University of Maryland/ESSIC |
 |
 |
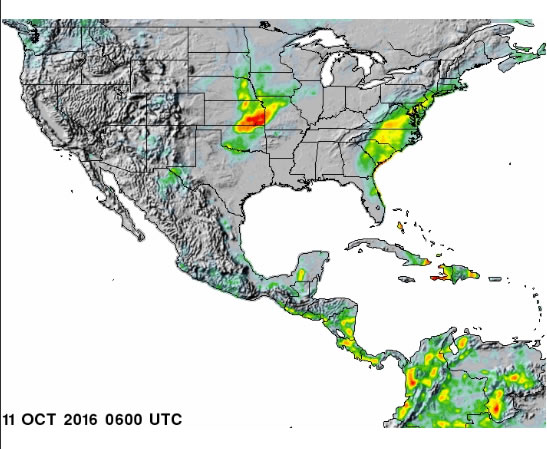
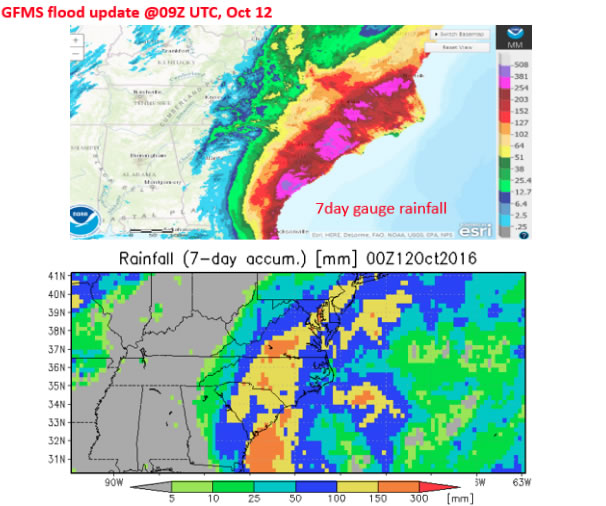
Satellite 7 day precipitation from NASA GSFC |
|
 |
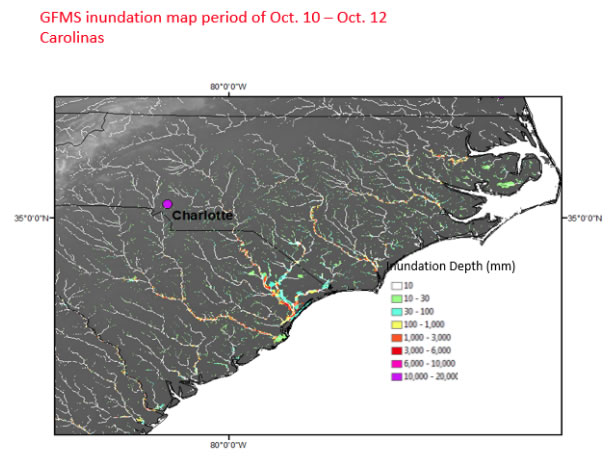 |
Courtesy of the NASA/University of Maryland Global Flood Monitoring System (GFMS). Graphics provided by Drs. Robert Adler and Huan Wu, University of Maryland/ESSIC |
Courtesy of the NASA/University of Maryland Global Flood Monitoring System (GFMS). Graphics provided by Drs. Robert Adler and Huan Wu, University of Maryland/ESSIC |
Explanation
Event Reporting:
The Flood Observatory maintains a Global Active Archive of large flood events, 1985 to present. It is available to the public in both spreadsheet and GIS formats (both formats together provide the complete Archive). New events are entered into this archive each week. As of the end of 2015, there were 4319 events; each has a unique archive number.
Event Mapping:
In some cases, severe or damaging floods become the focus of Observatory inundation mapping. As part of collaborations with other organizations, and the Global Flood Partnership, the Observatory's maps and other data are made available to the public. With attribution, they can be used freely, including for commercial purposes, under the terms of the Creative Commons Attribution 3.0 Unported License. Geotif versions and GIS files are also provided for these maps through the links below. This event is selected for Observatory production of map and GIS data products.This web page and associated image and map (GIS) files are the permanent Flood Observatory record of this event.
This Event:
This Flood List link provides a summary (USA). According to Flood List: "USA – Hurricane Matthew Leaves 11 Dead, Flooding in 4 States 9 OCTOBER, 2016 BY RICHARD DAVIES IN NEWS, USA · 0 COMMENT 57 Hurricane Matthew has flooded parts of Florida, Georgia, South Carolina and North Carolina over the last 3 days after bringing torrential rain and storm surges, as well as high winds. At least 11 people have died in the USA as a result of the storm. Governor Pat McCrory said that 3 people have died in North Carolina. Local officials in Georgia confirmed three deaths. At least five fatalities in Florida have been attributed to the storm. Matthew is the most powerful storm to make US landfall in more than a decade. The storm made landfall Saturday morning near McClellanville, South Carolina, as a Category 1 storm with sustained winds of 120 km/h."
This Flood List link provides a summary (Hispaniola).
According to Flood List: "According to figures issued by the government Haiti, a total of 336 people have been killed by the hurricane in seven departments from south-east to north-west, as of noon 08 October. However, there are fears this number will rise as further assessments are carried out. Some media outlets are already reporting more than 900 deaths. The government estimates that 2.1 million people have been affected by the hurricane. According to the UN, 1,410,907 people (over 12% of the country's population) are in need humanitarian assistance in Grand'Anse, South, Nippes, South East, West, Artibonite and North West departments. The country is now facing potential housing and food shortages, as well as an increase in cholera cases. As of 09 October, 61,537 people remained displaced, staying in 191 shelters. Humanitarian agencies say that initial assessments suggest that more than 200,000 houses have been damaged. European Civil Protection and Humanitarian Aid Operations (ECHO) says that as much as 80% of harvests were lost in some areas. Haiti's Ministry of Public Health and Population said that 70 cholera cases have been reported in the commune of Anse d'Hainault in the Grand'Anse over the last few days. Health officials said last week that they were concerned about an increase in cholera cases in the wake of the storm Wind and Flood Exposure A report by UNOSAT (PDF) of 07 October 2016 says that approximately 350,159 people were exposed to a high flood hazard, 426,380 to medium flood and 1,961,022 to low flood hazard."
Caution:
Floods in hilly or mountainous regions are difficult remote sensing targets and not always observable. Also, cloud cover or heavy vegetation may restrict the ability to capture peak inundation everywhere. The maps may not illustrate all areas of flooding, and cloud and terrain shadows may be misclassified and falsely mapped as flood water. Finally, due to the relatively coarse resolution of MODIS 250 m bands, some areas mapped as flooded may include smaller parcels of dry land and many small areas of flooding may not be detected and mapped.
Suggested citation:
Brakenridge, G.R., Kettner, A.J., Slayback, D., and Policelli, F., date accessed, "DFO Flood Event 4402", Dartmouth Flood Observatory, University of Colorado, Boulder, Colorado, USA, http://floodobservatory.colorado.edu/Events/2016USA4402/2016USA4402.html. Sang-Ho Yun (JPL), Guy Schumann (Remote Sensing Solutions), Bob Kuligowski (NOAA), Tomoaki ENDO (JAXA), Stu Frye (NASA) and many others have contributed materially to image acquisition and processing for these map displays.
Image Data Sources:
ALOS-2 PALSAR data were provided by JAXA via a distribution agreement with the CEOS Working Group on Disasters Flood Thematic Pilot.The Land Atmosphere Near-real-time Capability for EOS (LANCE) system provides daily NASA MODIS data at 250 m spatial resolution. Landsat 8 data are provided by the U.S. Geological Survey Hazards Data Distribution System. Landsat 8 is jointly managed by NASA and the United States Geological Survey. VIIRS data are processed to flood maps by a NOAA-supported project at George Mason University and are provided courtesy Dr. Sanmei Lei. COSMO-SkyMed synthetic aperture radar (SAR) dataare provided by the Italian Space Agency (ASI) as a contribution to the CEOS Flood Pilot. Sentinel SAR data, when used, are provided by the European Space Agency. NASA EO-1 satellite tasking and data are provided by Stuart Frye and colleagues at the NASA Goddard Space Flight Center. MODIS data beginning in year 2012 are based on an automated product provided by the MODIS NRT Flood project at the NASA Goddard Space Flight Center.
GIS Data Sources:
Non-automated, MODIS-based .shp or MapInfo GIS files supporting this Flood Event Map are located in a map sheet folder here together with any other high resolution (using Landsat 8, EO-1, etc) GIS files.
Click here for access to the automated daily MODIS-derived .shp file GIS record (record commences in 2011). Choose appropriate 10 deg x 10 deg map sheet directory and appropriate dates; longitude and latitudes refer to upper left map sheet corner.
Related Data:
Global Flood Monitoring System (GFMS) displays, if provided, are from the University of Maryland. Reference: Wu, H., R. F. Adler, Y. Tian, G. J. Huffman, H. Li, and J. Wang (2014), Real-time global flood estimation using satellite-based precipitation and a coupled land surface and routing model, Water Resour. Res., 50, doi:10.1002/2013WR014710. Global Flood Awareness System (GloFAS) displays, if provided, are from the European Commission Joint Research Centre and the European Centre for Medium-Range Weather Forecasts. Reference: Alfieri, L., Burek, P., Dutra, E., Krzeminski, B., Muraro, D., Thielen, J., and Pappenberger, F.: GloFAS – global ensemble streamflow forecasting and flood early warning, Hydrol. Earth Syst. Sci., 17, 1161-1175, doi:10.5194/hess-17-1161-2013, 2013.
Support provided by:
The Disasters Program of NASA Applied Sciences to the University of Colorado. GPM and AMSR-2 satellite microwave data for River Watch specially processed first within GDACS at the Joint Research Center of the European Commission. DFO participates in the Global Flood Partnership.
(counting since October 3, 2016)