


7-day accumulated rainfall from NASA Satellite Precipitation |
SSMI/SSMIS/AMSR2 Total Precipitable Water |
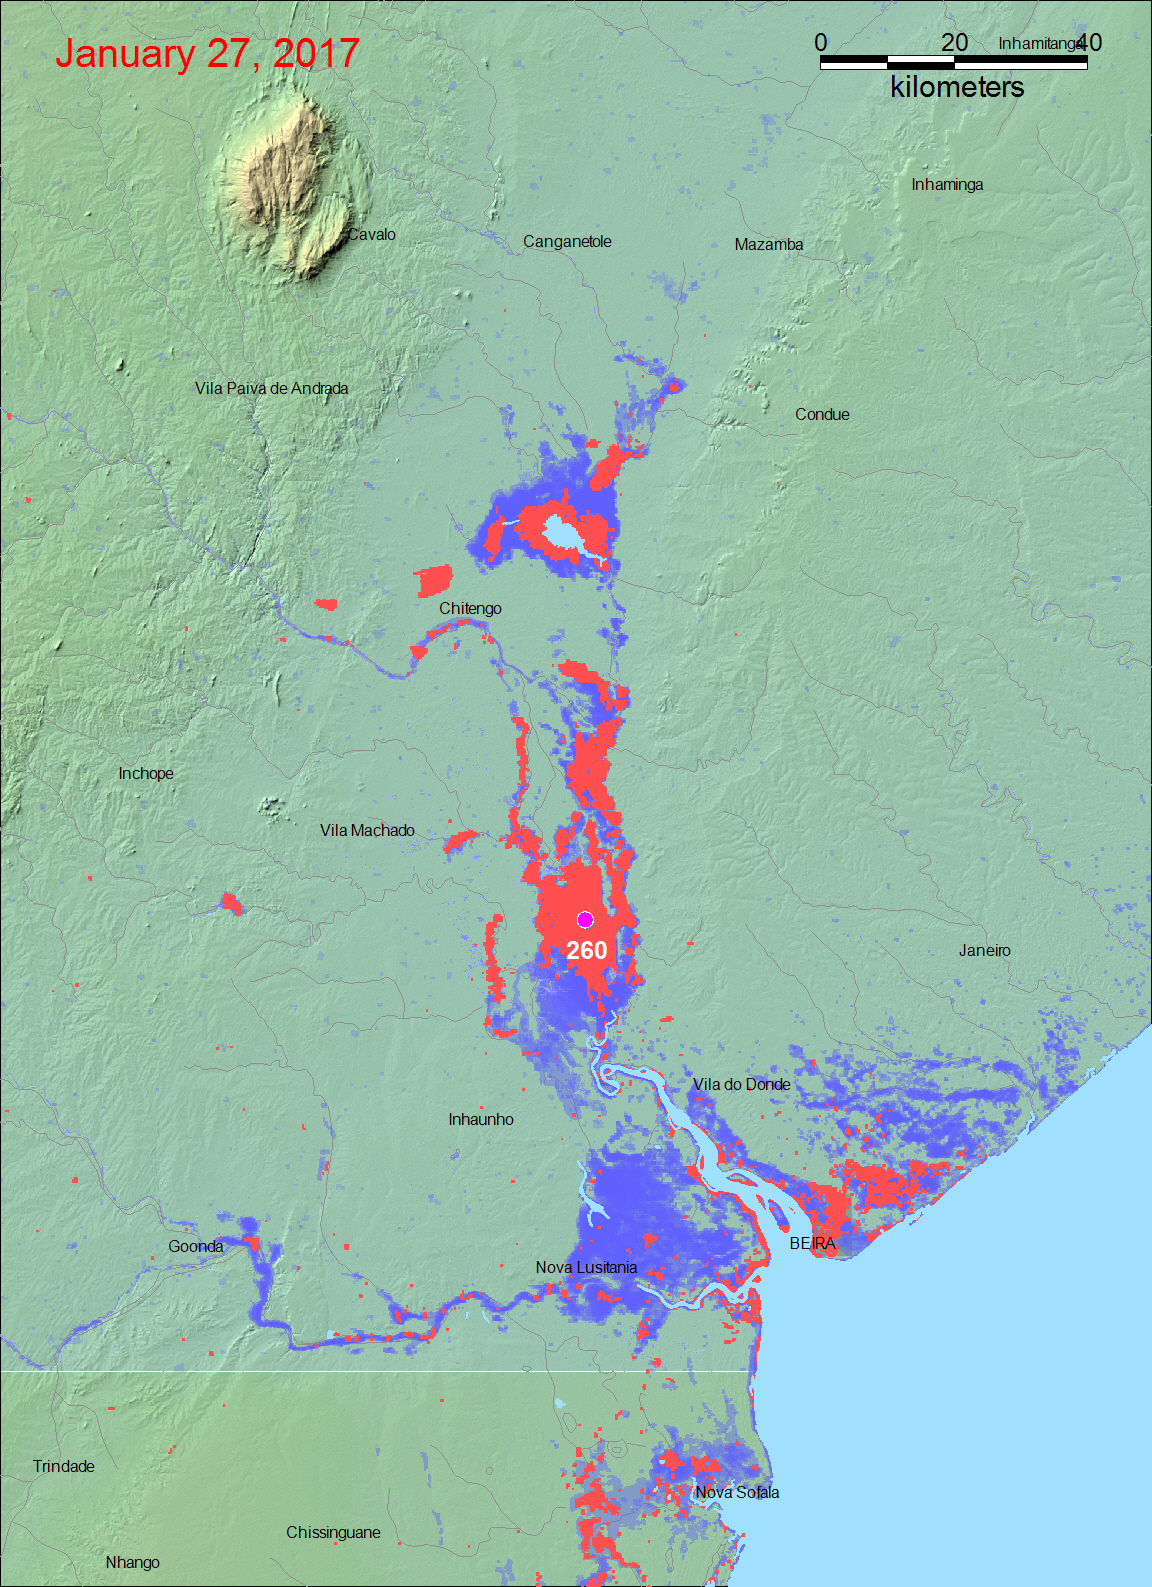
Flood depth above threshold, from GFMS. |
|---|
This Flood List link provides a summary. According to Flood List (January 20, 2017): "Torrential rains falling in central and southern Mozambique have resulted in flooding in Sofala province, leaving thousands cut off in the district of Dondo. According to analysis by UNITAR-UNOSAT (pdf), precipitation levels between 12 to 18 January reached over 650 mm. Around 5,000 people of Dondo district, Sofala province, are without road communication with the rest of Mozambique.Moving around the district is only possible by boats according to local media. Several rivers, including the Buzi River in southern Mozambique, have overflowed. A report by UNITAR-UNOSAT of 19 January says that approximately 600,000 people in Mozambique may have been exposed to over 500 mm of precipitation and 1,000,000 people may be exposed to 300-500 mm of precipitation between 12 and 18 January 2017. Parts of the provinces of Inhambane, Gaza, Manica and Sofala have seen the highest levels of rainfall."
At selected locations, a time series of satellite microwave-based daily river discharge measurements are available from the Flood Observatory. See River Watch Global Display for more information. A sample from Site 260 is shown below or click on the site location dot above.
NASA Landsat 8 and ESA Sentinel SAR data if used in this map were obtained from the the U.S. Geological Survey Hazards Data Distribution System. and the Sentinels Science Data hub, respectively. Landsat 8 is jointly managed by NASA and the United States Geological Survey. Flood modeling results if used are from the NASA/University of Maryland Global Flood Monitoring System (GFMS), Drs. Robert Adler and Huan Wu, University of Maryland/ESSIC.
GIS Data Sources:
GIS files supporting this Flood Event Map are located here.
Click here for access to the automated daily MODIS-derived .shp file GIS record (record commences in 2011). Choose appropriate 10 deg x 10 deg map sheet directory and appropriate dates; longitude and latitudes refer to upper left map sheet corner.
The Global Surface Water Explorer provides part of the (dark blue) annual surface water extent layer. It is based on Landsat data at a spatial resolution of ~ 30m (Jean-Francois Pekel, Andrew Cottam, Noel Gorelick, Alan S. Belward, High-resolution mapping of global surface water and its long-term changes. Nature 540, 418-422, 2016). On the map, it is shown together with the NASA Shuttle Water Boundary Data (SWBD) surface water extent (90 m resolution) processed from the 11-day February, 2000, SRTM mission. The SWBD information was corrected using Landsat data. Large flood events are not normally depicted in either data set. Thus, red areas on our maps show flood extent beyond these nomal annual limits
When used, NASA NRT Global Flood Mapping maximum water extent for the years 2013-2015, at 250 m spatial resolution, provide part of the (dark blue) maximum flood mapped. DFO creates these annual water extent layers from data provided by that project, by accumulating into one annual file all of the daily .shp files for each year. DFO has also produced abundant flood extent files through mapping of individual floods; these are also included where available in this maximum flood extent layer.
(counting since January 26, 2017)