Active Archive of Large Floods, 1985-Present
Master Index of Inundation Maps

Flood Event 2016-USA-4388
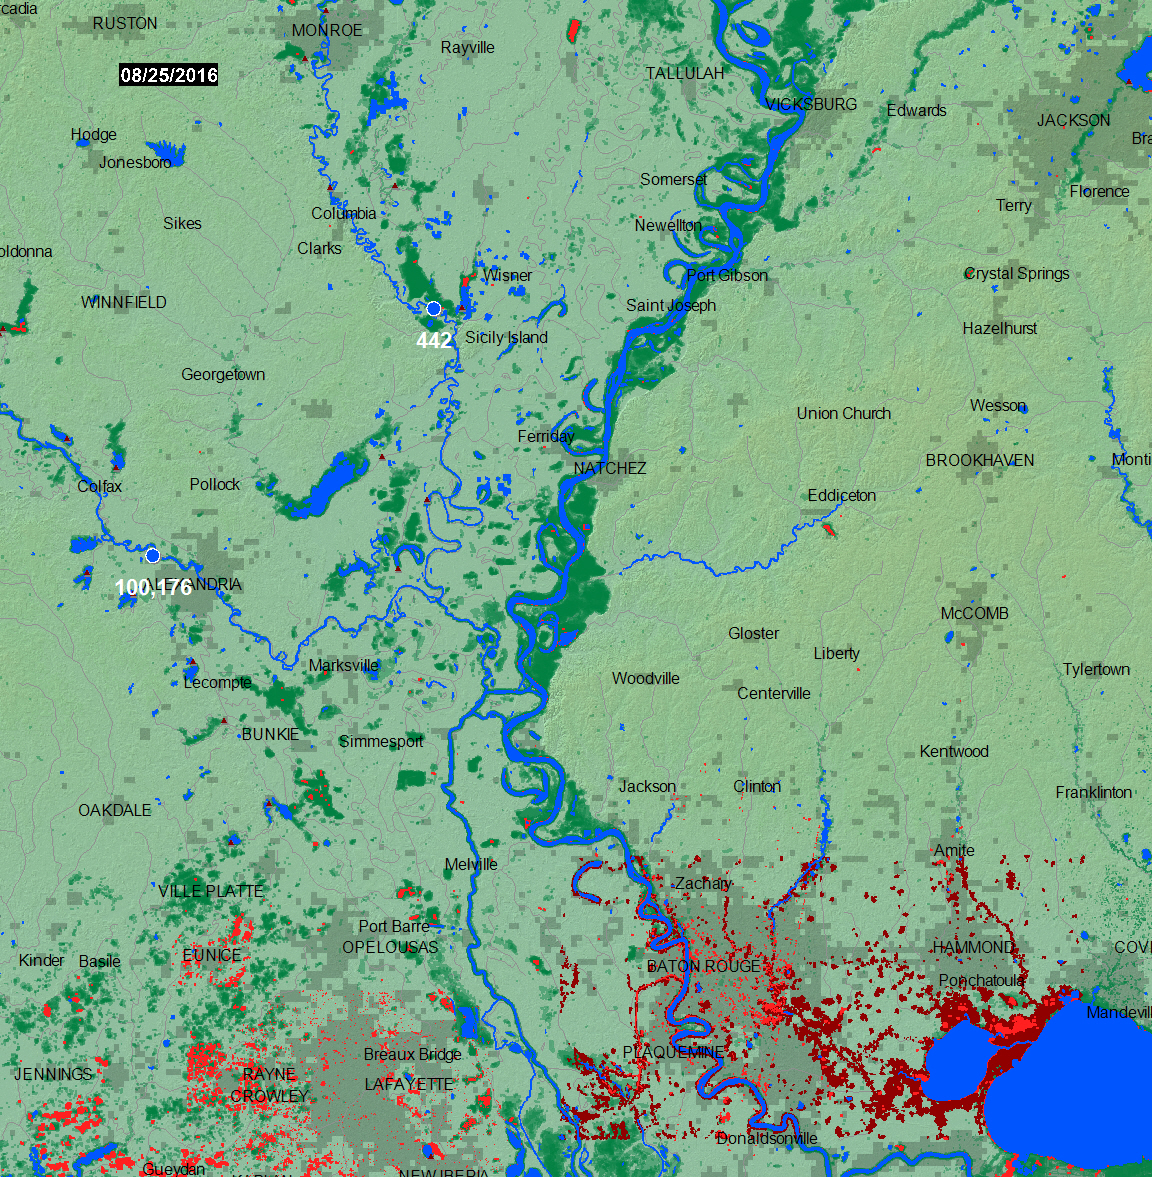
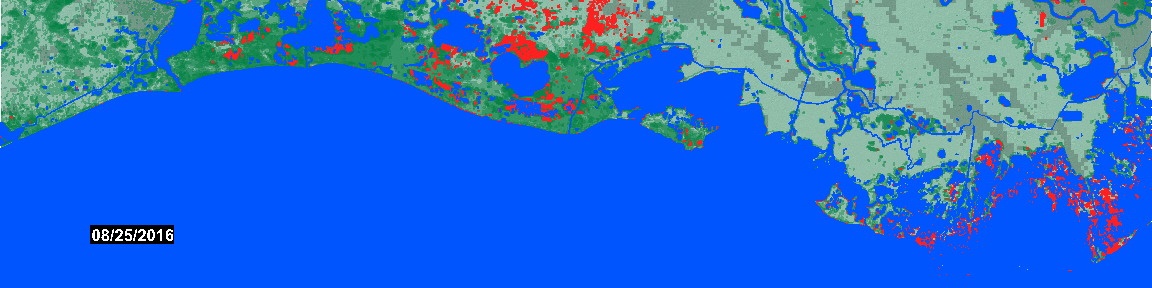
USA Flooding, August 1-August 16, 2016 from NASA MODIS (August 1-18), NASA/NOAA VIIRS (August 15-17), Radarsat 2 (August 15); EO-1 (August 16), and Copernicus (COSMO-SkyMed, August 15, 2016).
Red is flood water extending beyond the typical annual high water. Dark red are data provided by Sanmei Li at George Mason University (VIIRS data downscaled from 370 m to 30 m using topographic information). Dark blue is permanent water mapped in winter by NASA's SRTM mission. Green is all previously DFO-mapped flooding, 2000-present.
Flood Map Northwest
Flood Map Southwest
 |
|
|---|---|
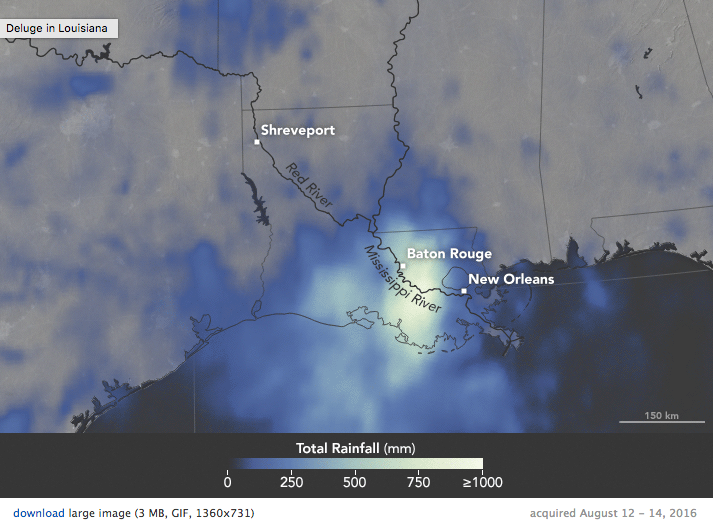
From: Integrated Multi-Satellite Retrievals for GPM (IMERG), a product of the Global Precipitation Measurement mission as shown on NASA's Earth Observatory |
Explanation
Event Reporting:
The Flood Observatory maintains a Global Active Archive of large flood events, 1985 to present. It is freely available to the public in both spreadsheet and GIS formats (both formats together provide the complete Archive). New events are entered into this archive each week. As of the end of 2015, there were 4319 events; each has a unique archive number and, starting in 2016, a unique name (example: "2016-Southern USA-4337").Event Mapping:
In some cases, severe or damaging floods become the focus of Observatory inundation mapping. As part of collaborations with other organizations, and the Global Flood Partnership, the Observatory's maps and other data are made available to the public. With appropriate attribution, they can be used freely, including for commercial purposes, under the terms of the Creative Commons Attribution 3.0 Unported License. Geotif versions and GIS files are also provided for these maps through the links below. This event is selected for Observatory production of map and GIS data products.This Event:
This Flood List link provides a summary. According to Flood List:"River levels in Louisiana have exceeded previous records in at least 8 different locations in southern areas of the state. Levels of the Amite River at Magnolia reached almost 7 feet (2.13 metres) higher than the previous record.The floods have left at least 5 people dead after a further 2 fatalities were reported yesterday. Two fatalities occurred in separate incidents in East Baton Rouge Parish, two in separate incidents in St. Helena Parish and one in Tangipahoa Parish.Approximately 20,000 people have been rescued from cars and homes so far, with rescue operation still ongoing. In a press conference yesterday, Governor Edwards said “we are still in the response phase”. Emergency rescue teams made up of police, firefighters, local disaster officials, state agencies, National Guard and volunteers have worked tirelessly to keep residents safe."Information From The Maps and River Watch Sites:
The maps show in red unusual flooding imaged by the automated MODIS NRT Flood processor at a spatial resolution of 250 m for the 14 days ending with the date on the map.Red also shows in some cases data from other sources fo rthe same time period. This web page and associated image and map (GIS) files are the permanent Flood Observatory record of this event.Caution:
Floods in hilly or mountainous regions are difficult remote sensing targets and not always observable. Also, cloud cover or heavy vegetation may restrict the ability to capture peak inundation everywhere. The maps may not illustrate all areas of flooding, and cloud and terrain shadows may be misclassified and falsely mapped as flood water. Finally, due to the relatively coarse resolution of MODIS 250 m bands, some areas mapped as flooded may include smaller parcels of dry land.Suggested citation:
Brakenridge, G.R., Kettner, A.J., Slayback, D. and Policelli, F., date accessed, "Flood Event 2016-USA-4388", Dartmouth Flood Observatory, University of Colorado, Boulder, Colorado, USA, http://floodobservatory.colorado.edu/Events/2016USA4388/2016USA4388.htmlMapping Data Sources:
The Land Atmosphere Near-real-time Capability for EOS(LANCE) system provides daily NASA MODIS data at 250 m spatial resolution. Landsat 8 data, if used, are provided by the U.S. Geological Survey Hazards Data Distribution System. Landsat 8 is jointly managed by NASA and the United States Geological Survey. COSMO-SkyMed synthetic aperture radar (SAR) data are occasionally provided by the Italian Space Agency (ASI) as a contribution to the CEOS Flood Pilot. Sentinel SAR data, when used, are provided by the European Space Agency. NASA EO-1 satellite tasking and data are provided by Stuart Frye and colleagues at the NASA Goddard Space Flight Center. MODIS data beginning in year 2012 are based on an automated product provided by the MODIS NRT Flood project at the NASA Goddard Space Flight Center. Non-automated, MODIS-based or VIIRS-based GIS files supporting this Flood Event Map are located in a map sheet folder here together with any other high resolution (using Landsat 8, EO-1, etc) GIS files and including. Third party (non-Flood Observatory) information that is believed to be available for public use.Click here for access to the automated daily .shp file GIS record (record commences in 2011). Choose appropriate 10 deg x 10 deg map sheet directory and appropriate dates; longitude and latitudes refer to upper left map sheet corner.Related Data:
Global Flood Monitoring System (GFMS) displays, if provided, are from the University of Maryland. Reference: Wu, H., R. F. Adler, Y. Tian, G. J. Huffman, H. Li, and J. Wang (2014), Real-time global flood estimation using satellite-based precipitation and a coupled land surface and routing model, Water Resour. Res., 50, doi:10.1002/2013WR014710. Global Flood Awareness System (GloFAS) displays, if provided, are from the European Commission Joint Research Centre and the European Centre for Medium-Range Weather Forecasts. Reference: Alfieri, L., Burek, P., Dutra, E., Krzeminski, B., Muraro, D., Thielen, J., and Pappenberger, F.: GloFAS – global ensemble streamflow forecasting and flood early warning, Hydrol. Earth Syst. Sci., 17, 1161-1175, doi:10.5194/hess-17-1161-2013, 2013.Support provided by:
The Disasters Program of NASA Applied Sciences to the University of Colorado. GPM and AMSR-2 satellite microwave data for River Watch specially processed first within GDACS at the Joint Research Center of the European Commission. DFO participates in the Global Flood Partnership.
![]()

(counting since August 15, 2016)

This web site and associated data by G. Robert Brakenridge and Albert J. Kettner are licensed under a Creative Commons Attribution 3.0 Unported License.
This work is made possible by data acquired by NASA, the Japanese Space Agency, and the European Space Agency, and funding support from NASA and the European Commission, through the Global Disaster Alert and Coordination System (GDACS) project, Joint Research Centre, Ispra, Italy. The Observatory was founded in 1993 at Dartmouth College, Hanover, NH USA and moved to the University of Colorado, INSTAAR, CSDMS in 2010. The institutional support of both universities is gratefully acknowledged.
http://floodobservatory.colorado.edu/Flood Observatory