Active Archive of Large Floods, 1985-Present
Master Index of Inundation Maps
Satellite River Discharge Measurements

This page under construction, June 1, 2015.
DFO began its work in 1993 using ESA ERS-1 SAT data to map the Great Flood of the Upper Mississippi Valley, USA. We have employed a variety of sensors since then to map floods. See Rapid Response Inundation Maps for many of the results. Some results are also shown below.
Example: late 2011 Thailand flooding
2011 Thailand Powerpoint Time Series
Recent Flood Mapping
2014 Paraguay and Brazil, Event #4150 (North)
2014 Paraguay and Brazil, Event #4150 (South)
2014 Amazonas, Brazil, Event #4159
2014 Bihar, India, Event #4174
2014 Ethiopia and Somalia, Event #4201
Experimental or Under Construction Displays (updated daily)
Freshwater Discharge Into The Arctic Ocean
Latin American Current Surface Water at GeoSUR
Southern Africa Flood Detection
Southern Europe and Northern Africa Flood Detection
Ethiopia Surface Water Monitoring
Mozambique Surface Water Monitoring
Ganges-Brahmaputra Surface Water Monitoring
Indus Basin Surface Water Monitoring
Dynamic Surface Water Maps (floods, droughts, lakes and reservoirs, and the coastal zone)
See also other projects and data products
Some Other Sample Results and Services
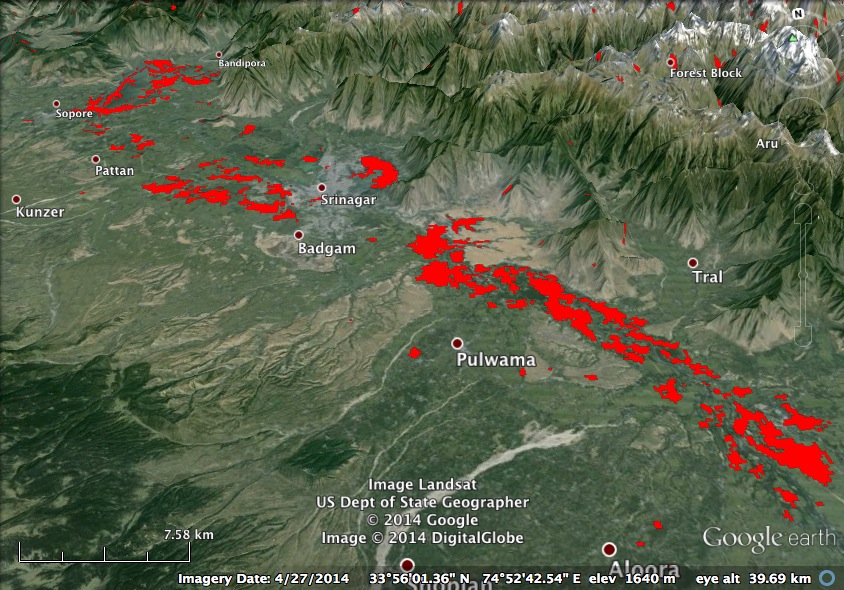
Damaging flooding in the Pakistani Punjab, sample view, September 8, 2014. See also Flood Event display.
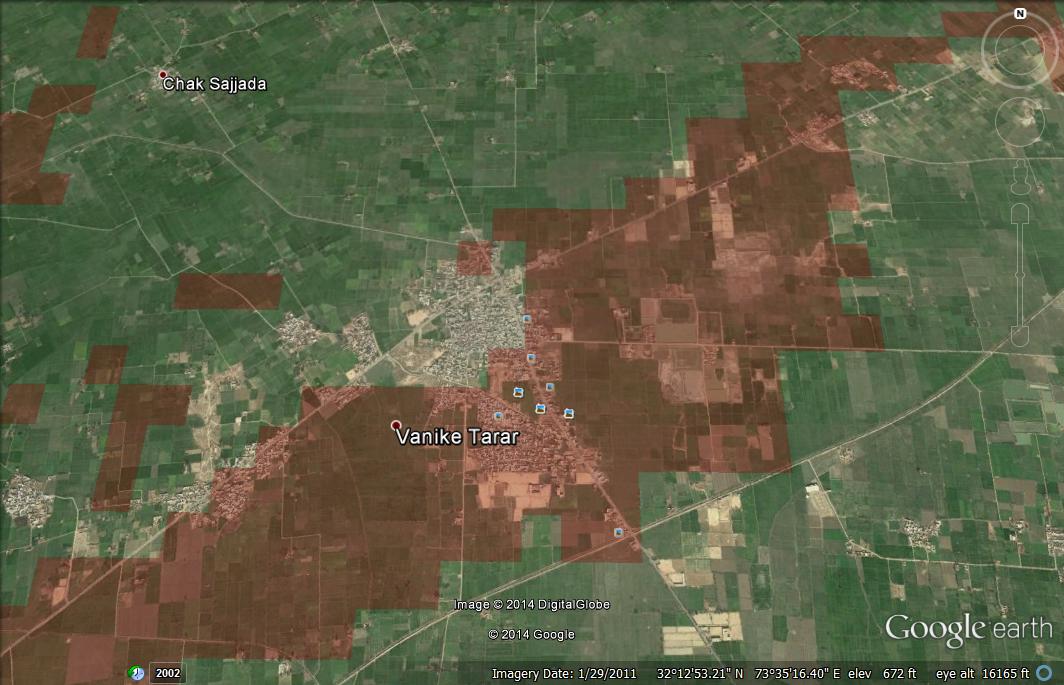
Damaging flooding in the Sindh, Pakistan, sample view, September 21, 2014. See also Flood Event display.
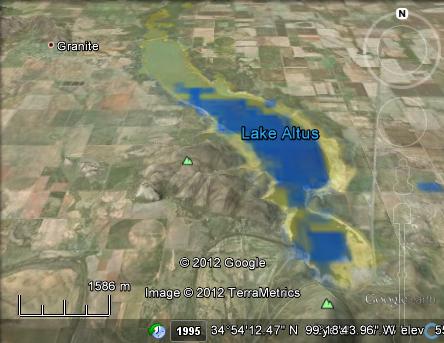
Sample of drought (reduced surface water) mapping in the Central USA, Summer, 2012 using NASA MODIS data.. Yellow shows new dry land. See appropriate sheets of the Surface Water Record when droughts are underway. As well, the runoff displays above may be used to look for areas of surface water anomalies. In 2014, we will be moving increasingly to Google Earth and Google Maps platforms.
This work is made possible by data acquired by NASA, the Japanese Space Agency, and the European Space Agency, and funding support from NASA and the European Commission, through the Global Disaster Alert and Coordination System (GDACS) project, Joint Research Centre, Ispra, Italy. The Observatory was founded in 1993 at Dartmouth College, Hanover, NH USA and moved to the University of Colorado, INSTAAR, CSDMS in 2010. The institutional support of both universities is gratefully acknowledged.
http://floodobservatory.colorado.edu/Flood Observatory