

MODIS Near Real Time Surface Water at GeoSUR
In 2014, the Flood Observatory is facilitating transfer and display of the MODIS NRT surface water information into the GeoSUR Regional Map Server. Work is underway to finalize display characteristics. However, the near real time feed is presently operational, and may be accessed using this link:
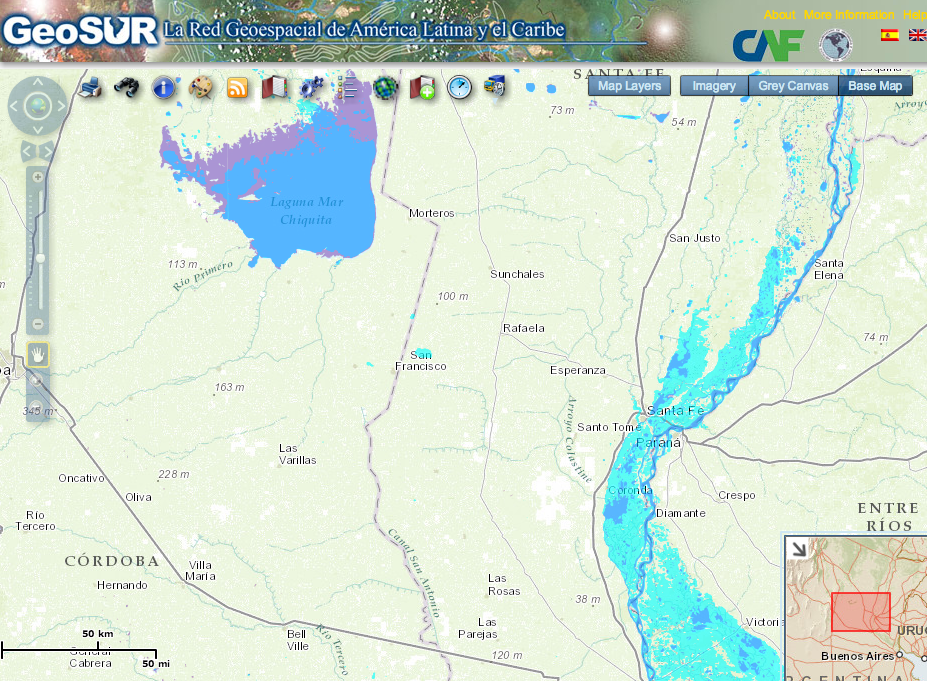
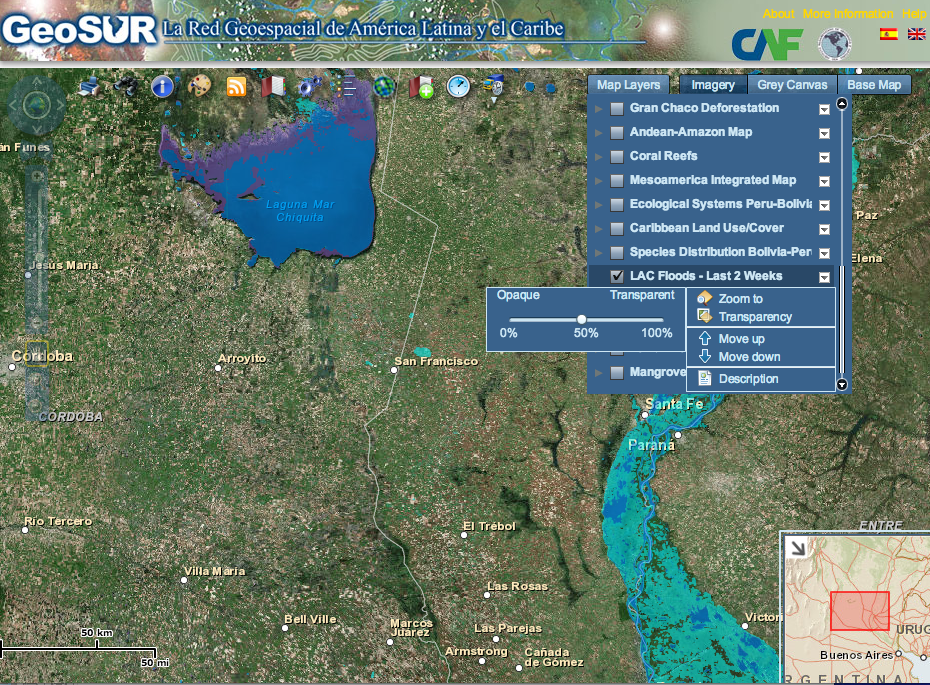
After traveling to this link, 1) add the "LAC Floods-Last Two Weeks" map layer. 2) Zoom in (necessary for refresh in seconds rather than minutes of time). 3) Set transparency, if desired: values of ~40% work well. 4) Choose either base map (first example, below) or imagery (second example below) for the base map information.
In examples below, bright blue is flooding. Blue is permanent surface water, as derived from the NASA SWBD data set. Purple illustrates areas of surface water contraction, compared to the SWBD information, which dates from February, 2000. Making the LAC Floods layer more transparent also allows you to compare current surface water with the Google Maps information.
Acknowledgements
Funding support is being provided from the Latin American Development Bank (CAF, Mr. Eric Van Praag) and the NASA Earth Science Applications Program (Dr. Francis Lindsay, NASA).