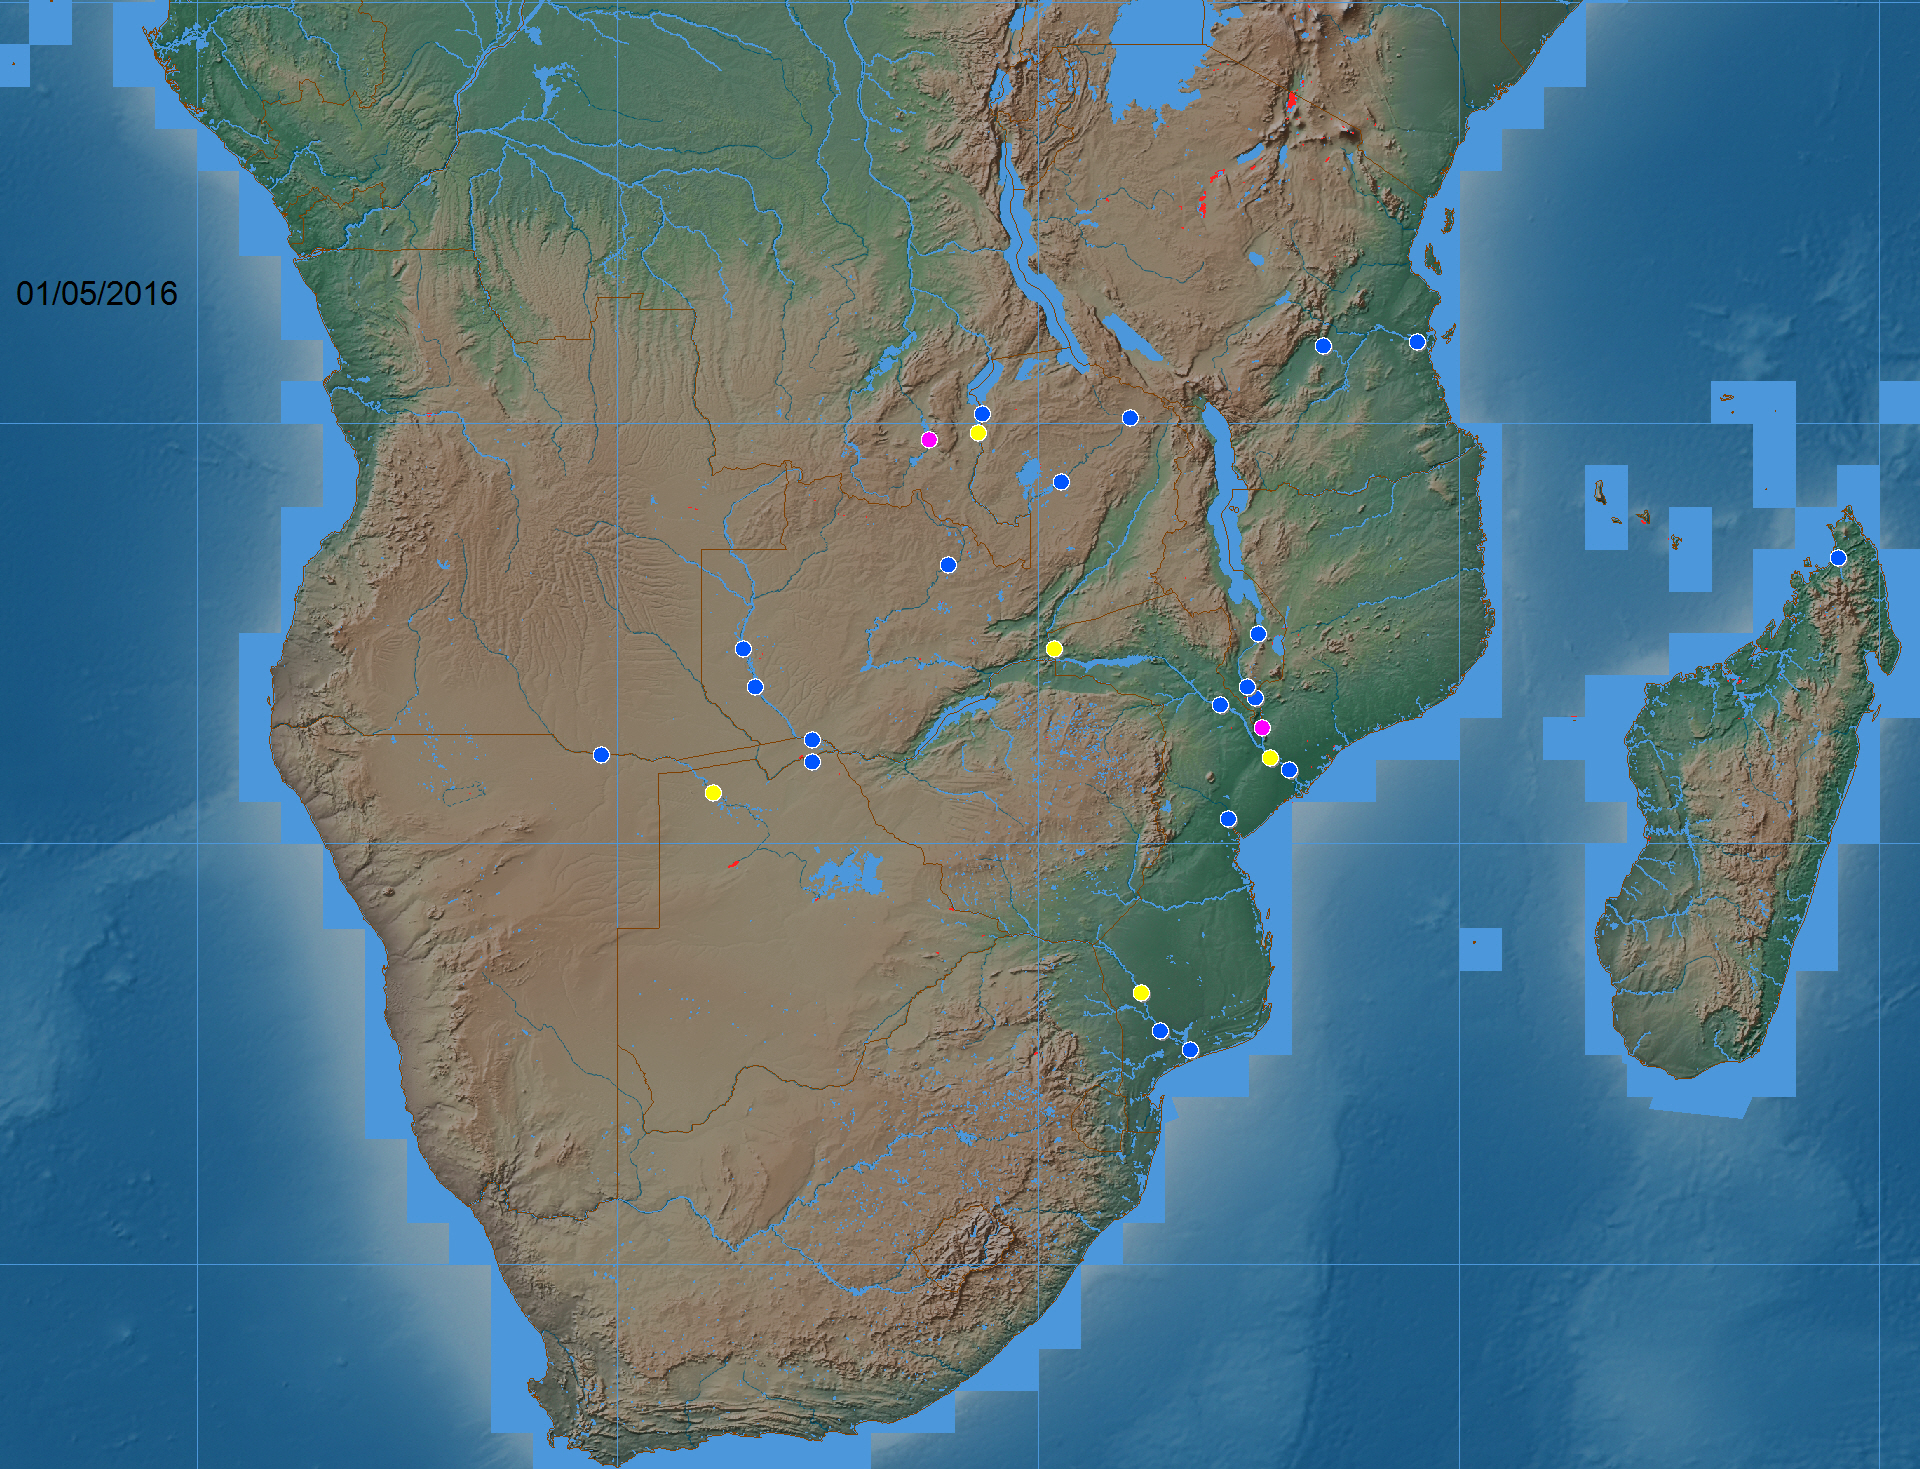


River Watch/MODIS Near Real Time Regional Display for Southern Africa
Updated Daily at 10:30 MST
River Watch (satellite microwave-based discharge monitoring): Yellow dots: low flow (<5th percentile mean daily runoff for this date, 1998-2012); Blue dots: normal flow; Purple dots: moderate flooding (>1.33 yr recurrence); Red, major flooding (> 5 yr recurrence). Period of record for non-high latitude sites begins January 1, 1998. The Log Pearson III distribution is used for recurrence interval calculation, 1998-2012.
Red map areas: Flooding, as observed using the NASA GSFC/DFO MODIS NRT Product, 14 day forward running accumulated water. The SWBD February, 2000 water (blue) is used to mask the MODIS data (red areas were not mapped as water in February 2000). Terrain and cloud shadow produce areas of noise (red, but not flood water).
See also the Global River Watch Display. Also, click in lower right (SE) corner area of each 10 deg tile for access to large scale maps.
