

Instrumental streamflow records indicate a 9.8% increased discharge (1977-2007) for 19 large Arctic rivers in Canada and Eurasia [Overeem and Syvitski, 2010]. There is also a shift of maximum discharge to earlier in the summer, most likely due to earlier snowmelt. The rate of increase accelerates in the latter part of these records. The present NASA-supported project (NNX13AC38G) is designed to test and expand upon these recent findings by utilizing ongoing NASA- and JAXA-remote sensing (microwave radiometry) to monitor river discharge changes [Brakenridge et al., 2007; Brakenridge et al., 2012], including along presently un-gauged Arctic Rivers. Three science questions are addressed: 1) changes in the timing of spring river ice break-up in relation to changing temperature regimes, 2) changes in total annual freshwater discharge into the ocean, and 3) the causes and predictability of the runoff/discharge changes.
We have also joined the NASA NEWS "Climate Break at 1998" team study project. Whereas the Earth warmed steadily at a rate of 0.13° C per decade since 1950, since 1998 many records show that global warming has slowed or paused: even though atmospheric carbon dioxide has continued a steady rise. This is possibly due to La-Niña-like cooling in the equatorial Pacific, accompanied by intensified Walker circulation, winter cooling in northwestern North America, and prolonged drought in the southern USA [Kosaka and Xie, 2013]. Other cause- and effect- mechanisms have also been proposed. With the data presented here, we can also examine whether such climate changes have affected Arctic river discharge.
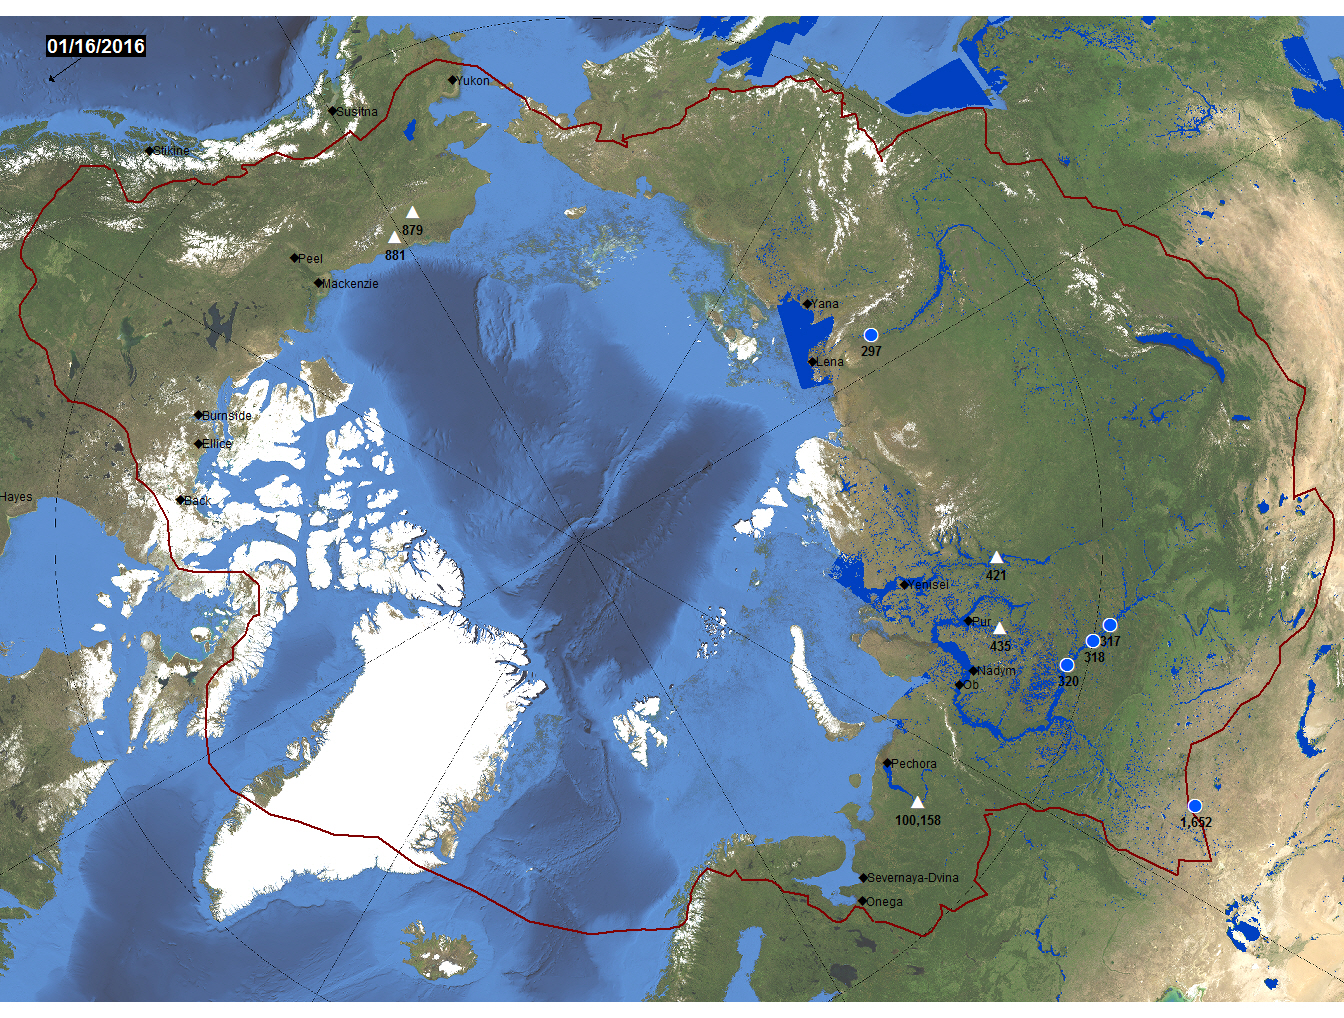
Once calibrated to discharge values and ice response thresholds, passive microwave radiometry via the AMSR-E and AMSR-2 and other satellite sensors fcan be used over specific river measurement sites to measure time of spring ice breakup, duration of thaw season flow, and total seasonal discharge after ice breakup. The existing records extend from mid-2002 to October 4, 2011, when AMSR-E failed. AMSR-2 began providing data in 2013 and continues today. These data are here supplemented with ground-based gauging records and application of the WBM runoff model for this region. Figure 1 provides an overview of the watershed contributing into the Arctic Ocean, and access to discharge data being analyzed.
Figure 1. Overview Map of Arctic Ocean Watershed floodplains, and current status of river discharge at selected satellite measurement sites. White triangles: Ice covered or no discharge; Yellow dots: low flow (<75% mean runoff for the week ending on this date, 2003-2011); Blue dots: normal flow; Purple dots: moderate flooding (>1.33 yr recurrence); Red, major flooding (> 5 yr recurrence). Period of record for non-high latitude sites begins January 1, 1998; for high latitude sites July 1, 2002. The Log Pearson III distribution is used for recurrence interval calculation. Black diamonds show ground hydrometric stations. Dark blue floodplains show surface water imaged by NASA's two MODIS sensors and mapped by G.R. Brakenridge at the Dartmouth Flood Observatory.
Click on symbols to retrieve plots and data
Funding support from the NASA Hydrology Program, Dr. Jared Entin, Program Manager, is gratefully acknowledged.
Overeem, I. and Syvitski, J.P.M., 2010: Shifting discharge peaks in Arctic rivers, 1977–2007. Geogr. Ann., 92 A (2): 285–296.