River Watch Near Real Time Stream Flow Status Display for North Asia
Updated Daily at 10:30 MST
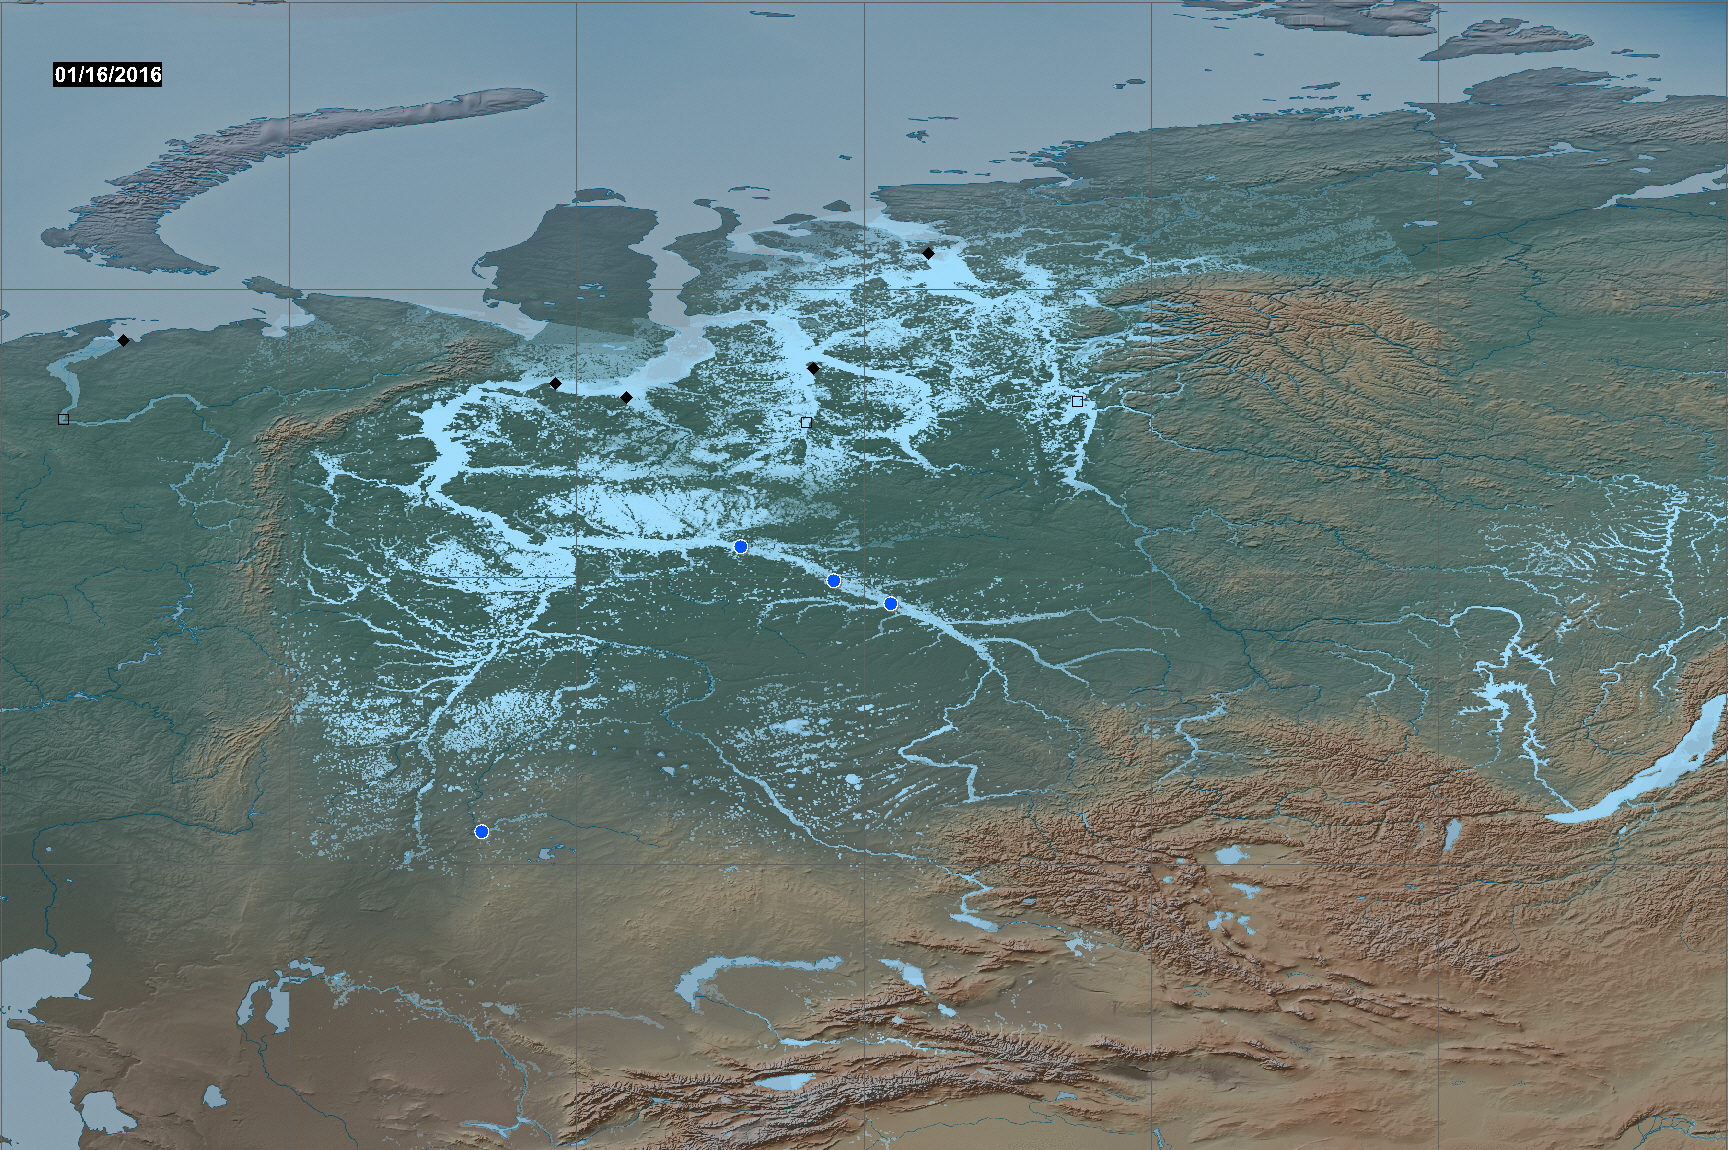
River Watch (satellite microwave-based discharge monitoring): White Dots: Ice covered or no discharge; Yellow dots: low flow (<75% mean runoff for the week ending on this date, 2003-2011); Blue dots: normal flow; Purple dots: moderate flooding (>1.33 yr recurrence); Red, major flooding (> 5 yr recurrence). Period of record for non-high latitude sites begins January 1, 1998; for high latitude sites July 1, 2002. The Log Pearson III distribution is used for recurrence interval calculation. Black diamonds show ground hydrometric stations. Click on symbols to retrieve plots and data.
Light blue floodplain map areas: Flooding during the MODIS period of record, 2000 to present.
See also the Global River Watch Display.