Four map products are available:
The Observatory uses an automatically generated 14 day accumulation of the MODIS NRT daily water to show current conditions. The date on the maps refer to all flooding imaged on that date and 13 days prior. This provides nearly complete geographic coverage under conditions of intermittent heavy cloud cover. Thus, "current conditions" refers to the past two weeks, and the maps may not show flooding until cloud cover permits.
The GIS (.shp and Mapinfo) files used to generate these maps are also available: 1) locate the 10 deg x 10 deg map sheet(s) which include this flood event ("070E040N" spans 70-80E and 40-30N). 2) The daily-updated 14-day MODIS accumulation .shp file set, named "current", can be downloaded from the MODISlance_2wkpro directory. 3) When the daily MODIS files are incorporated, they reside here. 4) This link provides access to the DFO long term record of previous flood events. 5) A flood event folder may also be available and include other GIS data, such as from Landsat or radar satellites, as well as copies of relevant GIS data from the folders described above.
The automated product: This map may incorporate 250 m spatial resolution MODIS Rapid Response Subset data: provided by NASA's LANCE System. It most commonly incorporates data from from an automated MODIS flood processor using LANCE reflectance data. See appropriate Surface Water Record display for more information and technical description.
On a selected basis, one-day classification is turned on in the automated processor: see appropriate map sheets and data links at the automated MODIS flood processor.
Manual Flood Mapping from MODIS: When the automated processor is not detecting water due to sustained cloud cover, individual MODIS scenes and operator-assisted mapping can provide better results. This is because the automated processor relies on a filter using 3-day/6-image data sets to remove moving cloud shadow noise. The following method of manual water/land classification and map production from the Rapid Response subset data is effective: a) The subset geotiff data, bands 721 composites, are used. b) A band math/ratio and threshold approach is applied within Envi™ as follows: 1) Band math: "(float(b2) gt 200 ) or (((float(b1)+1)/(float(b2)+80)) gt .7) or float(b3) gt 17", where b2 = band 1; b3 = band 2; b1 = band 3 of the three channel RGB (bands 1,2,3) geotiff files. 3) This produces a binary geotif file with 0, black, as water, and 1, white, as land. 4) To remove cloud shadows ,if necessary, two images closely spaced in time (within one day) are processed, the classification results added, and the results added. Water must retain values of 0. 5) A GIS polygon (.shp format) is then fit around the water pixels within Envi™.
Method of Landsat water/land classification and map production: 1) Landsat bands 3 (green), 0.53-0.59; 5 (near infrared), 085.-0.88; and 6, (short-wave infrared), 1.57-1.65, of the Operational Land Imager (OLI) sensor are used to produce a color composite for quality control purposes. 2) The following processing steps are performed to produce classified water pixels: a) Using Envi™, an NDVI-like product is produced: band 3-band 5/band 3 + band 5. b) Water pixels are identified via a threshold: "water" = < -.04 of this ratio result, c) GIS (.shp files) are then produced within Envi™ and outline the preliminary water areas. d). Within GIS software, the polygons are displayed over the tif image, and evident cloud shadow-sourced and other error polygons are manually deleted. This method is designed for rapid, operator-assisted transformation of Landsat image data into water map information. The band 3/ band 5 information when processed in this way avoids most cloud shadow (false positives) and provides sensitive water/land discrimination.
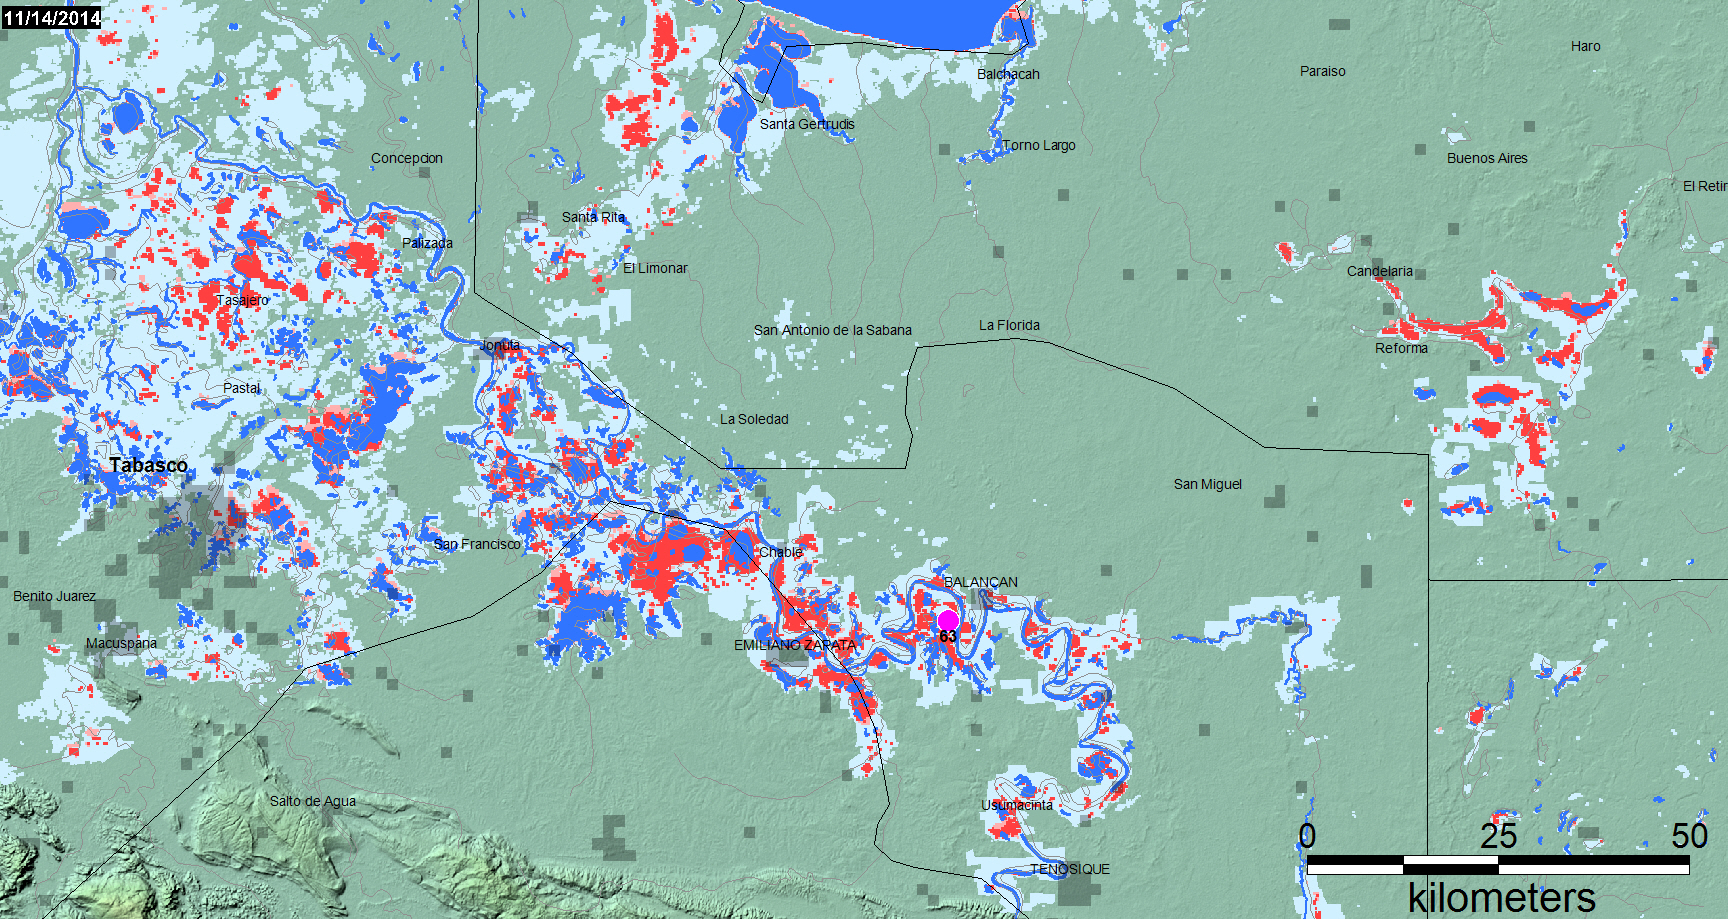
At selected locations, a time series of satellite microwave-based daily river discharge measurements are available. These define the estimated recurrence interval of mapped flooding. Click on the colored dots in the online Current Conditions display. Yellow dots: low flow (<50 % mean daily runoff for this date); Blue dots: normal flow; Purple dots: moderate flooding (>1.33 yr recurrence); Red, major flooding (> 5 yr recurrence). See River Watch Global Display for more information.
The River Watch output (representative displays below, for site #63) indicates the severity of the flood in terms of recurrence intervals and based on the period of record.


Brakenridge, G.R., Slayback, D., Kettner, A.J., Policelli, F., De Groeve, T., and Cohen, S., 2014, Current Conditions and Maximum Flood Extent, 2014 Flooding, Tobasco, Chiapas, and Campeche, Mexico, DFO Event 4203, http://floodobservatory.colorado.edu/Version3/2014Mexico4203.html.
Maps and associated data generated at DFO are available for public use and licensed under a Creative Commons Attribution 3.0 Unported License. Work is supported by the NASA Applications Program (point of contact: Dr. Francis Lindsay). We acknowledge the Land Atmosphere Near-real time Capability for EOS (LANCE) system operated by NASA/GSFC, and the NASA funding support to the MODIS NRT flood processor at the Goddard Space Flight Center. Landsat 8 data are provided by the U.S. Geological Survey Hazards Data Distribution System. Landsat 8 is jointly managed by NASA and the United States Geological Survey.
Red: Flooding within past 14 days. Light Red: Flooded during this event, now dry. Dark blue, Permanent water, February, 2000 (SWBD*). Very light blue, All flooding mapped by DFO since yr 2000.
*The Shuttle Water Boundary Data are at 90 m spatial resolution and provide a useful reference water.