Standard Description:
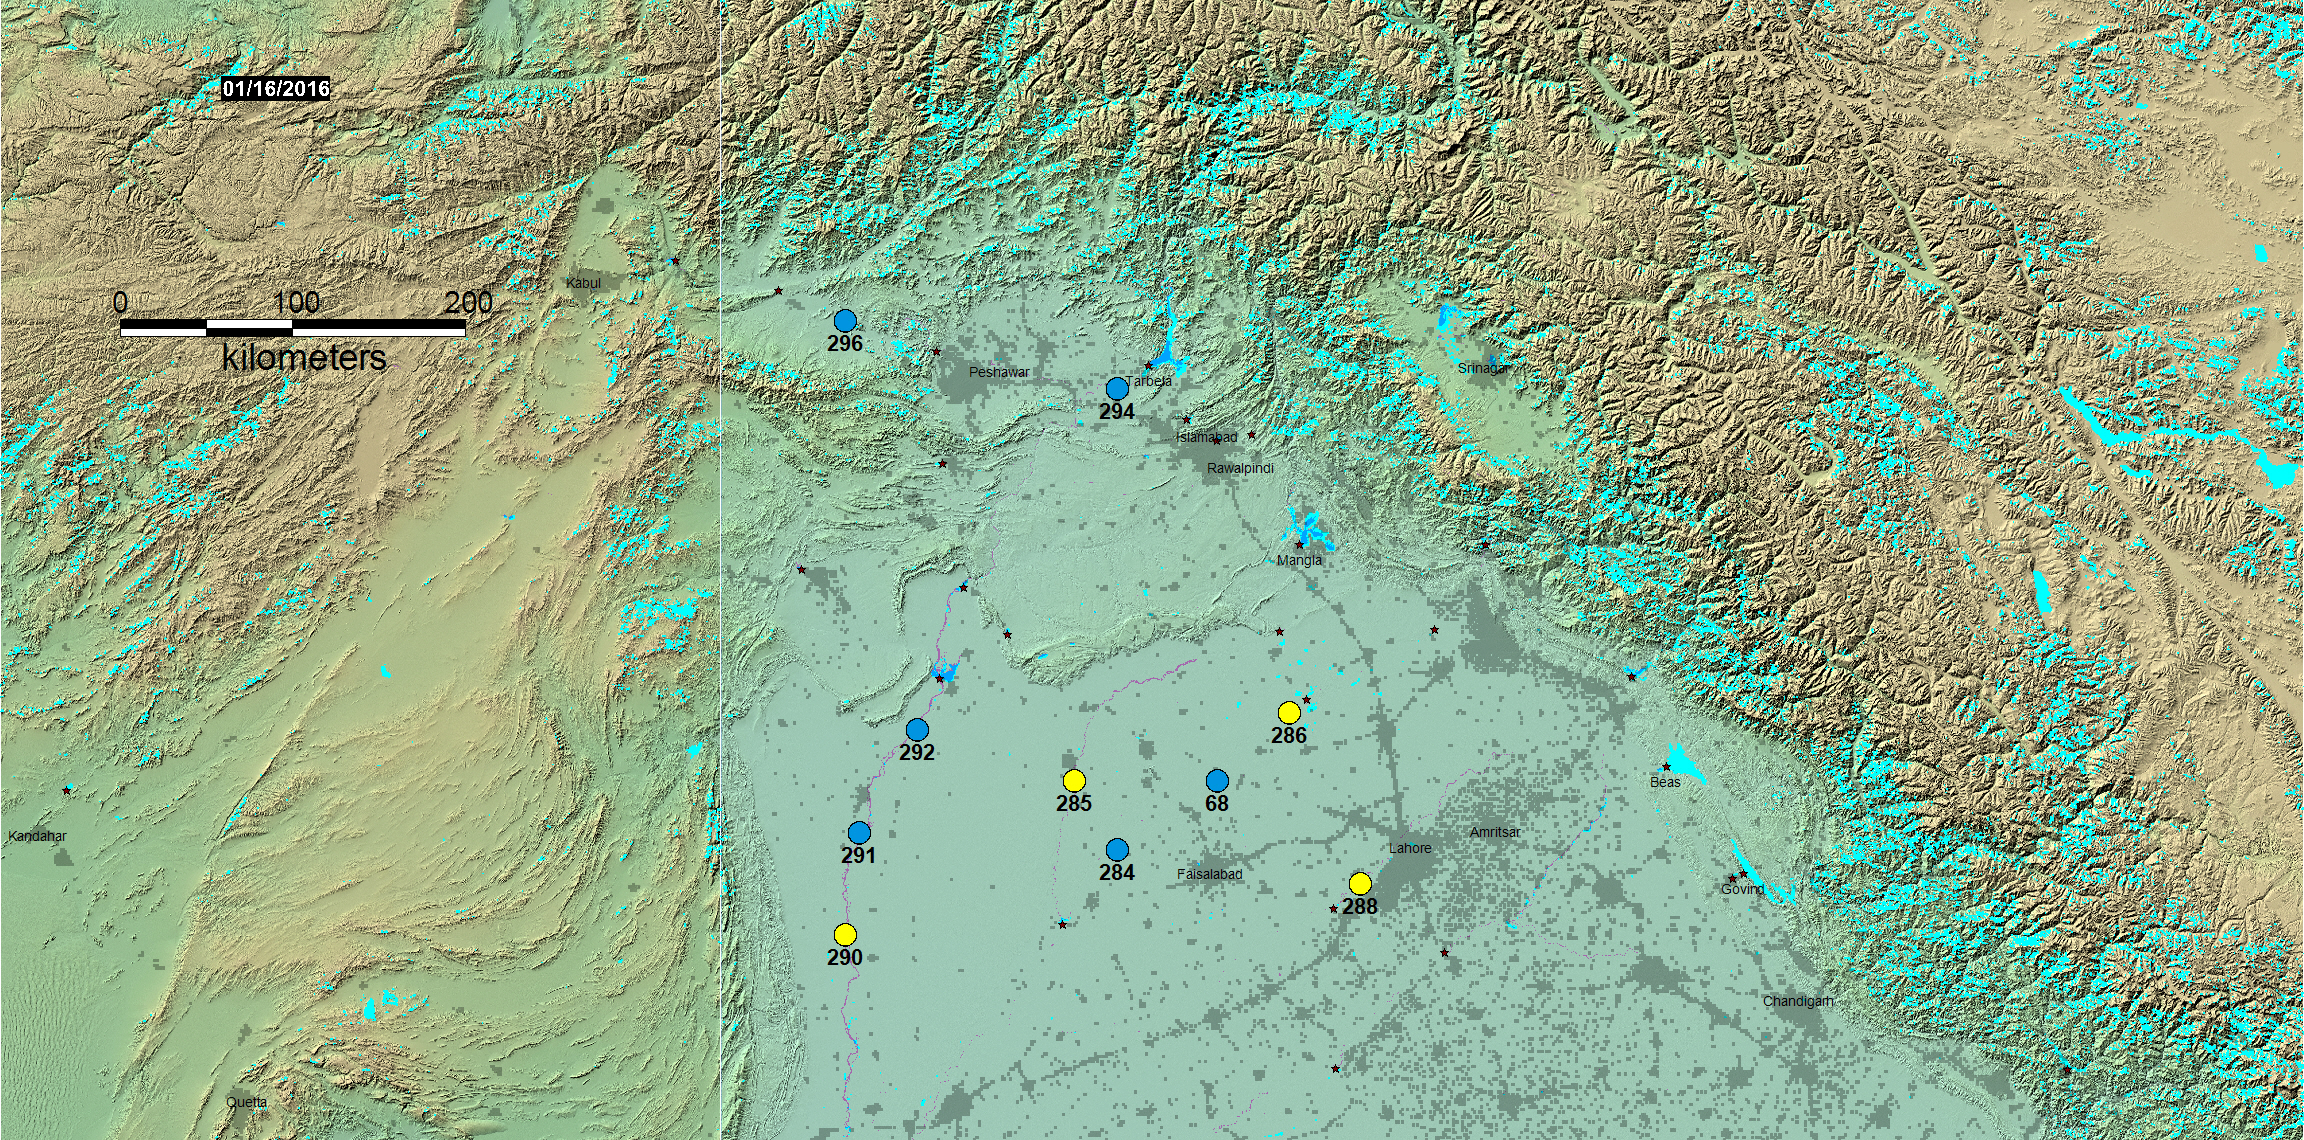
This map provides, with daily updating: current surface water based on NASA MODIS data, satellite-based discharge measurements (at the numbered and clickable sites), and the observed recent history of flooding or surface water contraction (2000 to present).
Mapped water expansions (bright blue) may be short-term, from inland flooding or coastal storm surges. Or expansions may be long-term, from post-2000 construction of new reservoirs or increases in rice agriculture or aquaculture. Reductions in surface water may be from temporary drought conditions, or persist over longer periods (for example, some progressively shrinking wetlands). Note: in mountainous areas, local shadows are commonly mis-classified as water. See also the Record Guide
Map Legend
At the time of map date:
Large areas of purple are dry land (formerly water in February, 2000, when the reference SWBD water database was obtained). At higher latitudes, such areas may be ice-covered water. In cloudy regions, even the 14 day compositing period may not provide complete geographic coverage (e.g., expressed as purple areas within lakes or along shorelines). Small areas of purple are water mapped by SWBD, but are too small to be mappable by MODIS. Dark blue is current water, imaged by MODIS and by SWBD in 2000 ("permanent" water). Bright blue is flooding: expanded water areas mapped by MODIS compared to SWBD. Any post-2000 reservoir or new water body is also depicted in bright blue.Light blue-gray is all previous flooding imaged and mapped by the Flood Observatory (now dry land).
River measurement sites: Yellow dots: low flow (<50 % mean daily runoff for this date). Blue dots: normal flow. Purple dots: moderate flooding (>1.33 yr recurrence). Red dots, major flooding (> 5 yr recurrence).
Brief interpretation of this display:
On July 10, 2014,