Active Archive of Large Floods, 1985-Present
Master Index of Inundation Maps
Satellite River Discharge Measurements
![]()
Space-based Measurement, Mapping, and Modeling of Surface Water
For Research, Humanitarian, and Water Resources Applications
Community Surface Dynamics Modeling System
INSTAAR, University of Colorado, Campus Box 450, Boulder, CO 80309 USAFlood Observatory Mission Statement
The DFO Flood Observatory was established in 1993 at Dartmouth College, Hanover, NH USA and moved to the University of Colorado, INSTAAR in 2010DFO Flood Observatory Director Albert Kettner and Founder and Associate Director Robert Brakenridge
Current Mapping: September, 2024 Typhoon Yagi Flooding in Vietnam
Current Mapping: June, 2024 Flooding in Sylhet, NE Bangladesh
Current Mapping: June, 2024 Flooding in Upper Midwest, USA
Congratulations to the World Food Programme (WFP) for receiving the 2020 Nobel Peace Prize for their efforts to combat hunger, for their contribution to bettering conditions for peace in conflict-affected areas and working to prevent the use of hunger as a weapon of war and conflict. DFO Flood Observatory is looking forward to flood response/flood hazard collaboration for many more years. See press release.
Video showing 2021 flooding in Rohingya refuge camps, Cox's Bazaar, Bangladesh, WFP Bangladesh Country Office
DFO Flood Observatory Web Map Server
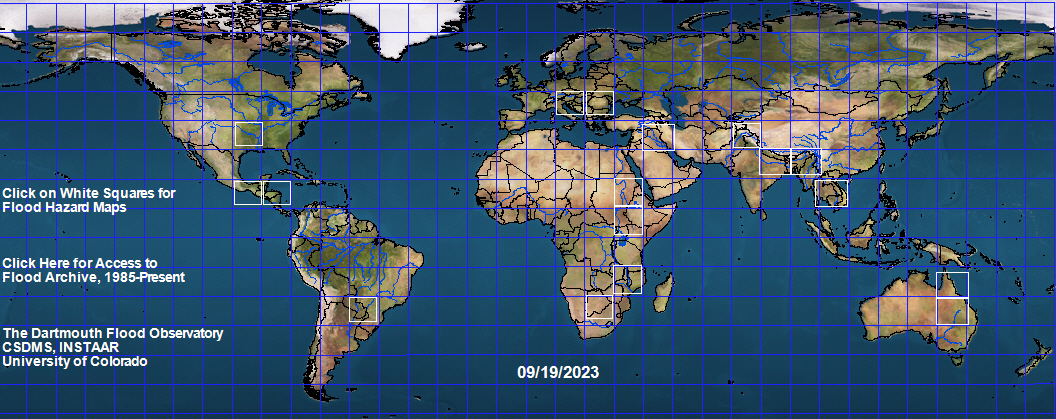
DFO Flood Hazard Maps
(Clickable white squares: hazard maps completed)Whole Earth image from JHT's Planetary Pixel Emporium
.
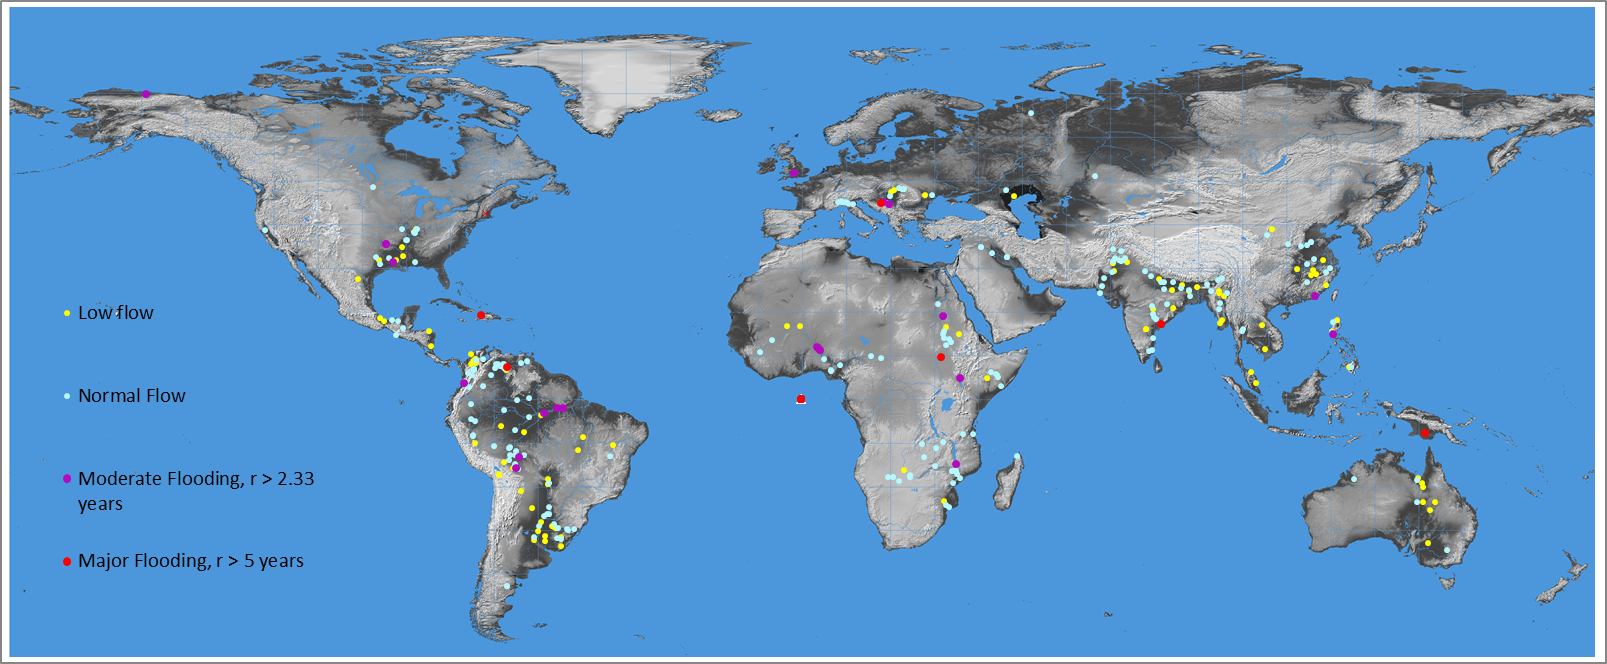
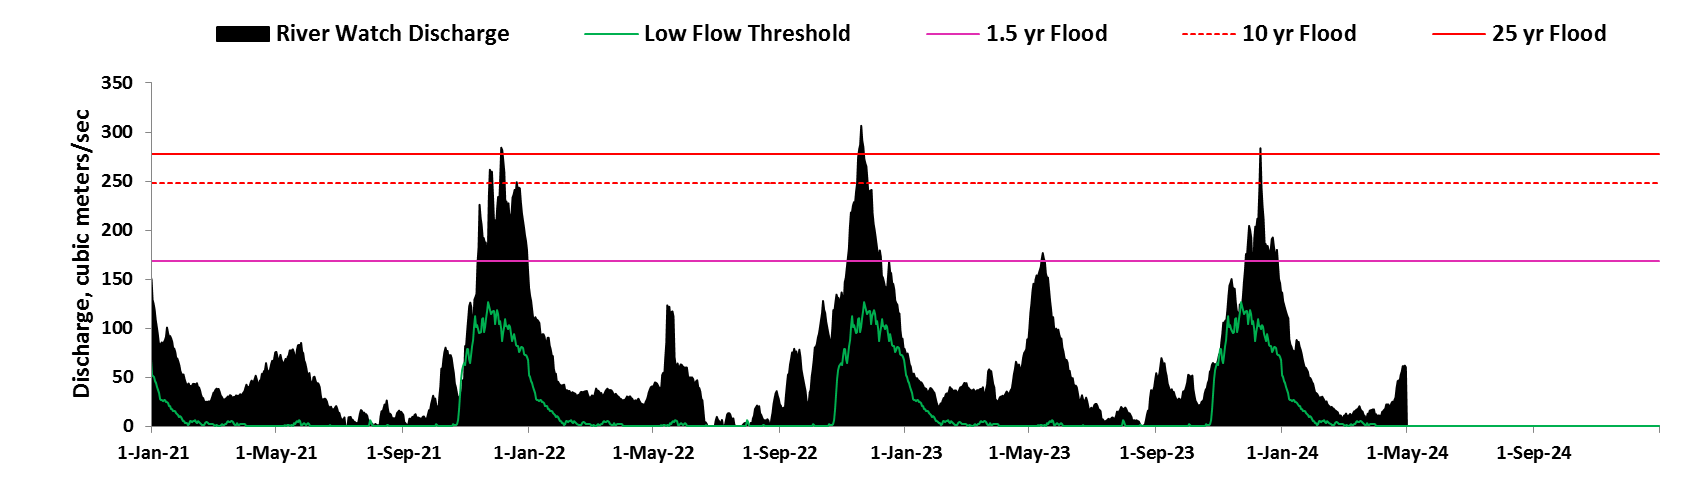
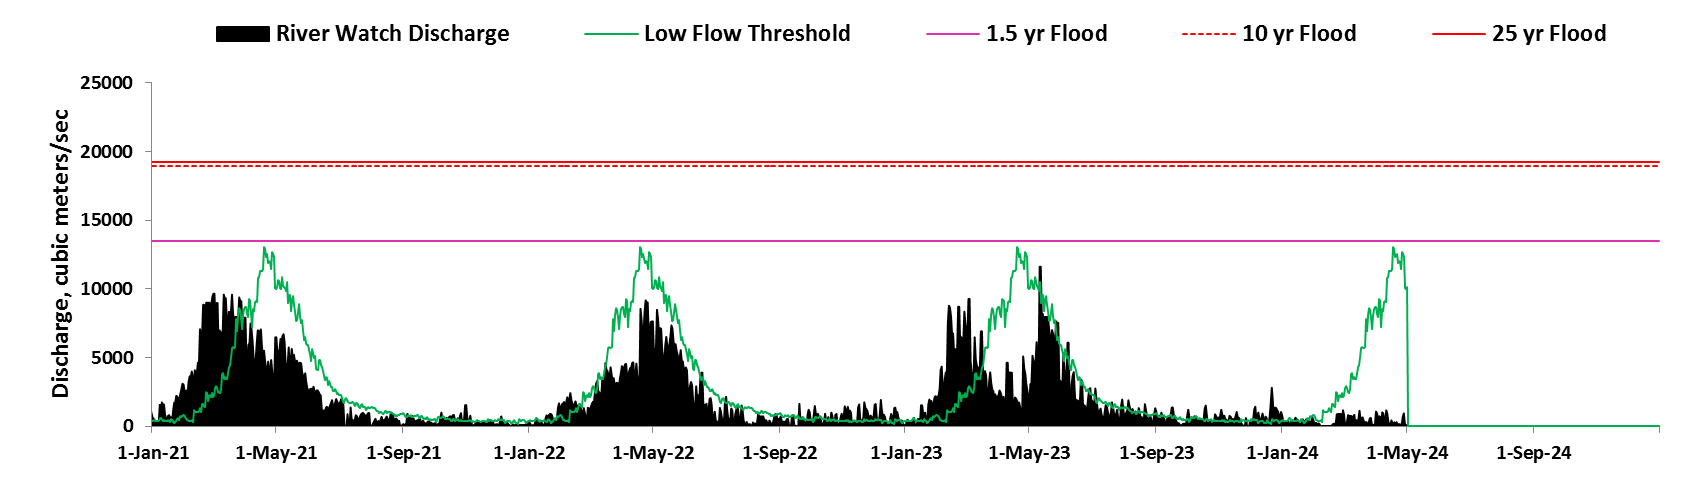
DFO's River and Reservoir Watch provides experimental, fully-automated satellite-based river discharge and reservoir area measurements.
Twice-daily updates at 12:30 and 23:30 Local Denver Time
.
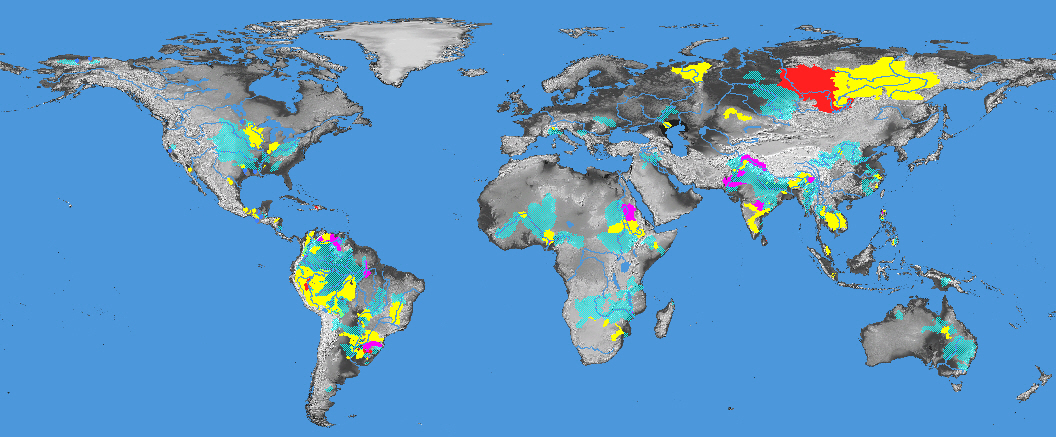
Flood and Drought Affected Watersheds
Twice-daily updates at 2:30 and 14:30 Local Denver Time
.
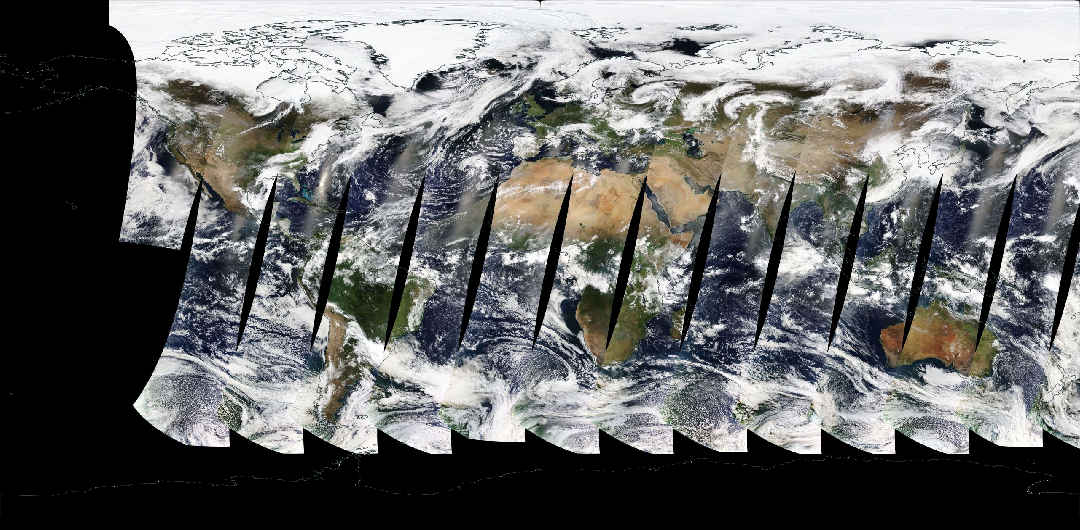
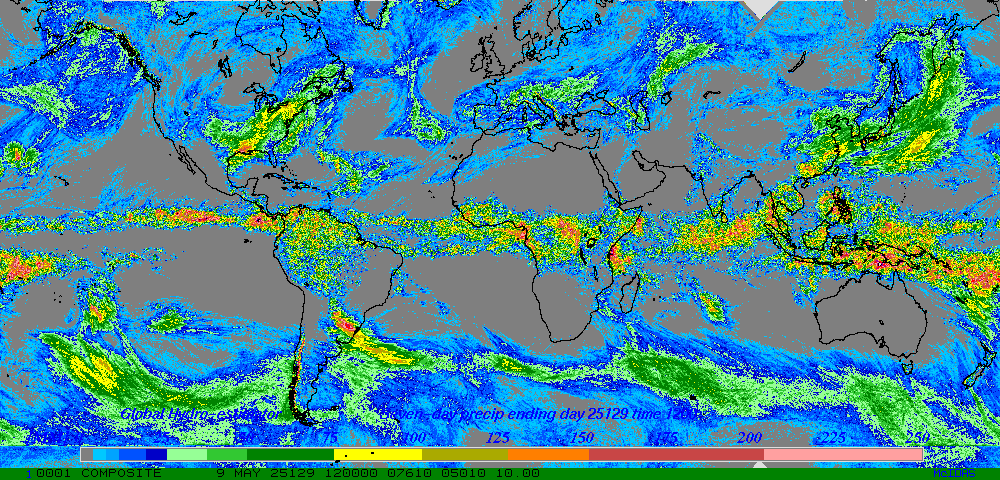
Current NASA Worldview MODIS-Terra Display
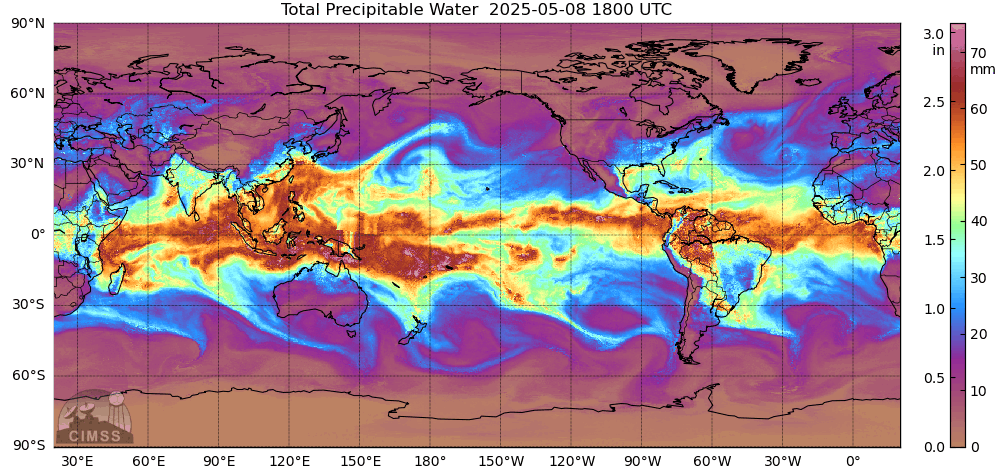
SSMI/SSMIS/AMSR2 Total Precipitable Water
SAMPLE RIVER WATCH RESULTS
Rivers in southern India: See River Watch Site 2041
River Watch also tracks droughts: River Watch Site 277, Zambezi River, Zambia.
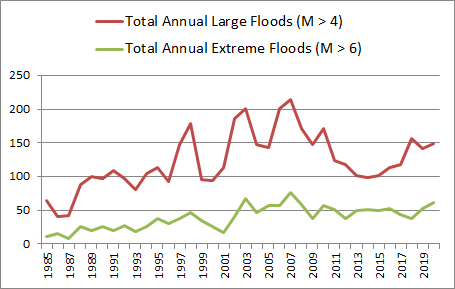
Large and Extreme floods listed in the DFO Flood Archive
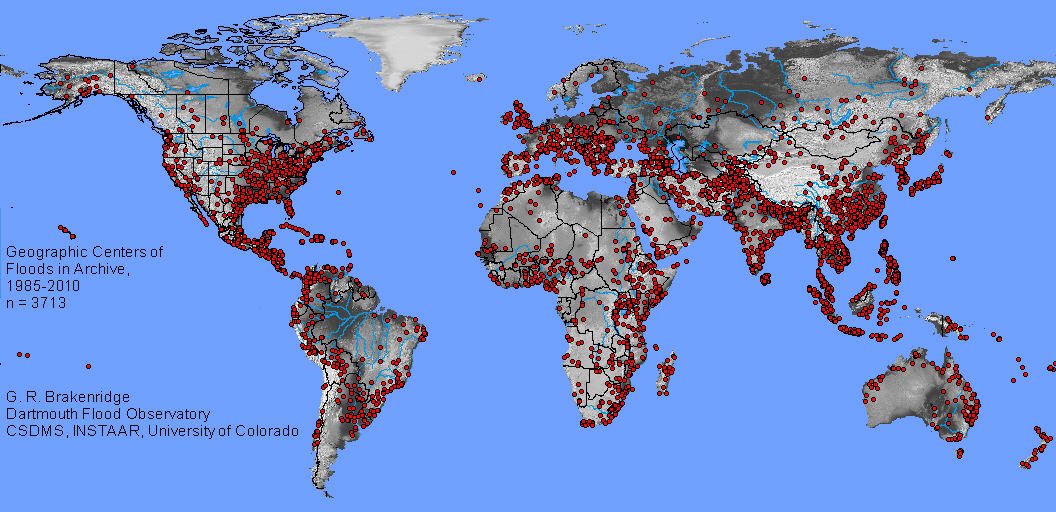
Geographic Centers of floods in the Flood Archive, 1985-2010
Movie of Flood Locations, 1985-2016
Recent Floods Mapped:
2021USA-Ida-5118 (incomplete)
2021China5096
中国河南洪水
2021Germany5095
2021Mozambique 5015
2020Nicaragua Eta 4970
2020Pakistan4966
2020Ethiopia4965
Index of All Floods Mapped (1993-present)
About us:
Colorado Public Radio Interview: "The 2013 Floods Made the Research Personal"
Science Article about DFO by Jason Plautz
Just a thought:
Poem for a Transnational River
(counting since February 7, 2012)
This work is made possible by data acquired by NASA, the Japanese Space Agency, and the European Space Agency, and funding support from NASA and the European Commission, through the Global Disaster Alert and Coordination System (GDACS) project, Joint Research Centre, Ispra, Italy. The Observatory was founded in 1993 at Dartmouth College, Hanover, NH USA and moved to the University of Colorado, INSTAAR, CSDMS in 2010. The institutional support of both universities is gratefully acknowledged.
http://floodobservatory.colorado.edu/Flood Observatory