


![]()
"USA – 1 Person Missing, 20 Homes Destroyed After Remnants of Hurricane Ida Cause Floods in Virginia 1 SEPTEMBER, 2021 BY RICHARD DAVIES IN NEWS, USA share tweet save share share Governor Ralph Northam declared a state of emergency in Virginia on 31 August after rain brought by the remnants of Hurricane Ida caused devastating floods and mudslides with more severe weather forecast. Flood damages in Hurley, VA, USA August 2021. Photo; Roanoke Fire-EMS Raging flash floods and mudslides swept through parts of Buchanan County, Virginia, on 31 August 2021. More than 20 homes were destroyed in the small community of Hurley situated in a valley along Knox Creek. Around 60 people were evacuated with some taking shelter in a local church. Four people were initially reported unaccounted for but 3 have since been located. Buchanan County Sheriff’s Office said as of 31 August that one person was still missing.” See Flood List.
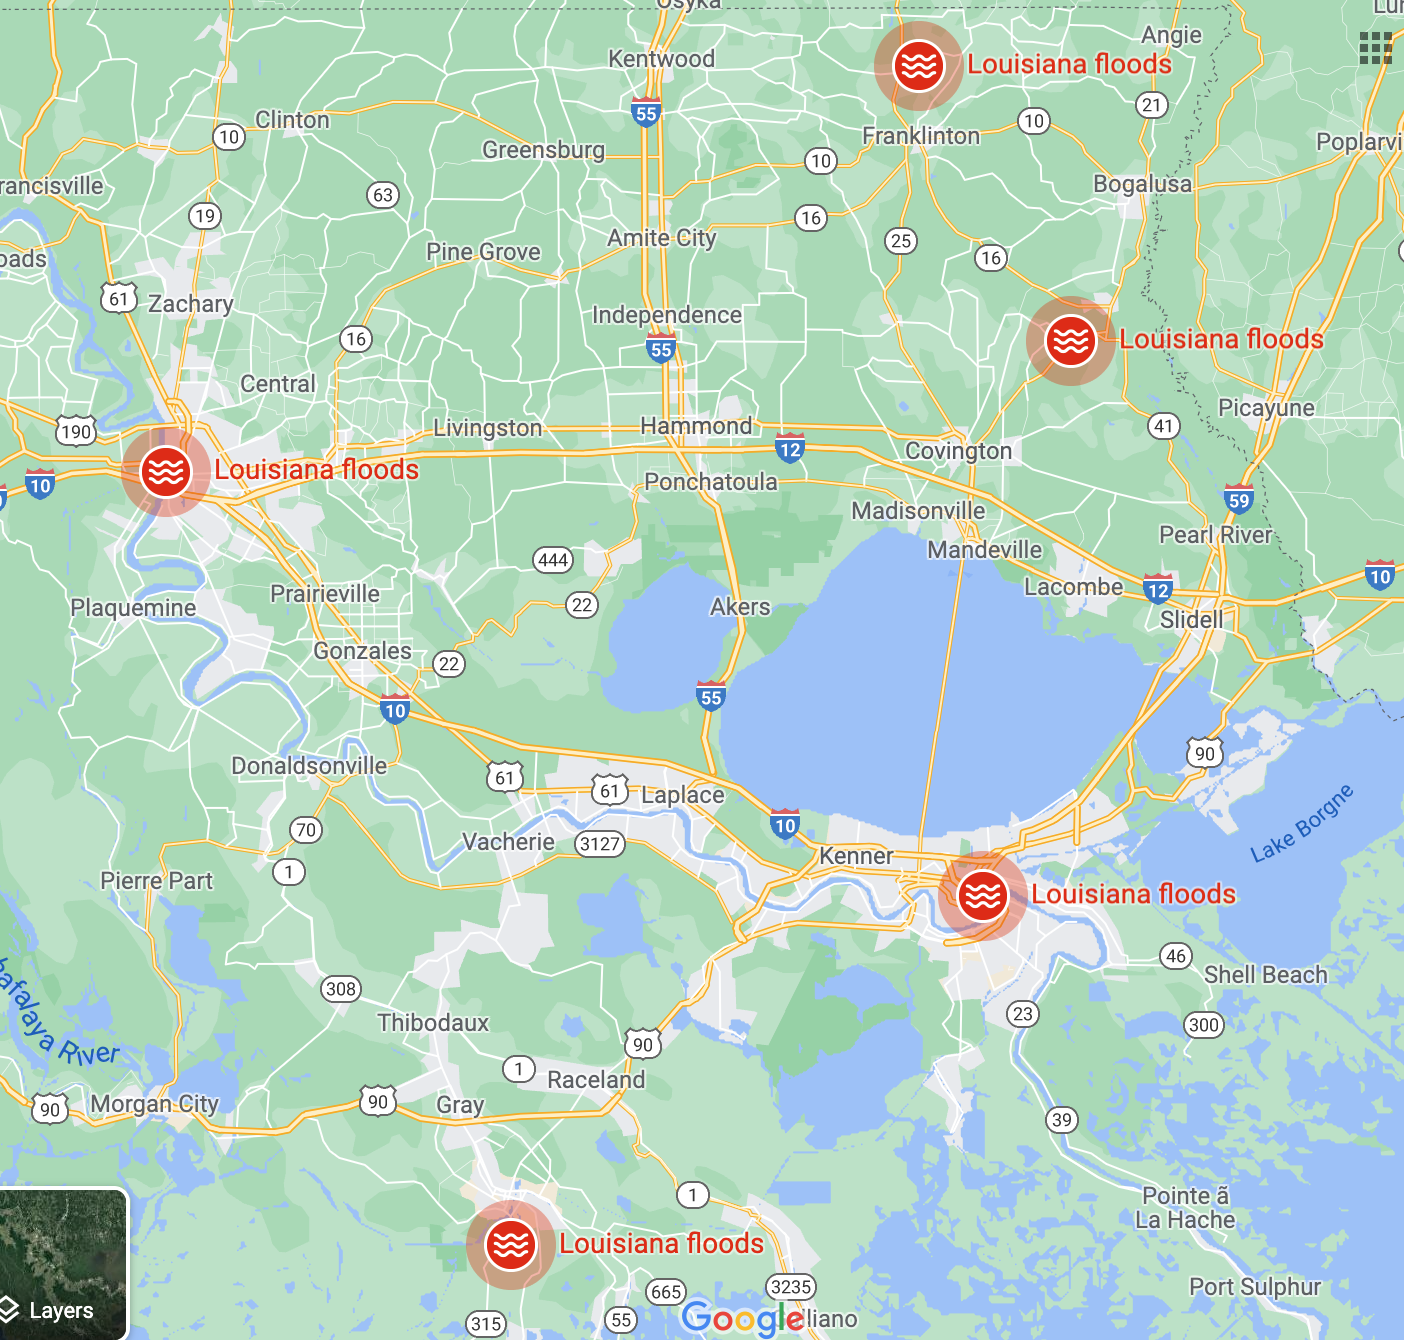
The Flood Observatory maintains a Global Active Archive of large flood events, 1985 to present. New major flood events are entered into this archive each week. A hand-drawn GIS polygon for each event outlines the region affected.
This event was selected for Observatory production of map and GIS data products.This web page and associated image and map (GIS) files become the permanent Flood Observatory record of the flood.
As part of collaborations with other organizations, including
GEO and the Global Flood
Partnership, the Observatory's maps are made available here to the public.
Geotif versions and GIS files are also available. With attribution, maps and
data can be used freely for non-commercial purposes. With permission, they can
be used for commercial purposes. Consult Robert.Brakenridge or Albert.Kettner (at
Colorado.edu) if questions. Attribution for this map when Sentinel SAR data are
used: "Dartmouth Flood Observatory at the University of Colorado, from satellite
data provided by NASA and Copernicus/European Space Agency". When using GIS data
(see below) provided to DFO from other sources, please acknowledge original
source.
NASA Landsat 8 and Copernicus/ESA Sentinel SAR data if used in this map were obtained from the the U.S. Geological Survey Hazards Data Distribution System. and the Sentinels Science Data hub, respectively. Landsat 8 is jointly managed by NASA and the United States Geological Survey. Copernicus is supported by the European Commission. MODIS data are obtained from the NASA NRT Global Flood Mapping facility (surface water extents) and from NASA Worldview (image files); SUOMI/VIIRS image data are also retrieved from NASA Worldview. Sentinel 1 SAR-based flood mapping is also contributed by Xinyi Shen and Qing Yang and the Rapid system at the University of Connecticut.
Flood extent files (Shp or Mapinfo) and geotif files supporting this Flood Event Map are located here.
These files may include high spatial resolution mapping such as from Sentinel or Landsat, or lower resolution files from MODIS. File names commonly include the sensor source (e.g., S1 for Sentinel 1, LS8 for Landsat, MODIS, Aqua, or Terra for MODIS) and the image date.
The NASA Earth Sciences Program, the Latin American Development Bank, the World Bank, the European Commission's Global Disaster Alert and Coordination System, GDACS, and Copernicus Emergency Management Service, the Google Earth Engine research awards program, the Committee on Earth Observation Satellites (CEOS) Disasters Working Group-Flood Pilot, the Japanese Space Agency, and the European Space Agency all have supported the Observatory's work via research grants and contracts or free satellite-derived data.
The Dartmouth Flood Observatory was founded in 1993 at Dartmouth College, Hanover, NH USA and moved to the University of Colorado, INSTAAR, CSDMS in 2010. The institutional support of both universities is gratefully acknowledged.
(counting since August 29, 2021)