


![]()
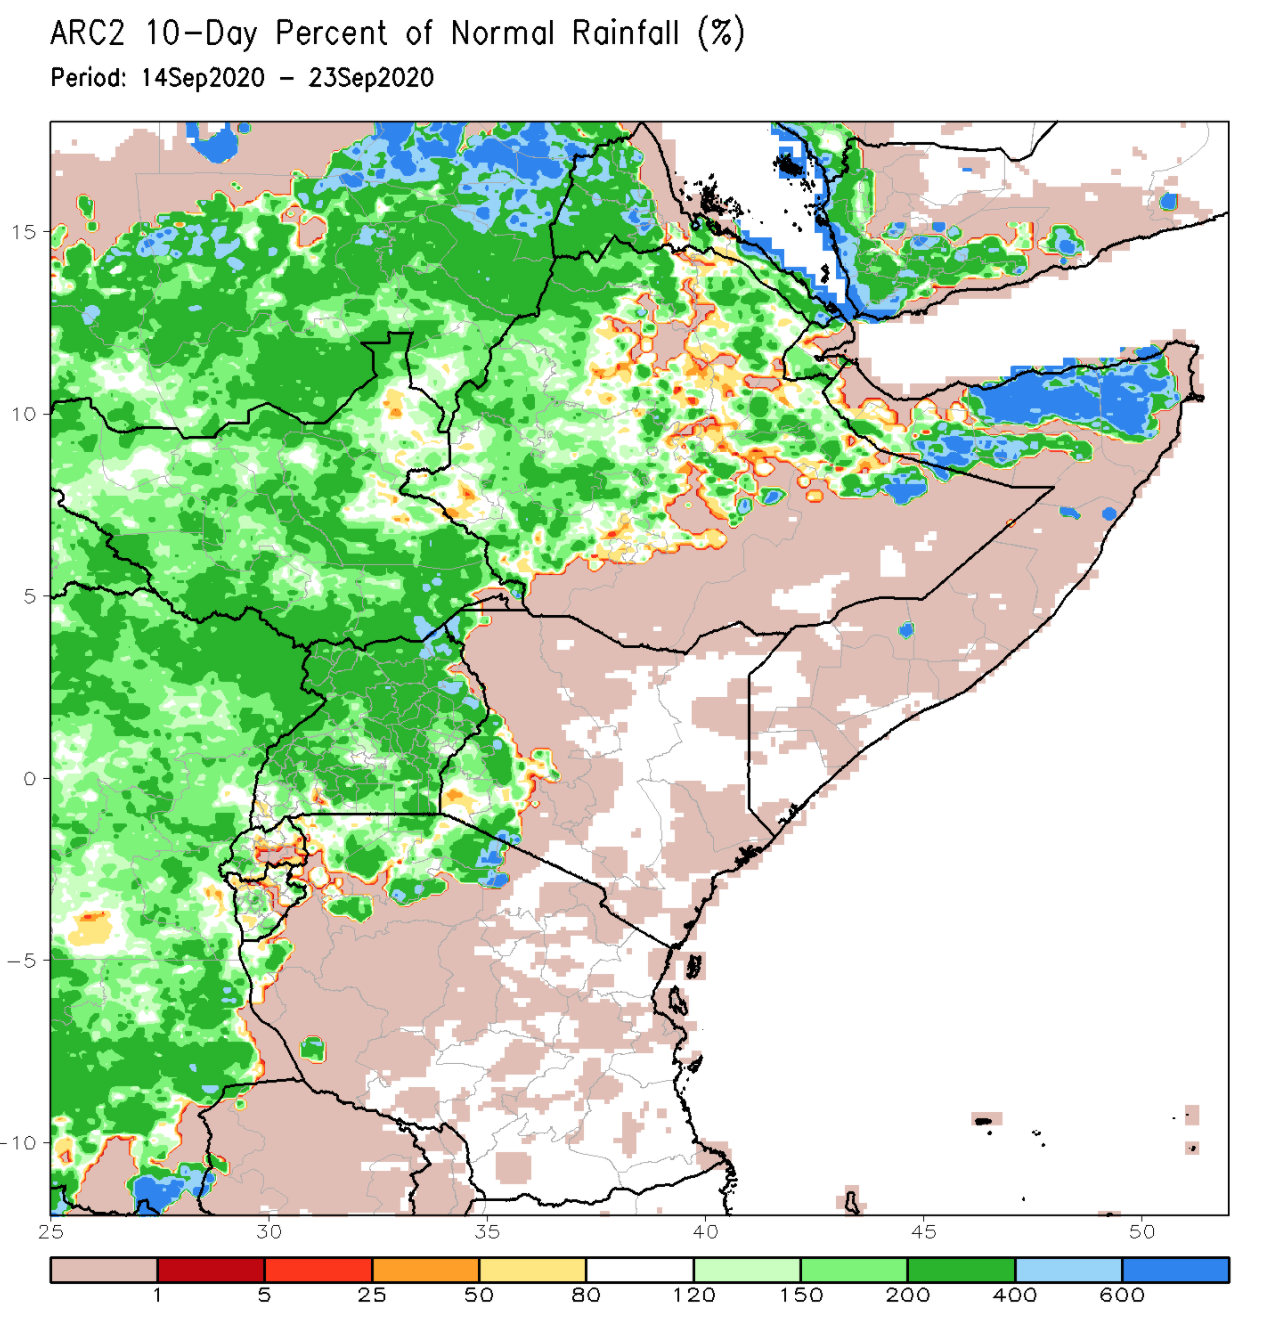
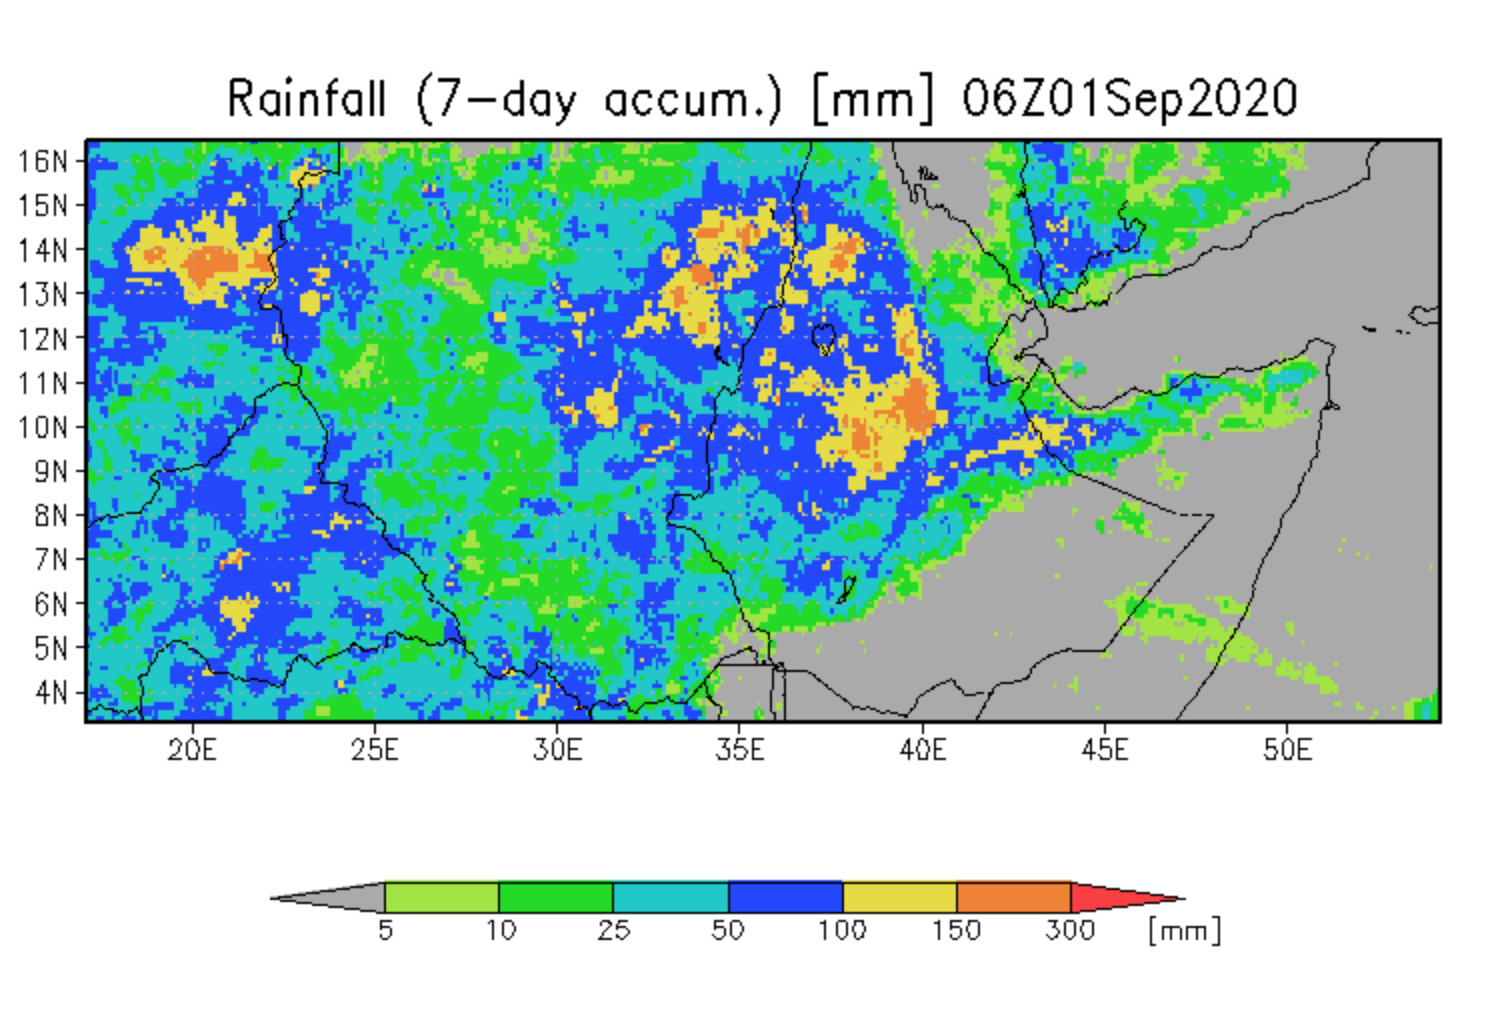
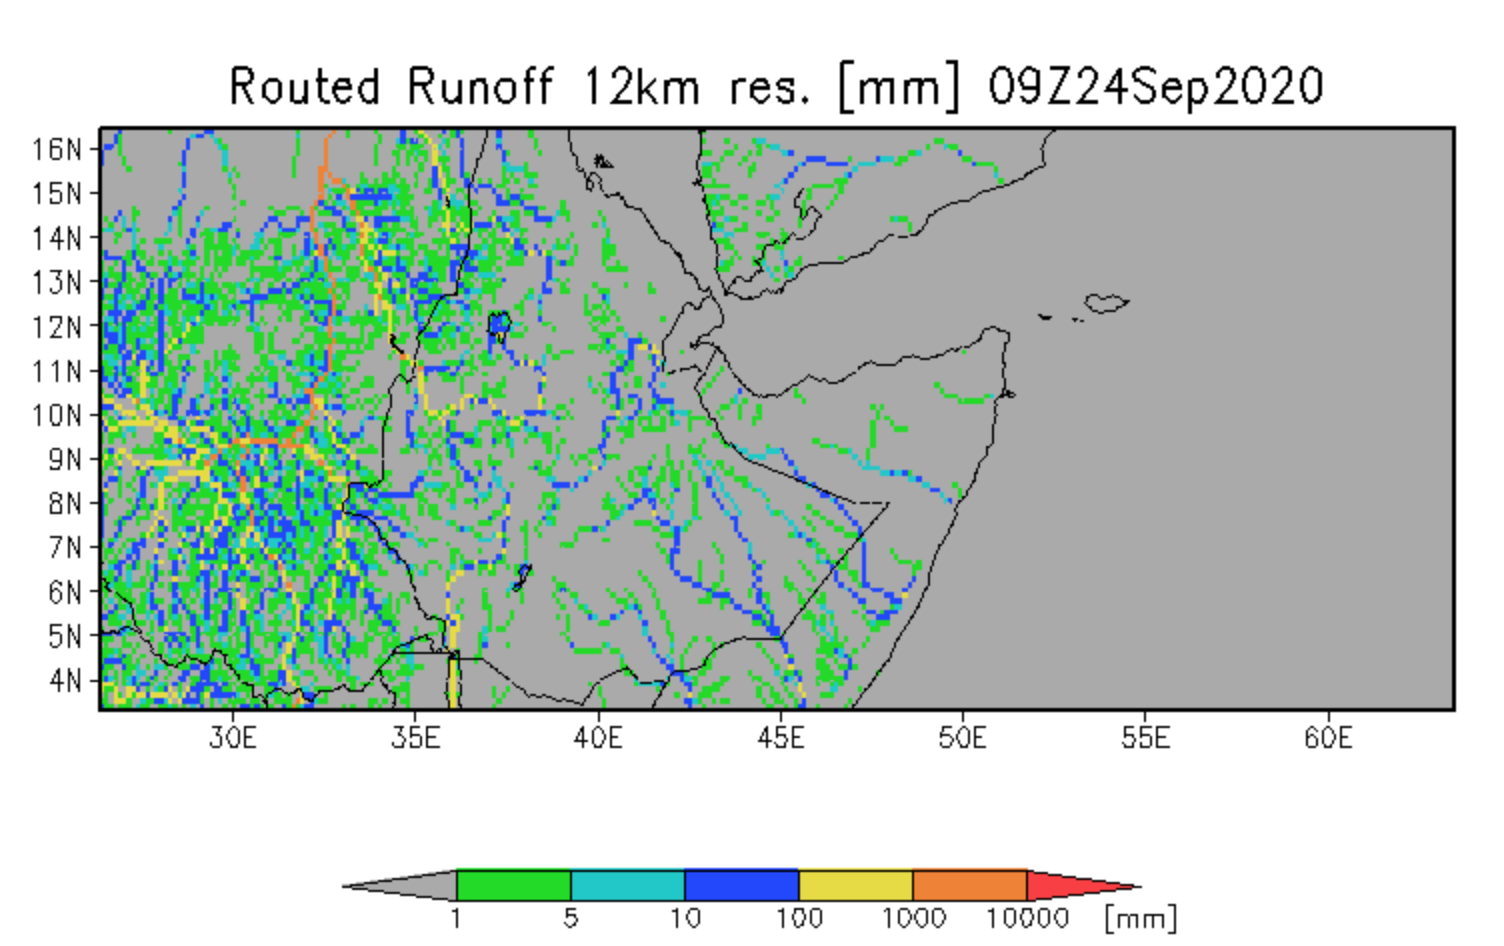
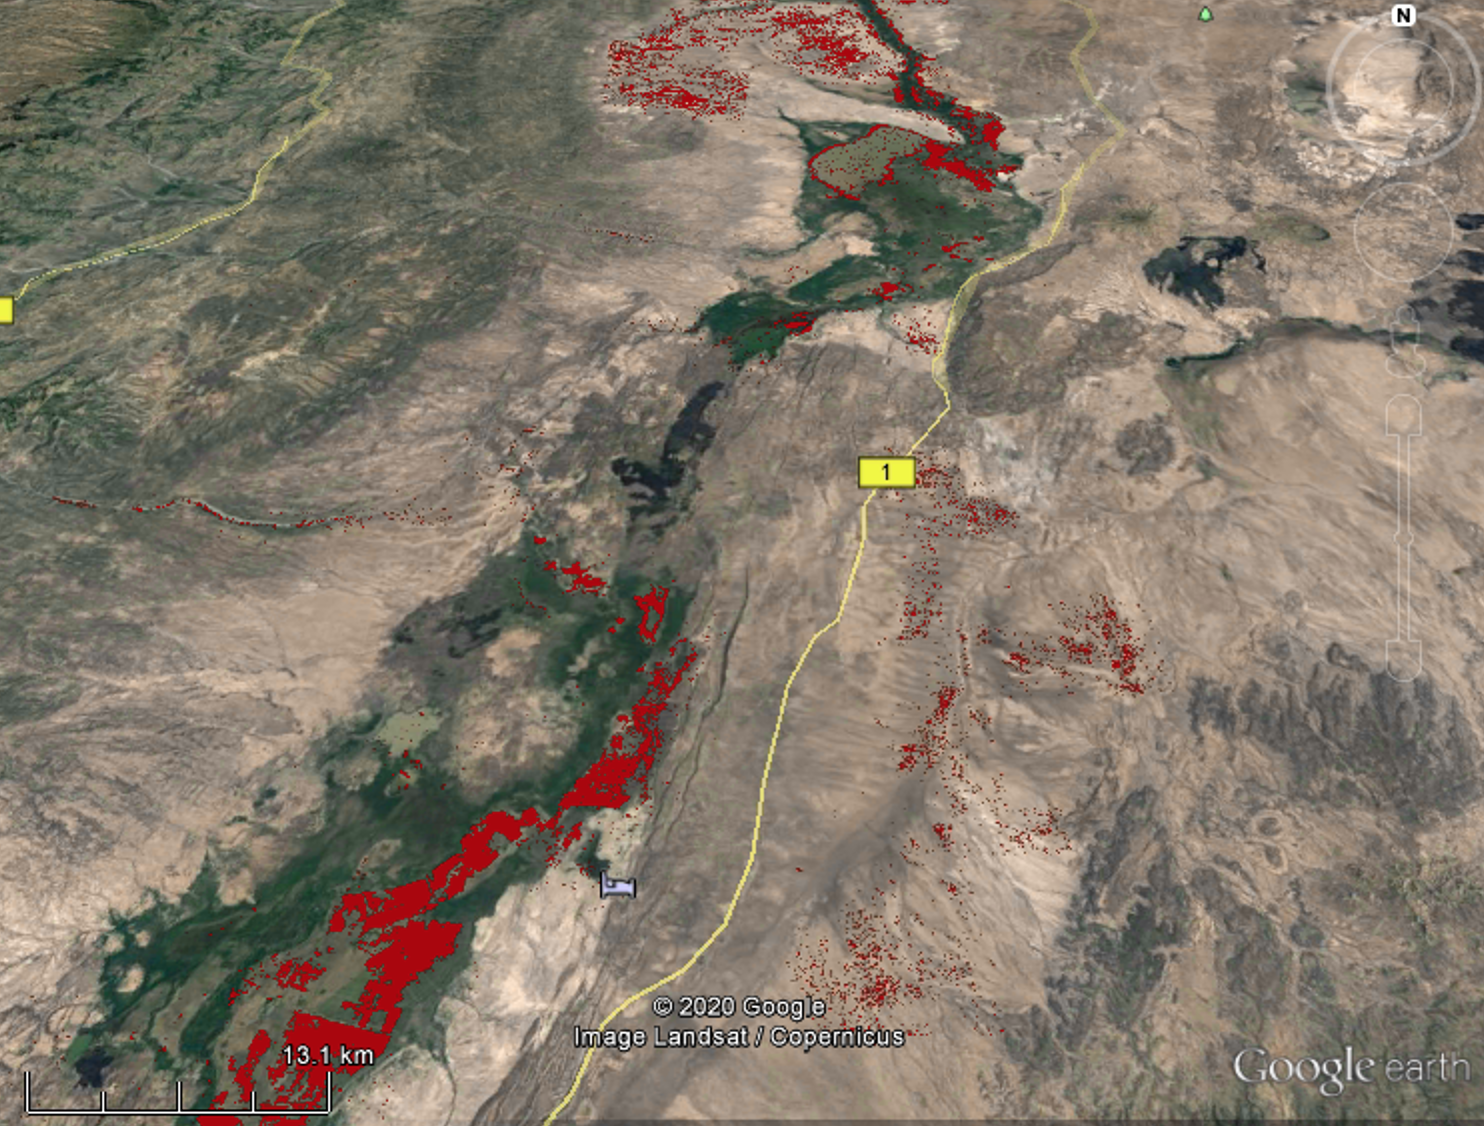
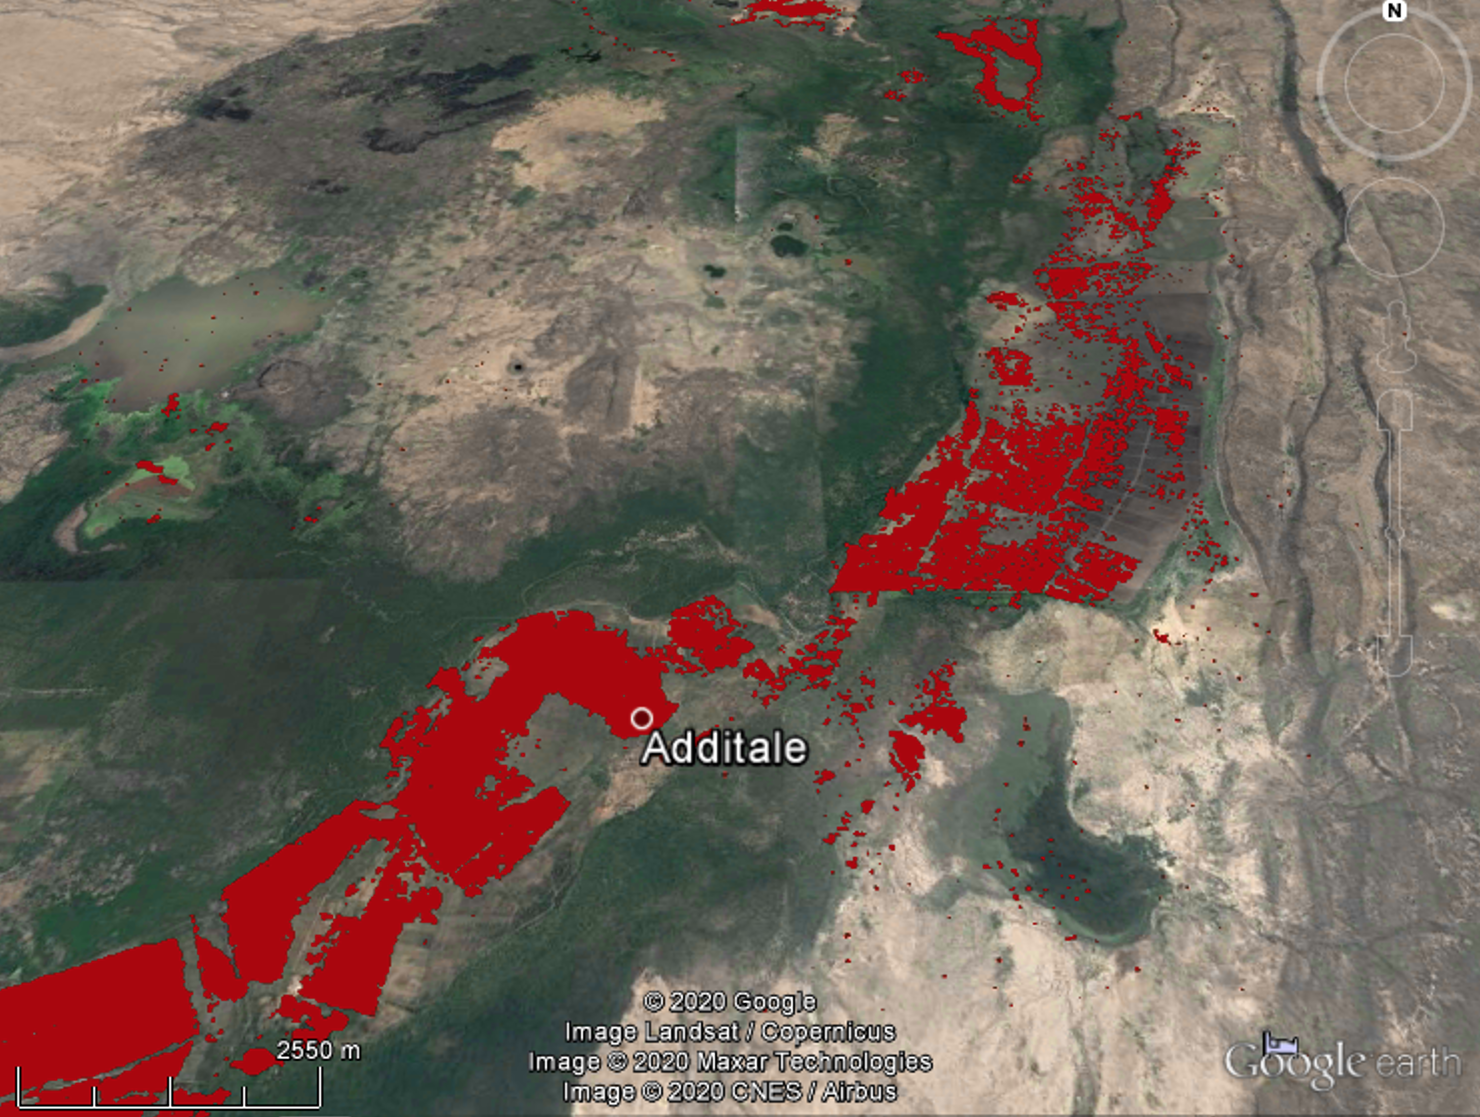
"Ethiopia – 144,000 Displaced by Awash River Flooding in Afar Region 23 SEPTEMBER, 2020 BY FLOODLIST NEWS IN AFRICA, NEWS The government in Ethiopia reports that unprecedented flooding caused by the overflow of the Awash River has displaced more than 144,000 persons in Afar Regional State. According to state disaster officials, the overflow of Kesem, Tendaho, and Koka dams on the Awash River were the cause of displacement of more than 144,000 people. Flooding in the state has affected 240,000 people, demolished 105 schools, 200 rural roads, 6 bridges, and killed over 21,000 domestic animals. Flooding has also damaged around 60,000 hectares of crops and farmland. Over 1 Million Affected by Floods Since July Unusually heavy Kiremt season (June to September) rainfall triggered flooding in Ethiopia from late July. By early August the UN reported 30,000 people had been displaced, with many of them in the Afar region after the overflow of Awash River. The regions of Gambella, Oromia, SNNP and later Amhara were also affected. In a report of 06 September UN Office for the Coordination of Humanitarian Affairs (OCHA) said “heavy summer season (June-September) rains continue to cause flooding in many parts of the country. Some 500,000 people were so far affected, including some 300,000 displaced.” The most recent figures from the country’s National Disaster Risk Management Commission (NDRMC) indicate that close to 1,017,854 people are affected by flooding and 292,863 people are displaced across the country. As many as 447,565 people are affected in Oromia, 144,490 in Amhara, 140,892 in Somali, and 90,121 in SNNP.” Quoted from Flood List
NOAA/NWS Climate Prediction Center Satellite Rainfall Estimates
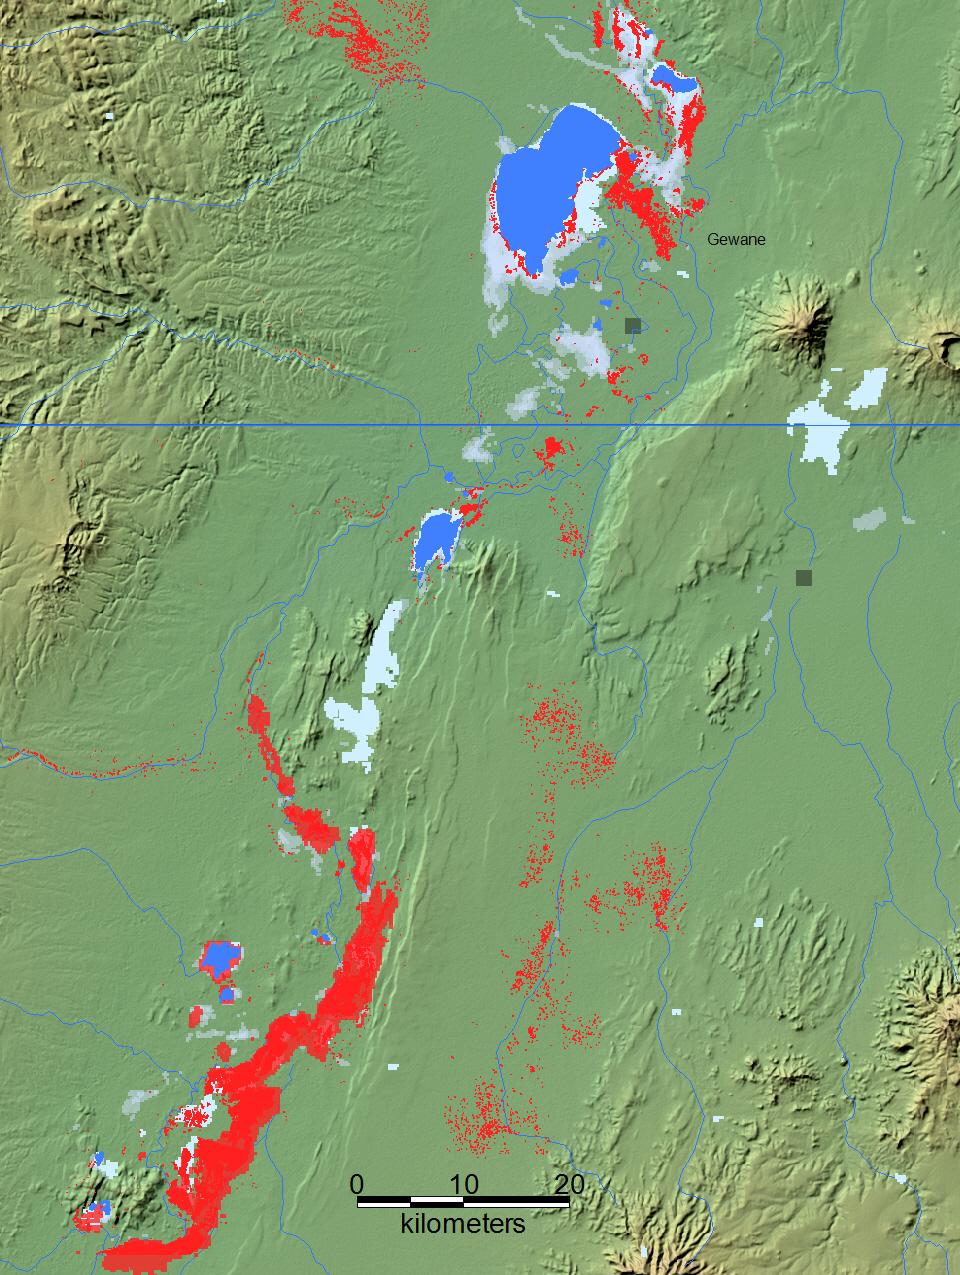
The Flood Observatory maintains a Global Active Archive of large flood events, 1985 to present. New major flood events are entered into this archive each week. A hand-drawn GIS polygon for each event outlines the region affected.
This event was selected for Observatory production of map and GIS data products.This web page and associated image and map (GIS) files become the permanent Flood Observatory record of the flood.
As part of collaborations with other organizations, including
GEO and the Global Flood
Partnership, the Observatory's maps are made available here to the public.
Geotif versions and GIS files are also available. With attribution, maps and
data can be used freely for non-commercial purposes. With permission, they can
be used for commercial purposes. Consult the Creative Commons Attribution-NonCommercial-ShareAlike 4.0
International License and Robert.Brakenridge or Albert.Kettner (at
Colorado.edu) if questions. Attribution for this map when Sentinel SAR data are
used: "Dartmouth Flood Observatory at the University of Colorado, from satellite
data provided by NASA and Copernicus/European Space Agency". When using GIS data
(see below) provided to DFO from other sources, please acknowledge original
source.
NASA Landsat 8 and Copernicus/ESA Sentinel SAR data if used in this map were obtained from the the U.S. Geological Survey Hazards Data Distribution System. and the Sentinels Science Data hub, respectively. Landsat 8 is jointly managed by NASA and the United States Geological Survey. Copernicus is supported by the European Commission. MODIS data are obtained from the NASA NRT Global Flood Mapping facility (surface water extents) and from NASA Worldview (image files); SUOMI/VIIRS image data are also retrieved from NASA Worldview.
Flood extent files (Shp or Mapinfo) supporting this Flood Event Map are located here.
These files may include high spatial resolution mapping such as from Sentinel or Landsat, or lower resolution files from MODIS. File names commonly include the sensor source (e.g., S1 for Sentinel 1, LS8 for Landsat, MODIS, Aqua, or Terra for MODIS) and the image date.
The NASA Earth Sciences and Applied Sciences programs, several international development banks, the European Commission's Global Disaster Alert and Coordination System, GDACS, and its Copernicus Emergency Management Service, the Google Earth Engine research awards program, the Committee on Earth Observation Satellites (CEOS) Disasters Working Group-Flood Pilot, the Japanese Space Agency, and the European Space Agency all have supported the Observatory's work via research grants and contracts or free satellite data.
The Dartmouth Flood Observatory was founded by Robert Brakenridge in 1993 at Dartmouth College, Hanover, NH USA and moved to the University of Colorado, INSTAAR, CSDMS in 2010. The institutional support of both universities is gratefully acknowledged.
(counting since September 24, 2020)