


![]()
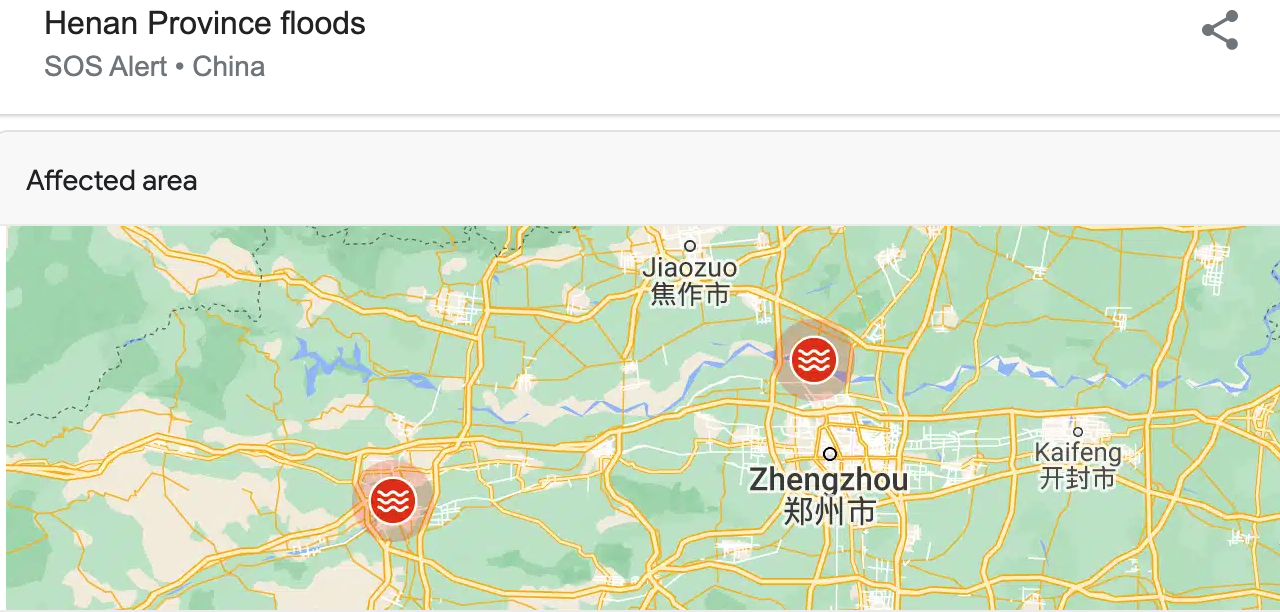
"China – Over 350,000 Evacuated, 33 Dead, 8 Missing After Zhengzhou and Henan Floods 22 July, 2021 by Richard Davies in Asia, News. As many as 33 people have lost their lives in the catastrophic flooding in Henan province in central China. Massive flooding struck the city of Zhengzhou and areas of Henan Province on 20 July 2021 after days of torrential rain. According to state media, as of 22 July, 33 people have lost their lives and 8 are still missing. Around 3 million people have been affected and 376,000 people relocated to safer accommodation. Images shared on Social Media showed streets of the city of Zhengzhou turned to rivers, with floating cars and residents stranded or wading through flood water up to 1.8 metres deep. The city’s subway was flooded, leaving passengers stranded and some trapped in train carriages up to their chests in flood water. Many were rescued after making their way to safety walking along flooded train tracks.” See Flood List.
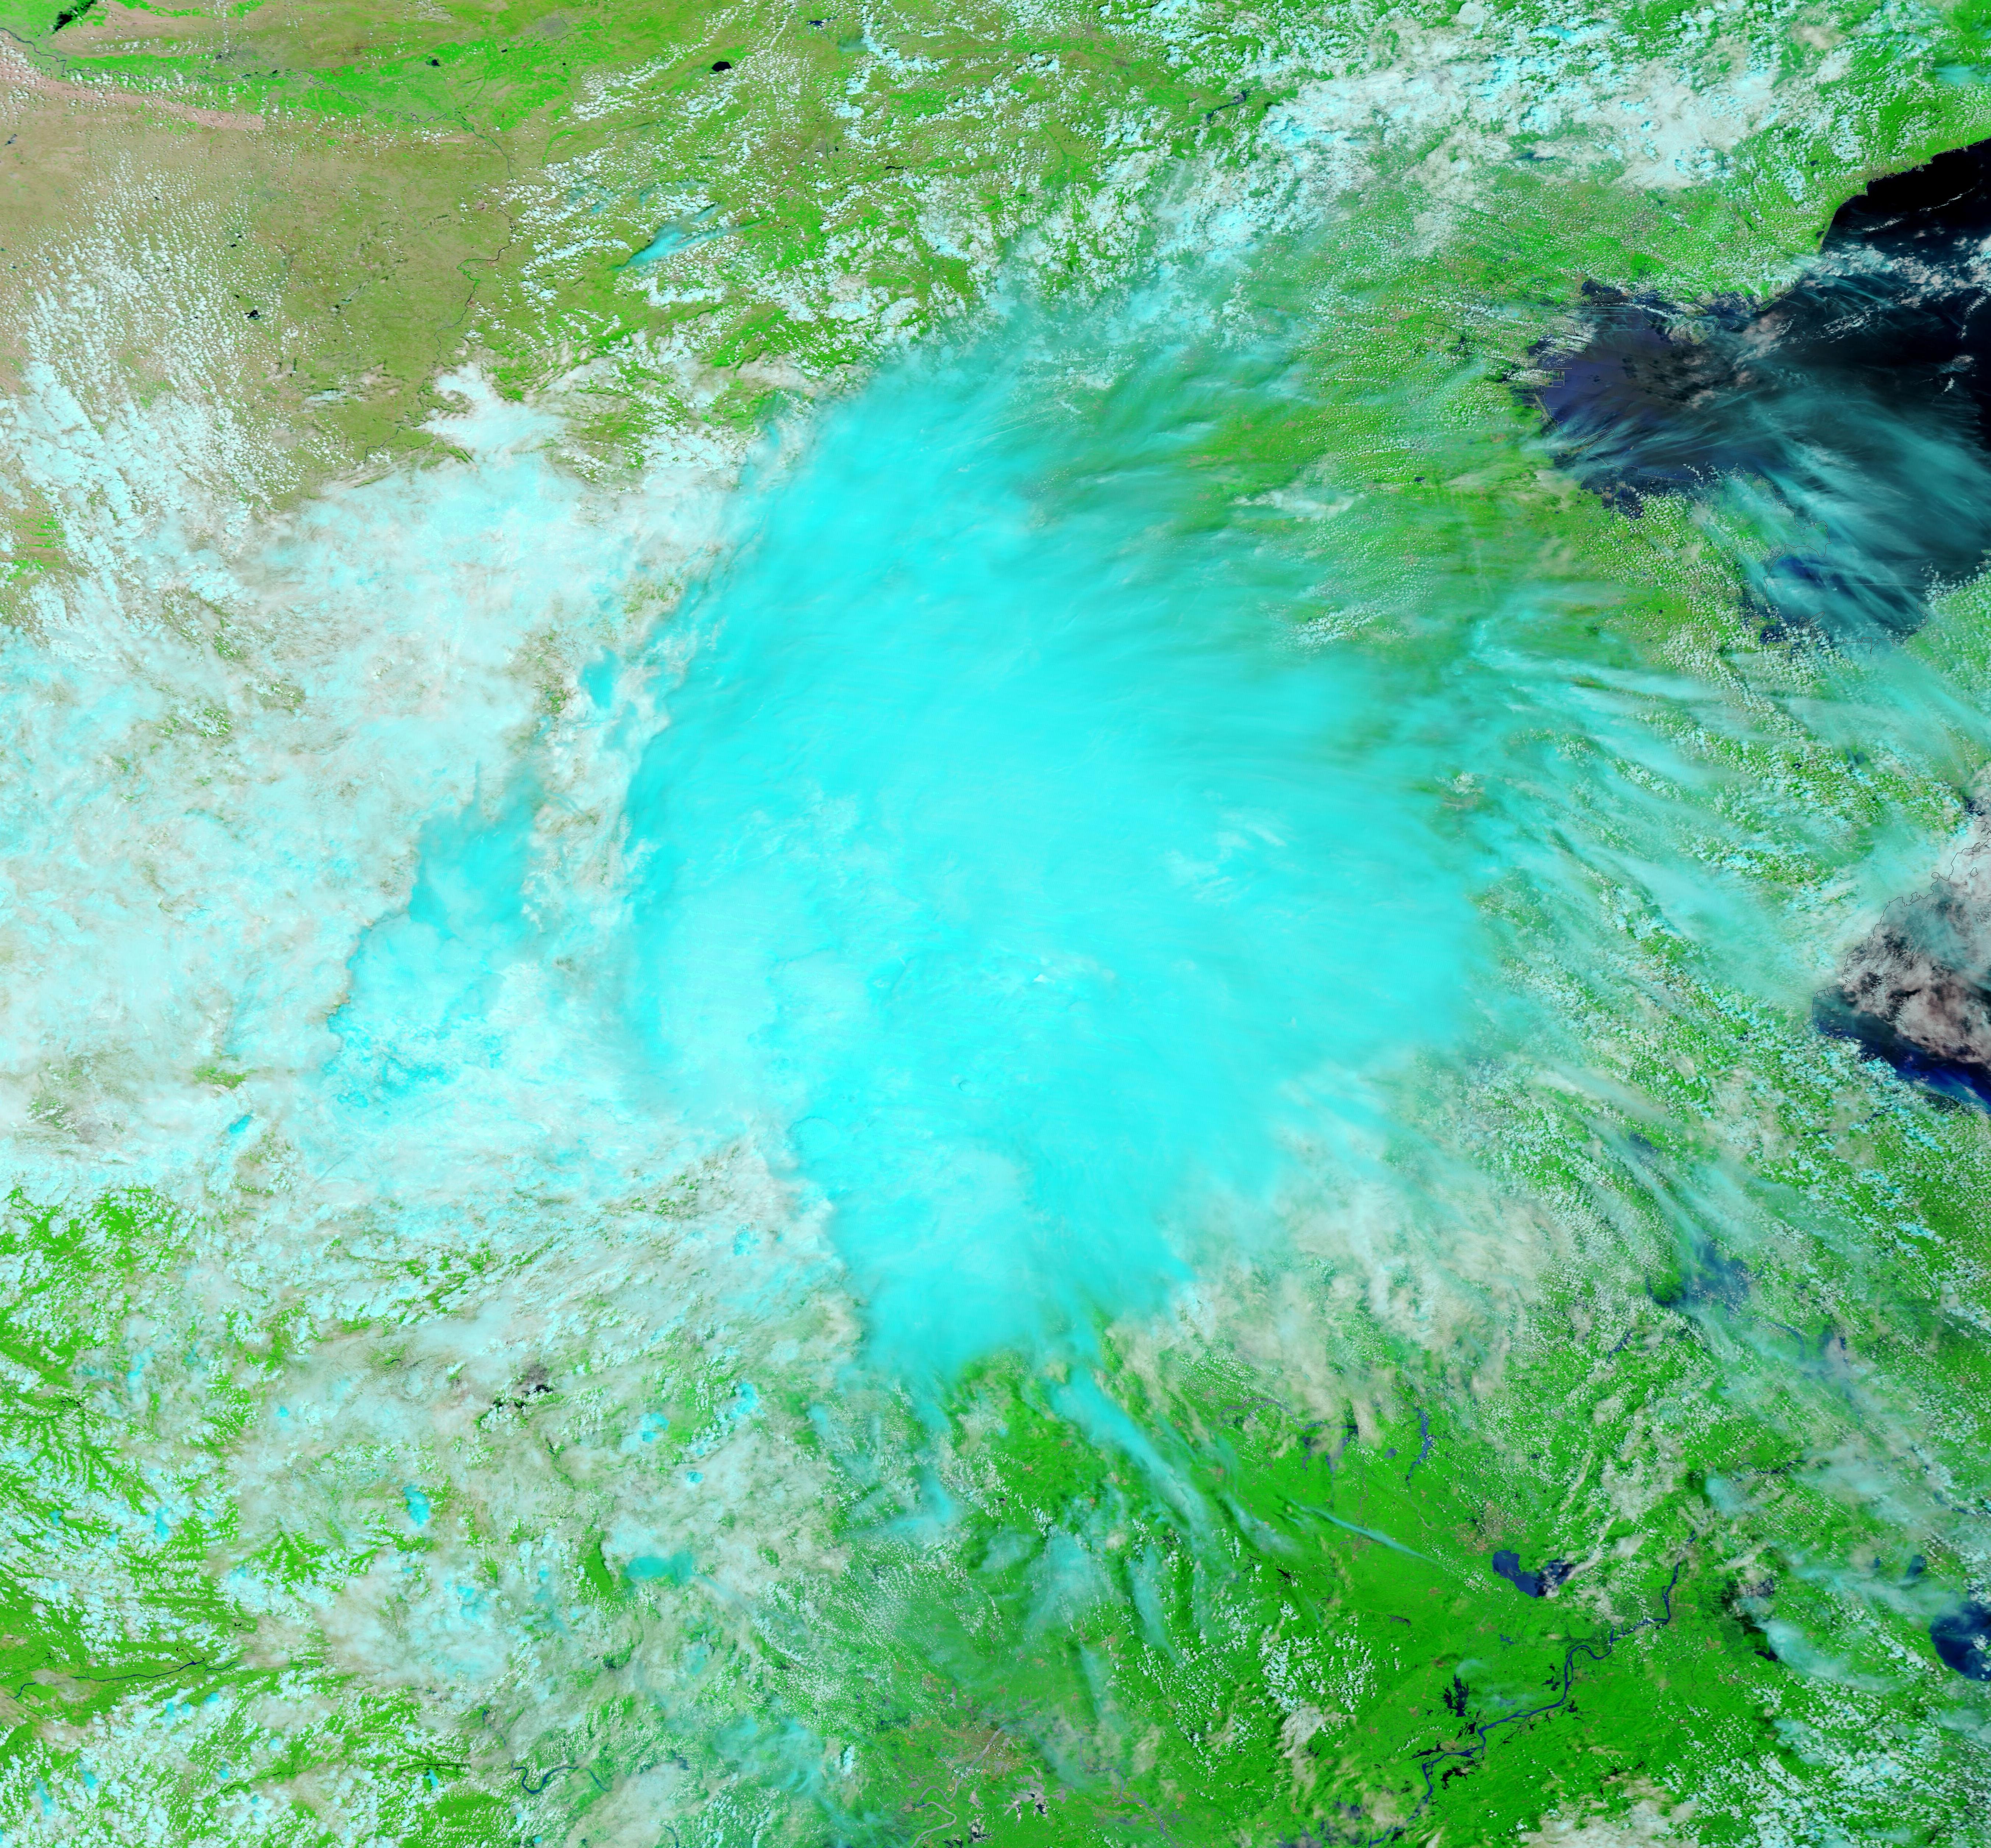
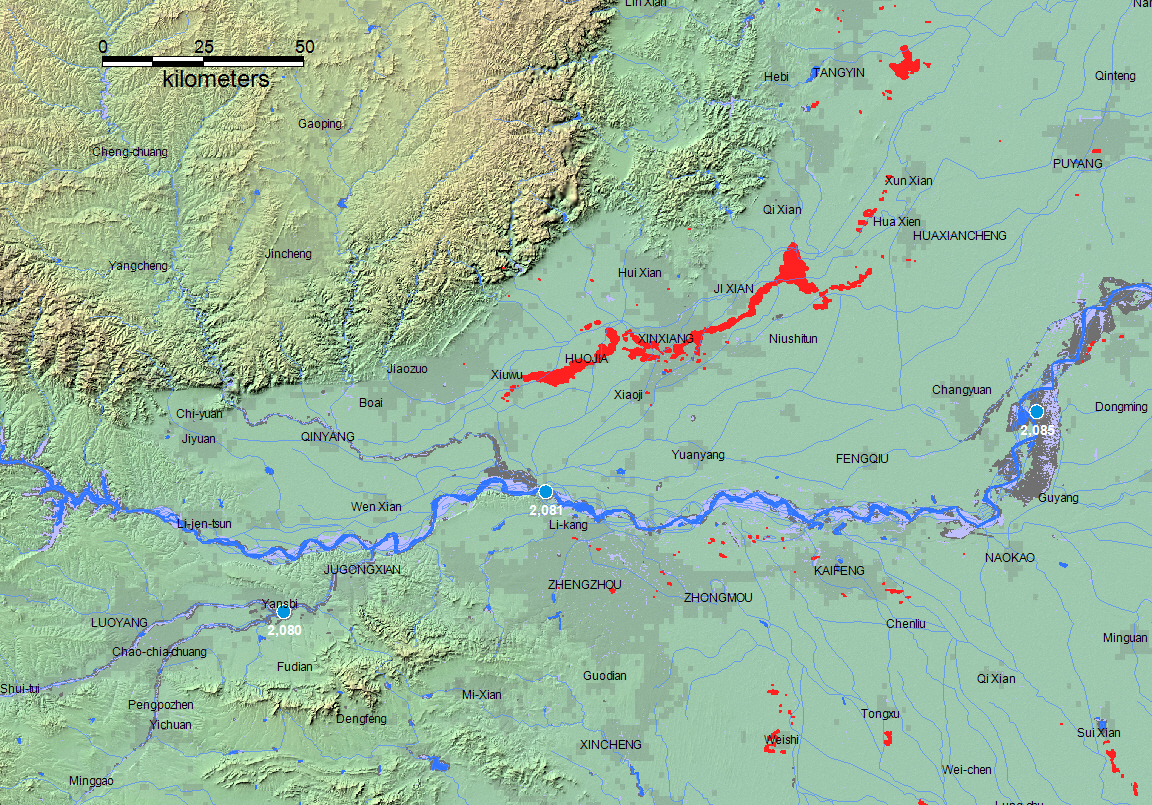
The Flood Observatory maintains a Global Active Archive of large flood events, 1985 to present. New major flood events are entered into this archive each week. A hand-drawn GIS polygon for each event outlines the region affected.
This event was selected for Observatory production of map and GIS data products.This web page and associated image and map (GIS) files become the permanent Flood Observatory record of the flood.
As part of collaborations with other organizations, including
GEO and the Global Flood
Partnership, the Observatory's maps are made available here to the public.
Geotif versions and GIS files are also available. With attribution, maps and
data can be used freely for non-commercial purposes. With permission, they can
be used for commercial purposes. Consult Robert.Brakenridge or Albert.Kettner (at
Colorado.edu) if questions. Attribution for this map when Sentinel SAR data are
used: "Dartmouth Flood Observatory at the University of Colorado, from satellite
data provided by NASA and Copernicus/European Space Agency". When using GIS data
(see below) provided to DFO from other sources, please acknowledge original
source.
NASA Landsat 8 and Copernicus/ESA Sentinel SAR data if used in this map were obtained from the the U.S. Geological Survey Hazards Data Distribution System. and the Sentinels Science Data hub, respectively. Landsat 8 is jointly managed by NASA and the United States Geological Survey. Copernicus is supported by the European Commission. MODIS data are obtained from the NASA NRT Global Flood Mapping facility (surface water extents) and from NASA Worldview (image files); SUOMI/VIIRS image data are also retrieved from NASA Worldview. Sentinel 1 SAR-based flood mapping is also contributed by Xinyi Shen and Qing Yang and the Rapid system at the University of Connecticut.
Flood extent files (Shp or Mapinfo) and geotif files supporting this Flood Event Map are located here.
These files may include high spatial resolution mapping such as from Sentinel or Landsat, or lower resolution files from MODIS. File names commonly include the sensor source (e.g., S1 for Sentinel 1, LS8 for Landsat, MODIS, Aqua, or Terra for MODIS) and the image date.
The NASA Earth Sciences Program, the Latin American Development Bank, the World Bank, the European Commission's Global Disaster Alert and Coordination System, GDACS, and Copernicus Emergency Management Service, the Google Earth Engine research awards program, the Committee on Earth Observation Satellites (CEOS) Disasters Working Group-Flood Pilot, the Japanese Space Agency, and the European Space Agency all have supported the Observatory's work via research grants and contracts or free satellite-derived data.
The Dartmouth Flood Observatory was founded in 1993 at Dartmouth College, Hanover, NH USA and moved to the University of Colorado, INSTAAR, CSDMS in 2010. The institutional support of both universities is gratefully acknowledged.
(counting since July 25, 2021)