
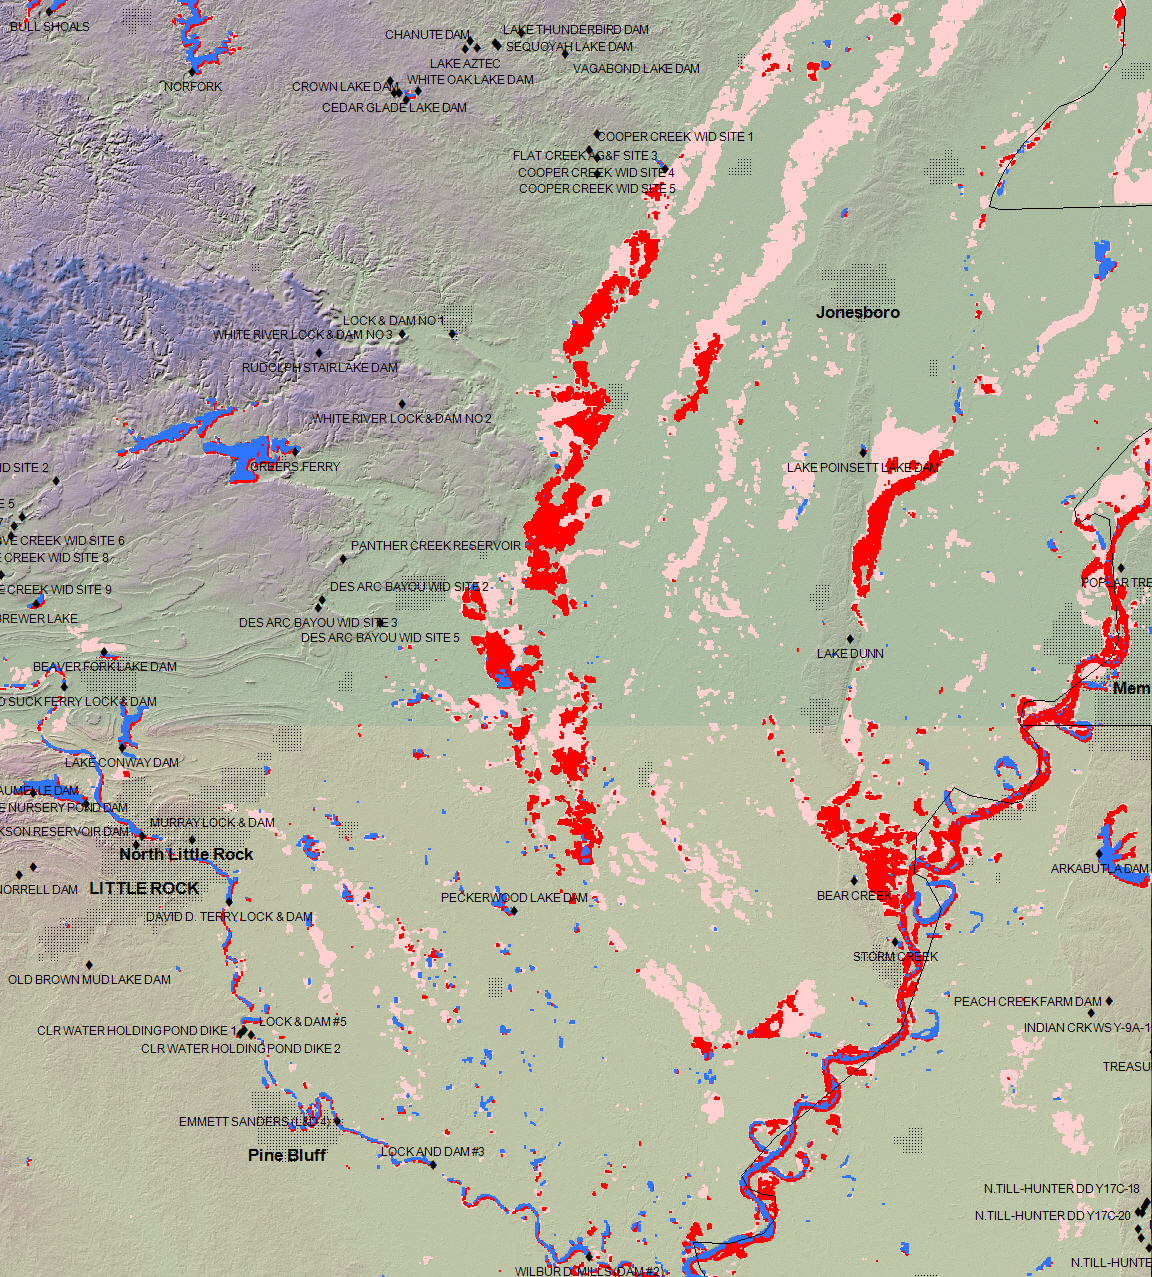
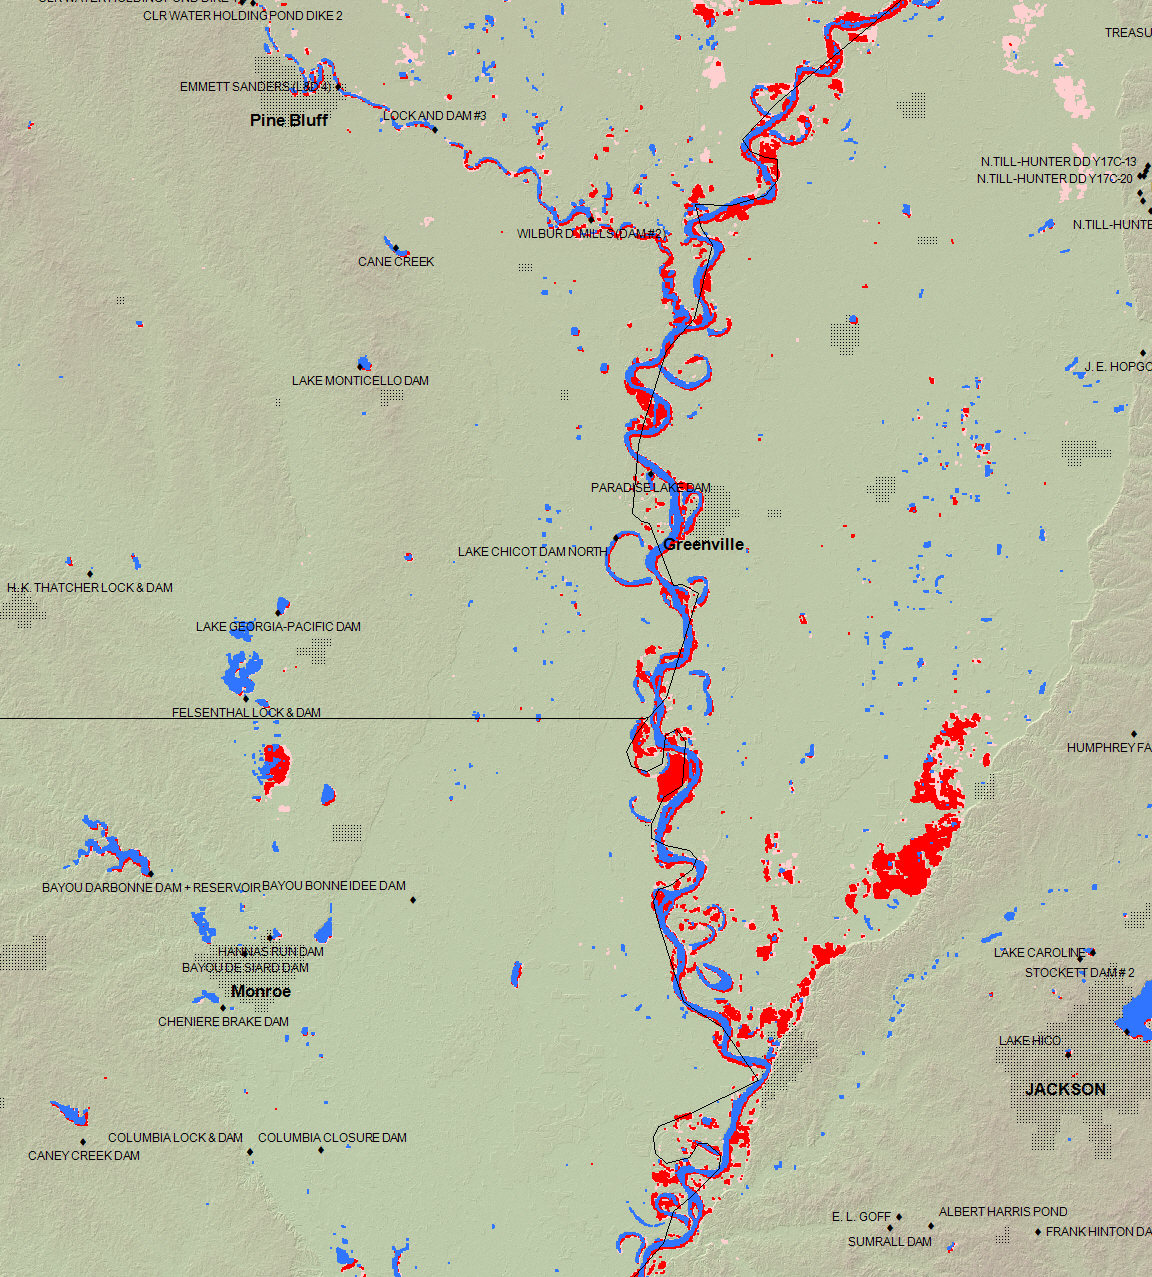
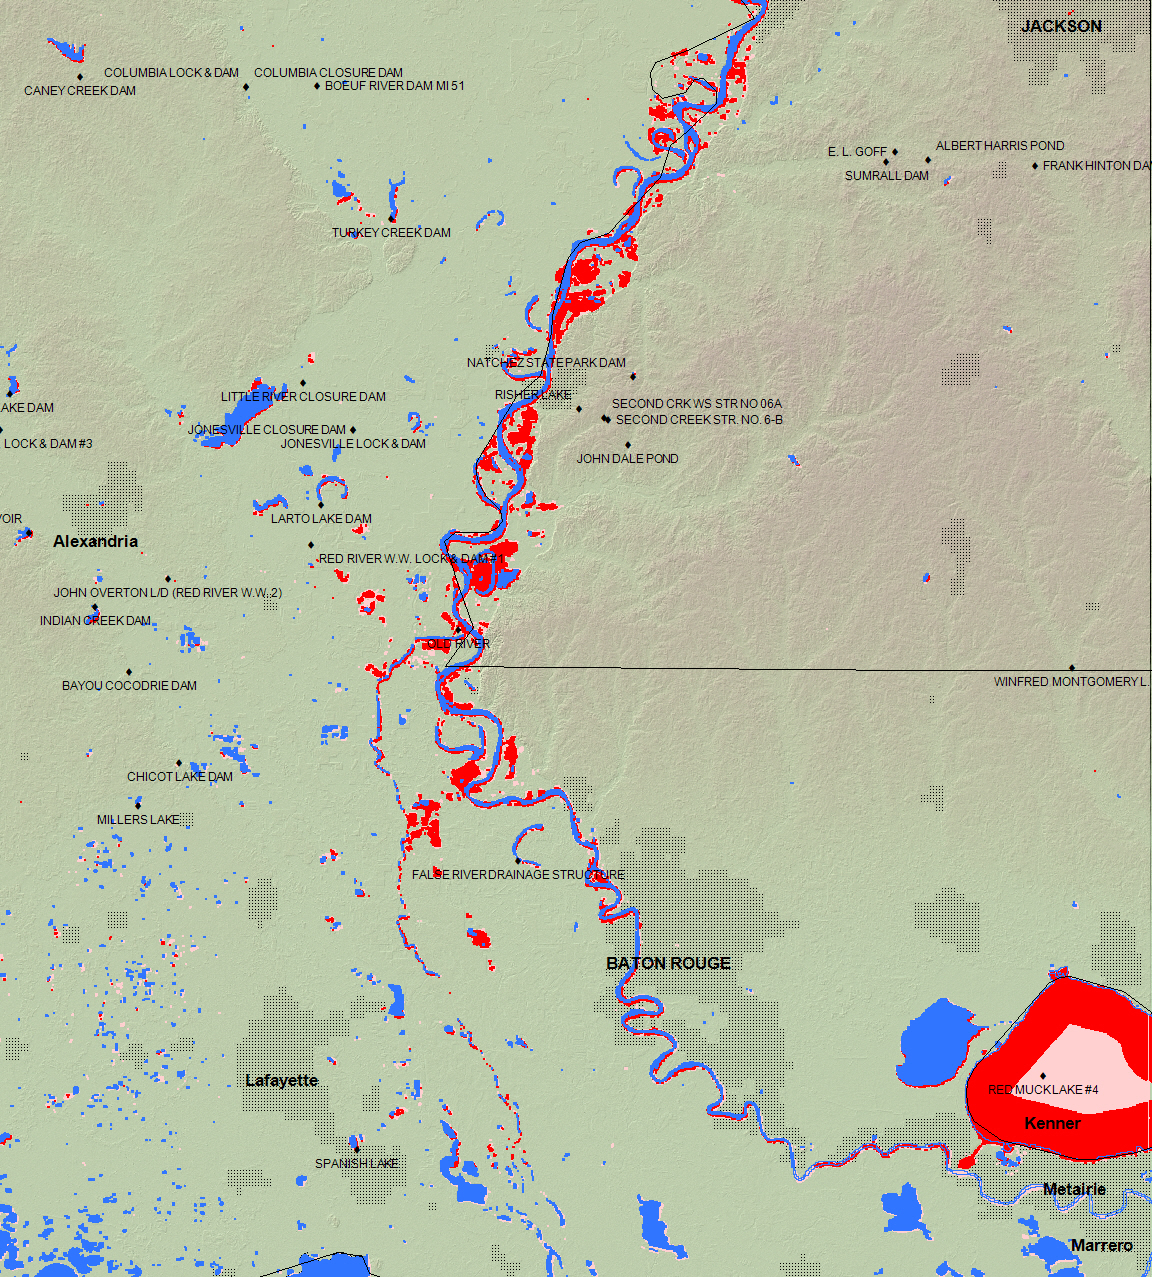
NASA-MODIS Rapid Response Record of 2011 Flooding, Mississippi and Atchafalaya rivers
(Three scenes, north to south, updated June 6, 2011)
(See also synoptic view, Cairo, Illinois south to the Gulf of Mexico)
Explanation
The above shows, in red, the extent of flooding as imaged on May 13-17, 2011 by the two MODIS sensors aboard Terra and Aqua. Dark blue illustrates "normal" surface water as imaged by MODIS prior to the flooding, and light red is flooding as imaged on May 6-12, 2011 but now dry.
The shaded relief background is from topography provided by NASA SRTM data.
NASA's MODIS sensors provide always-on coverage of the Earth's surface at a maximum spatial resolution of 250 m. Such remote sensing is often the first available after a major disaster and covers a very wide area twice daily. The follow-on sensor VIIRS, scheduled to be launched by 2013, will extend such valuable sensing capabilty.
MODIS band 1 and 2 data are processed to provide consistent water/land classification and boundaries. The data are then ingested into GIS (geographical information system) software. Output data products include map displays such as the above, but also the GIS water area outlines (in .shp and other standard formats). These can be accessed by end users in an ftp directory at http://csdms.colorado.edu/pub/flood_observatory/MODISlance.
These maps are online publications of the Dartmouth Flood Observatory, G. R. Brakenridge, A. Kettner, F. Policelli, and D. Slayback, 2011. Please cite the source.
Powerpoint time series of these maps: north, middle, and south.