
NASA-MODIS Record of 2011 Flooding, Lower and Middle Mississippi Basin, USA
Cairo, Illinois, south to the Gulf of Mexico, June 6, 2011
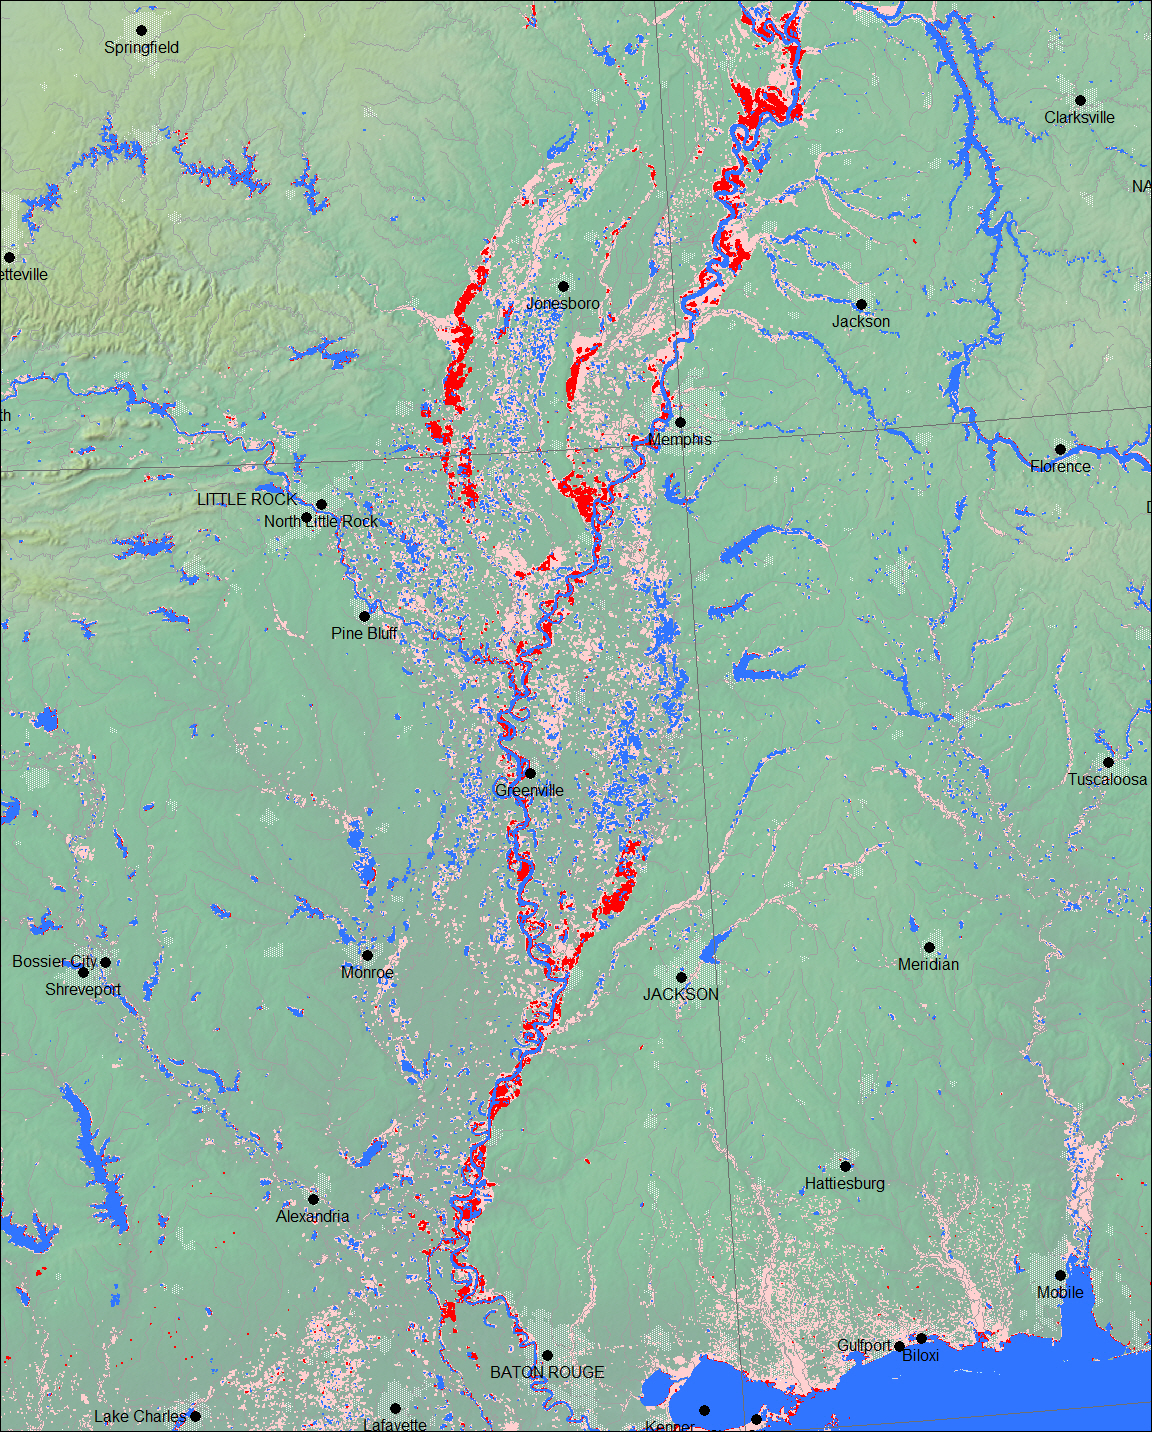
Explanation
The above shows, in red, the extent of flooding as imaged on May 17-22, 2011 by the two MODIS sensors aboard Terra and Aqua. Dark blue illustrates "normal" surface water as imaged by MODIS prior to the flooding, and light red is flooding as imaged during previous flood events mapped by remote sensing.
This map is an online publication of the Dartmouth Flood Observatory, G. R. Brakenridge, A. Kettner, F. Policelli, and D. Slayback, 2011. Please cite the source.
MODIS band 1 and 2 data are processed to provide consistent water/land classification and boundaries. The data are then ingested into GIS (geographical information system) software. Output data products include map displays such as the above, but also the GIS water area outlines (in .shp and other standard formats). These can be accessed by end users in an ftp directory at http://csdms.colorado.edu/pub/flood_observatory/MODISlance.