The Surface Water Record, Sheet W100N45, Flood Display
This display shows areas of expanded surface water during flooding, as well as the observed history of flooding commencing in the year 2000. See the Drought Display for areas of reduced surface water during times of drought.
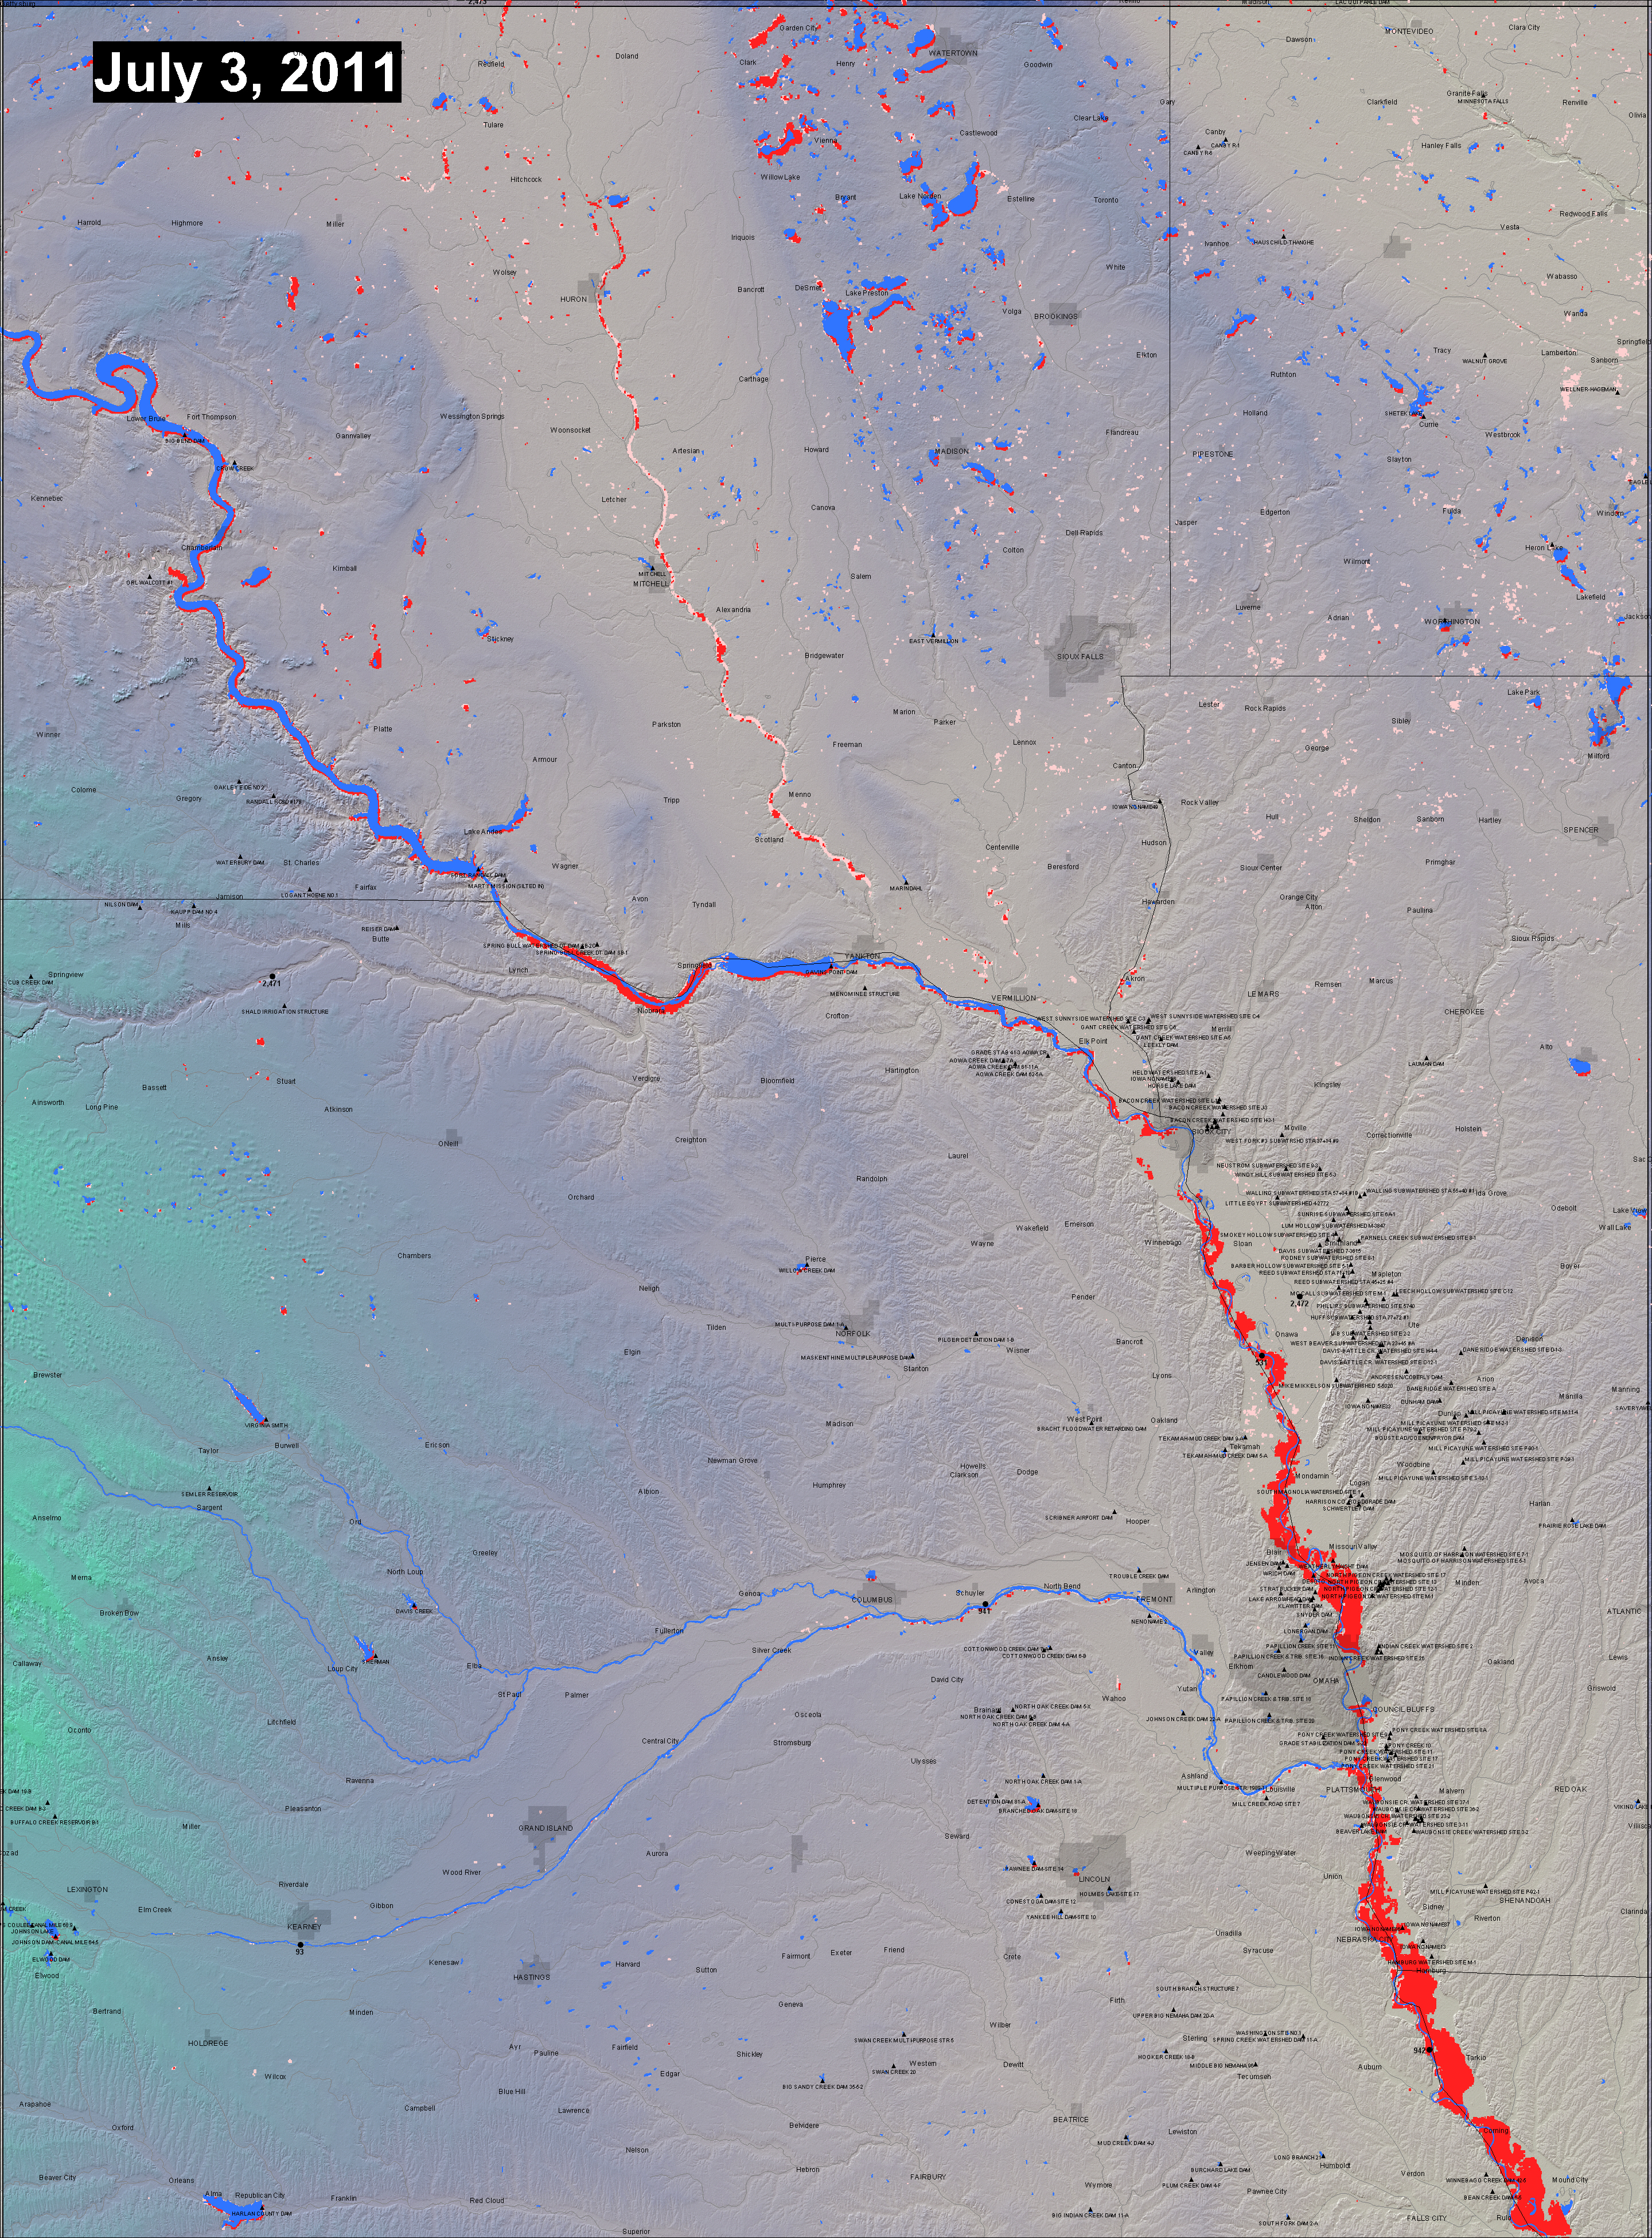
Shown in dark blue and red is the extent of current surface water as imaged by the two MODIS sensors aboard Terra and Aqua. Water areas are accumulated over 7 days to remove obscuration by cloud cover. Red indicates currently flooded land as compared to (dark blue) a reference date (February, 2000, from the Shuttle Radar Topography Mission Water Body dataset). During flooding, and as the extent of lakes, reservoirs, and rivers expand, red areas appear and increase in size.
Light red areas were flooded this year, prior to the update date, but are now dry land. Light blue area is all land observed to be inundated by flooding, 2000 to the present year (to be added from DFO records). This MODIS-based observational record may not include all floods: prior to 2011 such records were obtained manually and focus was only on selected major flood events. Clickable black dots link to the experimental AMSR-E river discharge estimates. See also the FAQ
The shaded relief background is from topography provided by NASA SRTM data. This map and raster image is in an unprojected latitude and longitude coordinate system, WGS84 datum, and spans exactly 5 degrees; the map sheet designation refers to the upper left corner. The map can be saved as a jpg file from your browser and ingested into GoogleEarth or GIS software by using the corner coordinates. For the most recent MODIS-based surface water information available, see the NASA NRT Experimental Flood Maps. Recent GIS data from the automated MODIS-LANCE NRT processor for this display are located at http://csdms.colorado.edu/pub/flood_observatory/MODISlance/
See also the technical description, and the history of weekly updates via powerpoint slides