The Surface Water Record, Sheet W100N45, Drought Display
This display shows reduced surface water. See the Flood Display for areas of expanded surface water.
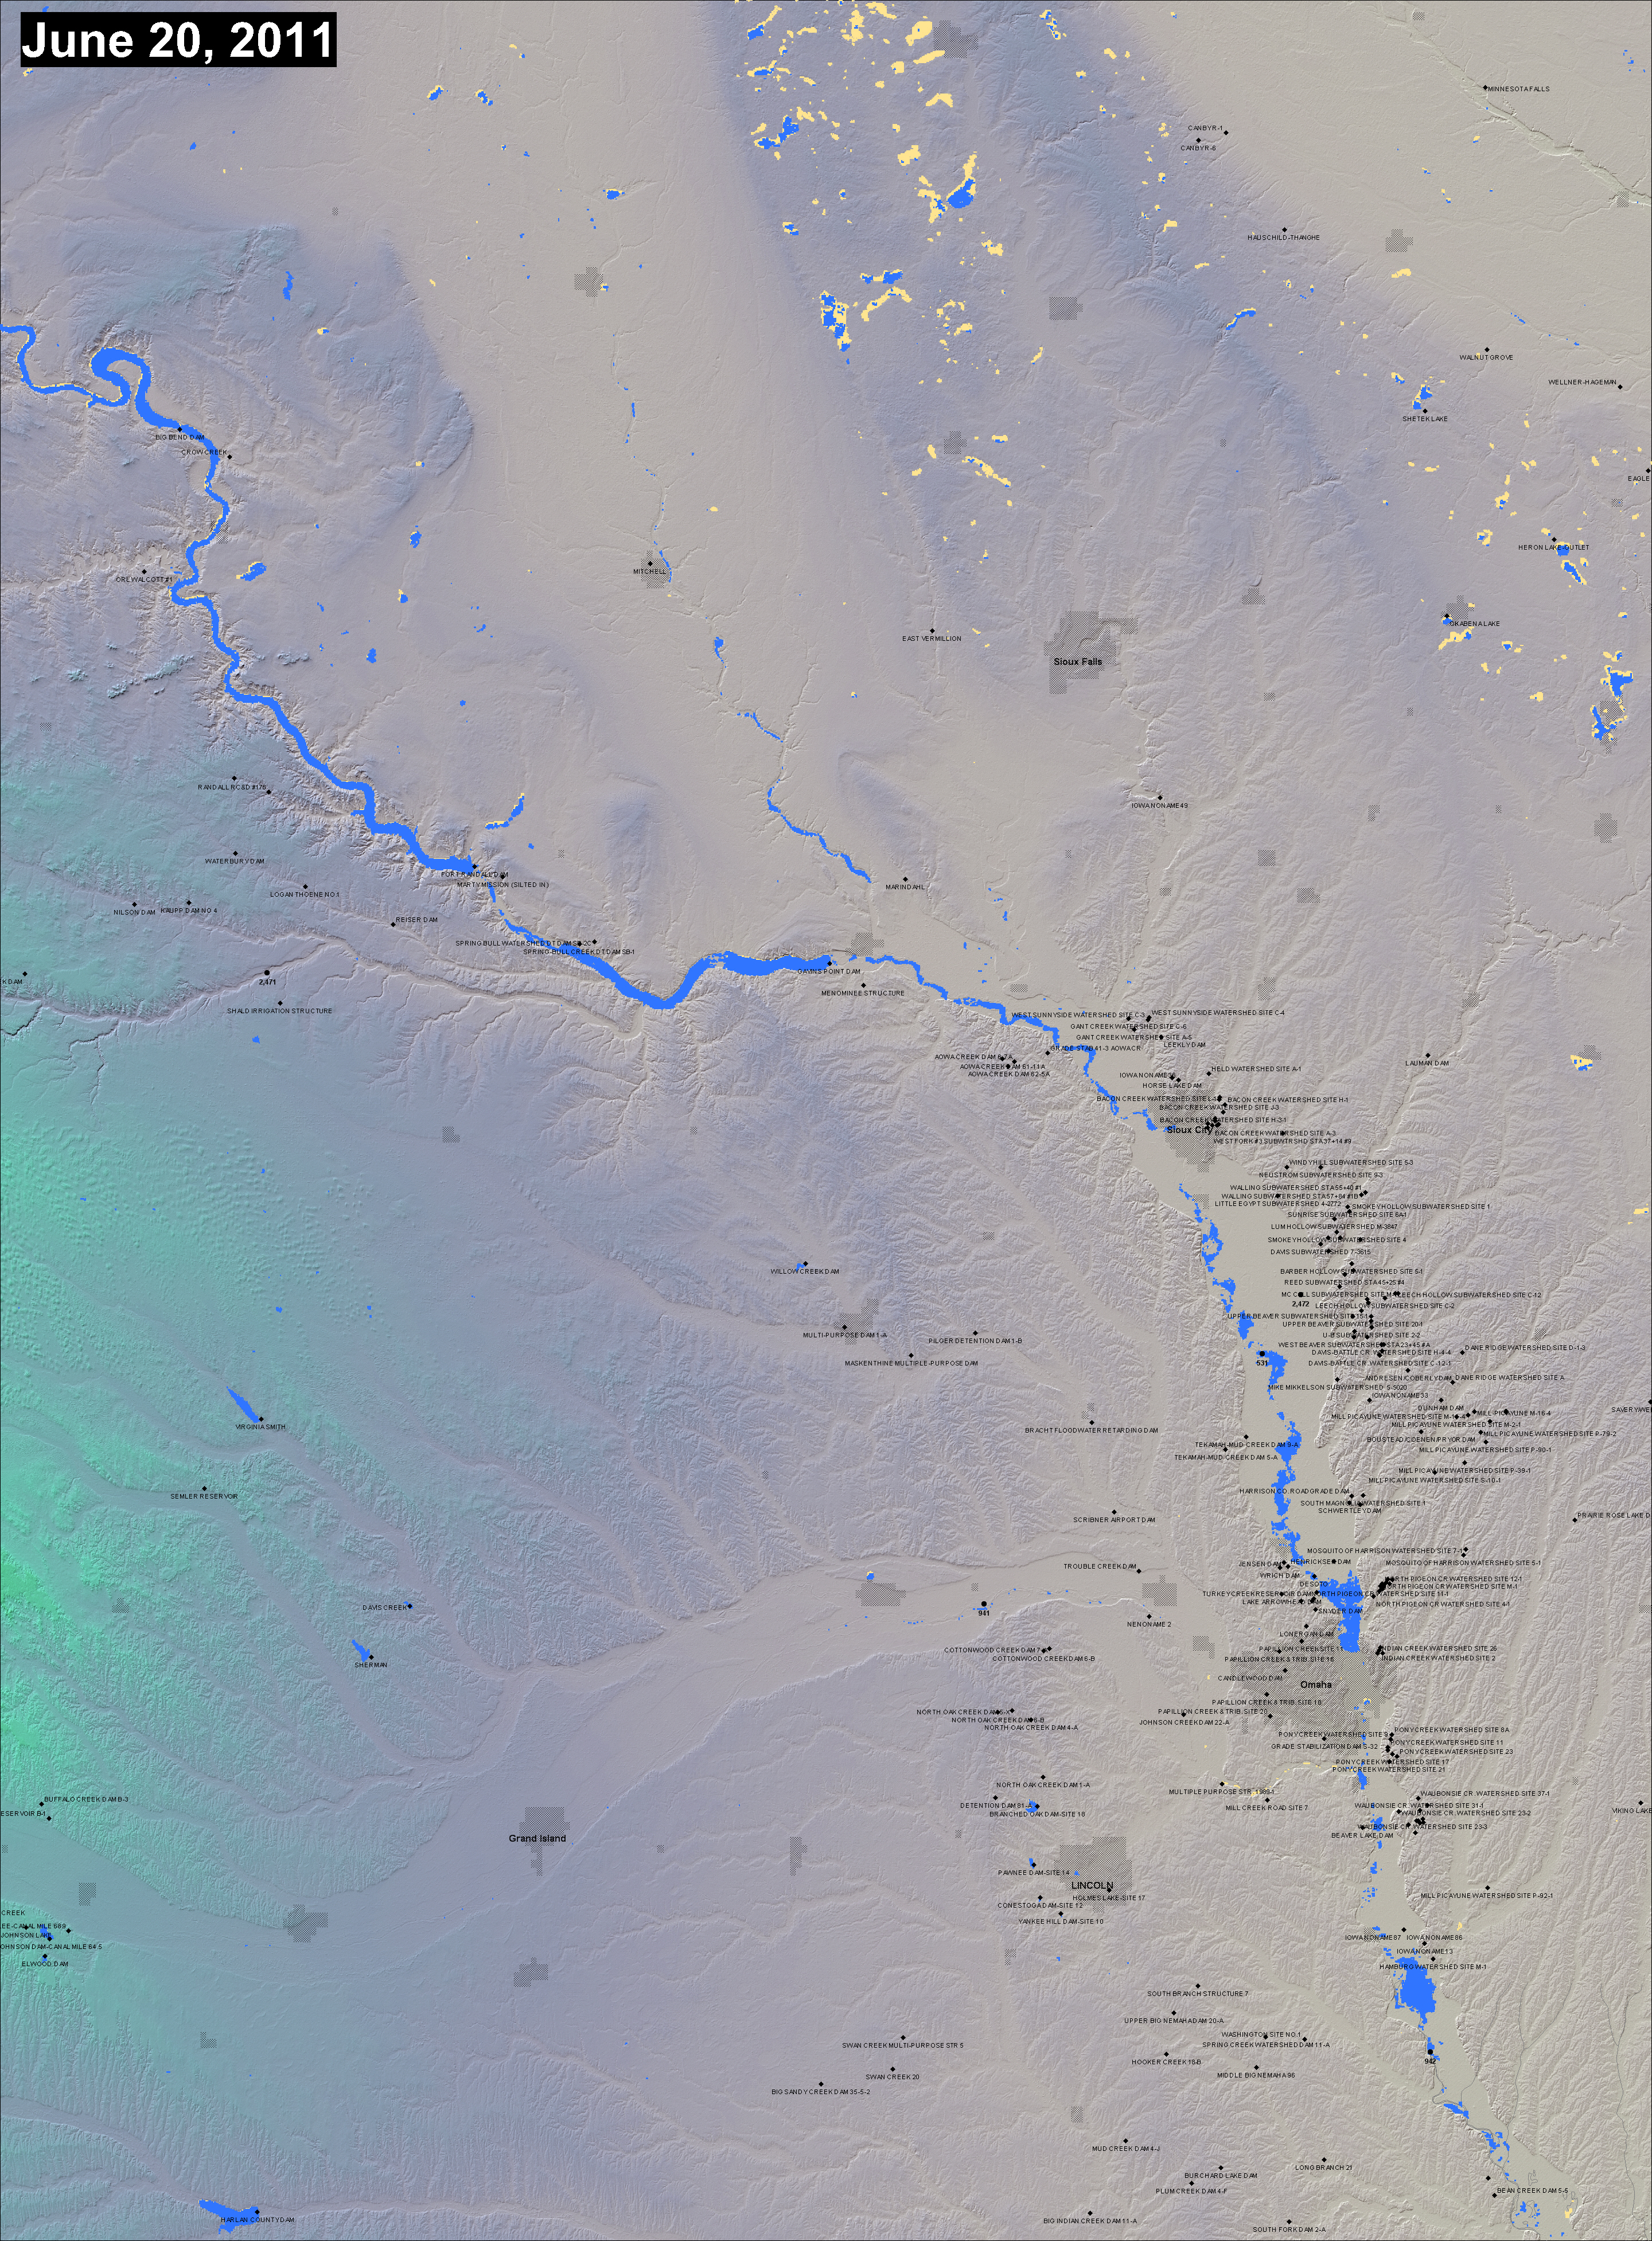
The map shows in dark blue the extent of current surface water as imaged by the two MODIS sensors aboard Terra and Aqua. Water areas are accumulated over 7 days to largely remove obscuration by cloud cover. Yellow-brown indicates new dry land compared to a reference date: March 2-23, 2009.
As water bodies contract, yellow-brown fringes around lakes, reservoirs, and rivers expand and may indicate drought conditions. Some isolated yellow-brown areas indicate water shrinkage to complete disappearance (at MODIS 250 m resolution). Surface water extent is only one expression of drought. For USA locations, see the Drought Monitor for comparison to other drought indicators. See also the FAQ.
The shaded relief background is from topography provided by NASA SRTM data. This map and raster image is in an unprojected latitude and longitude coordinate system, WGS84 datum, and spans exactly 5 degrees; the map sheet designation refers to the upper left corner. The map can be saved as a jpg file from your browser and ingested into GoogleEarth or GIS software by using the corner coordinates. For the most recent MODIS-based surface water information available, see the NASA NRT Experimental Flood Maps. Recent GIS data from the automated MODIS-LANCE NRT processor for this display are located at http://csdms.colorado.edu/pub/flood_observatory/MODISlance/
See also the technical description, and the history of weekly updates via powerpoint slides.