Discharge:Station 000024: Difference between revisions
From DFO – Flood Observatory
DFO Kettner (talk | contribs) Update discharge for AreaId=87 |
DFO Kettner (talk | contribs) Update discharge for AreaId=87 |
||
| Line 4: | Line 4: | ||
|Country=USA | |Country=USA | ||
|AreaId=87 | |AreaId=87 | ||
|LongTermDischarge=117. | |LongTermDischarge=117.1 | ||
|LastObservationDateDischarge= | |LastObservationDateDischarge=13-01-2026 | ||
|LastObservationDischarge= | |LastObservationDischarge=281.8 | ||
|DischargeFlowStatus=2 | |DischargeFlowStatus=2 | ||
|DischargeDataLink=https://csdms.colorado.edu/pub/flood_observatory/DFODischarge/87_discharge.csv | |DischargeDataLink=https://csdms.colorado.edu/pub/flood_observatory/DFODischarge/87_discharge.csv | ||
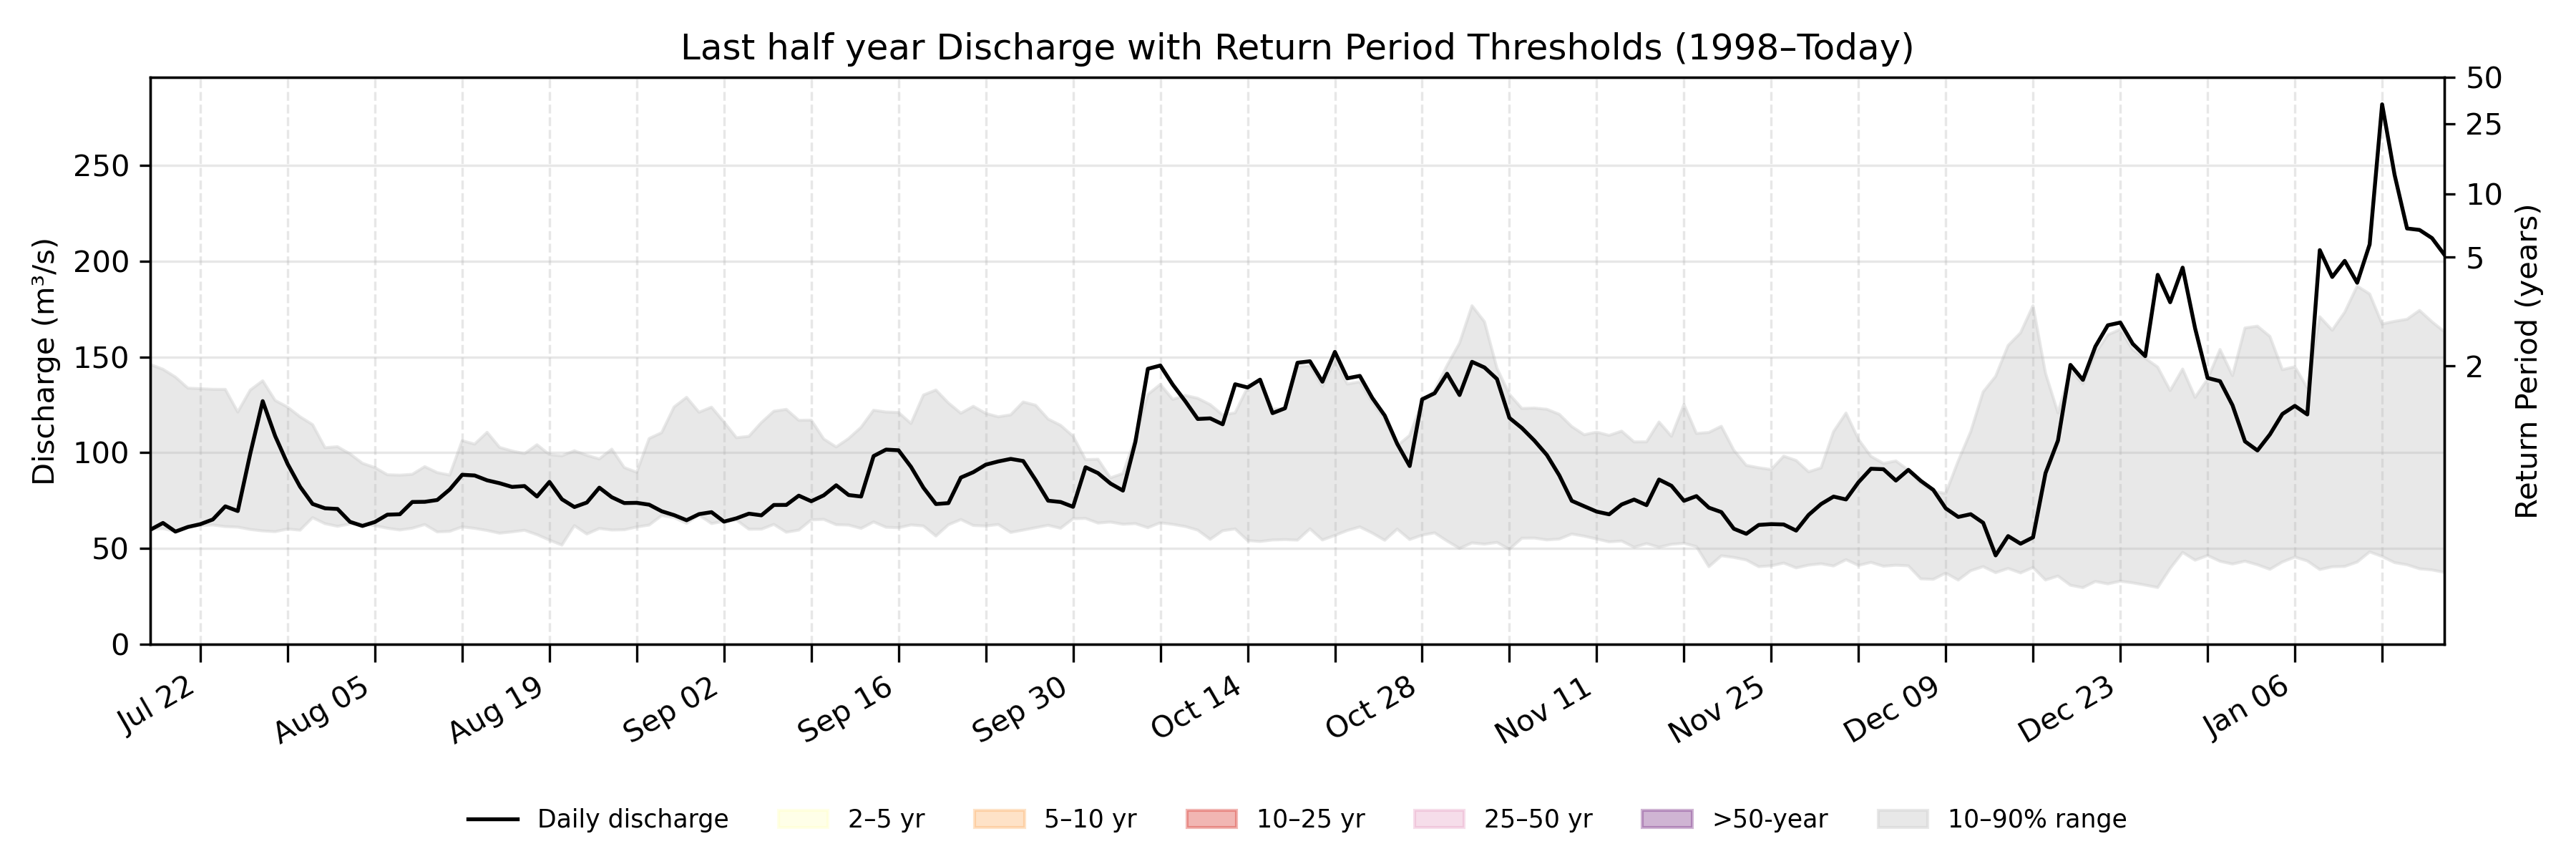
|DischargeDailySummary=On January | |DischargeDailySummary=On January 13, the historical discharge typically ranges from 45.8 m<sup>3</sup>/s to 167.2 m<sup>3</sup>/s (between the 10<sup>th</sup> and the 90<sup>th</sup> percentiles). Today's discharge is 281.8 m<sup>3</sup>/s. | ||
|DischargeCoordinatesPoint=48.5, -97.2 | |DischargeCoordinatesPoint=48.5, -97.2 | ||
|DischargeGEOJSONpoly= | |DischargeGEOJSONpoly= | ||
Revision as of 06:04, 13 January 2026
| River | Red |
| Country | USA |
| AreaId | 87 |
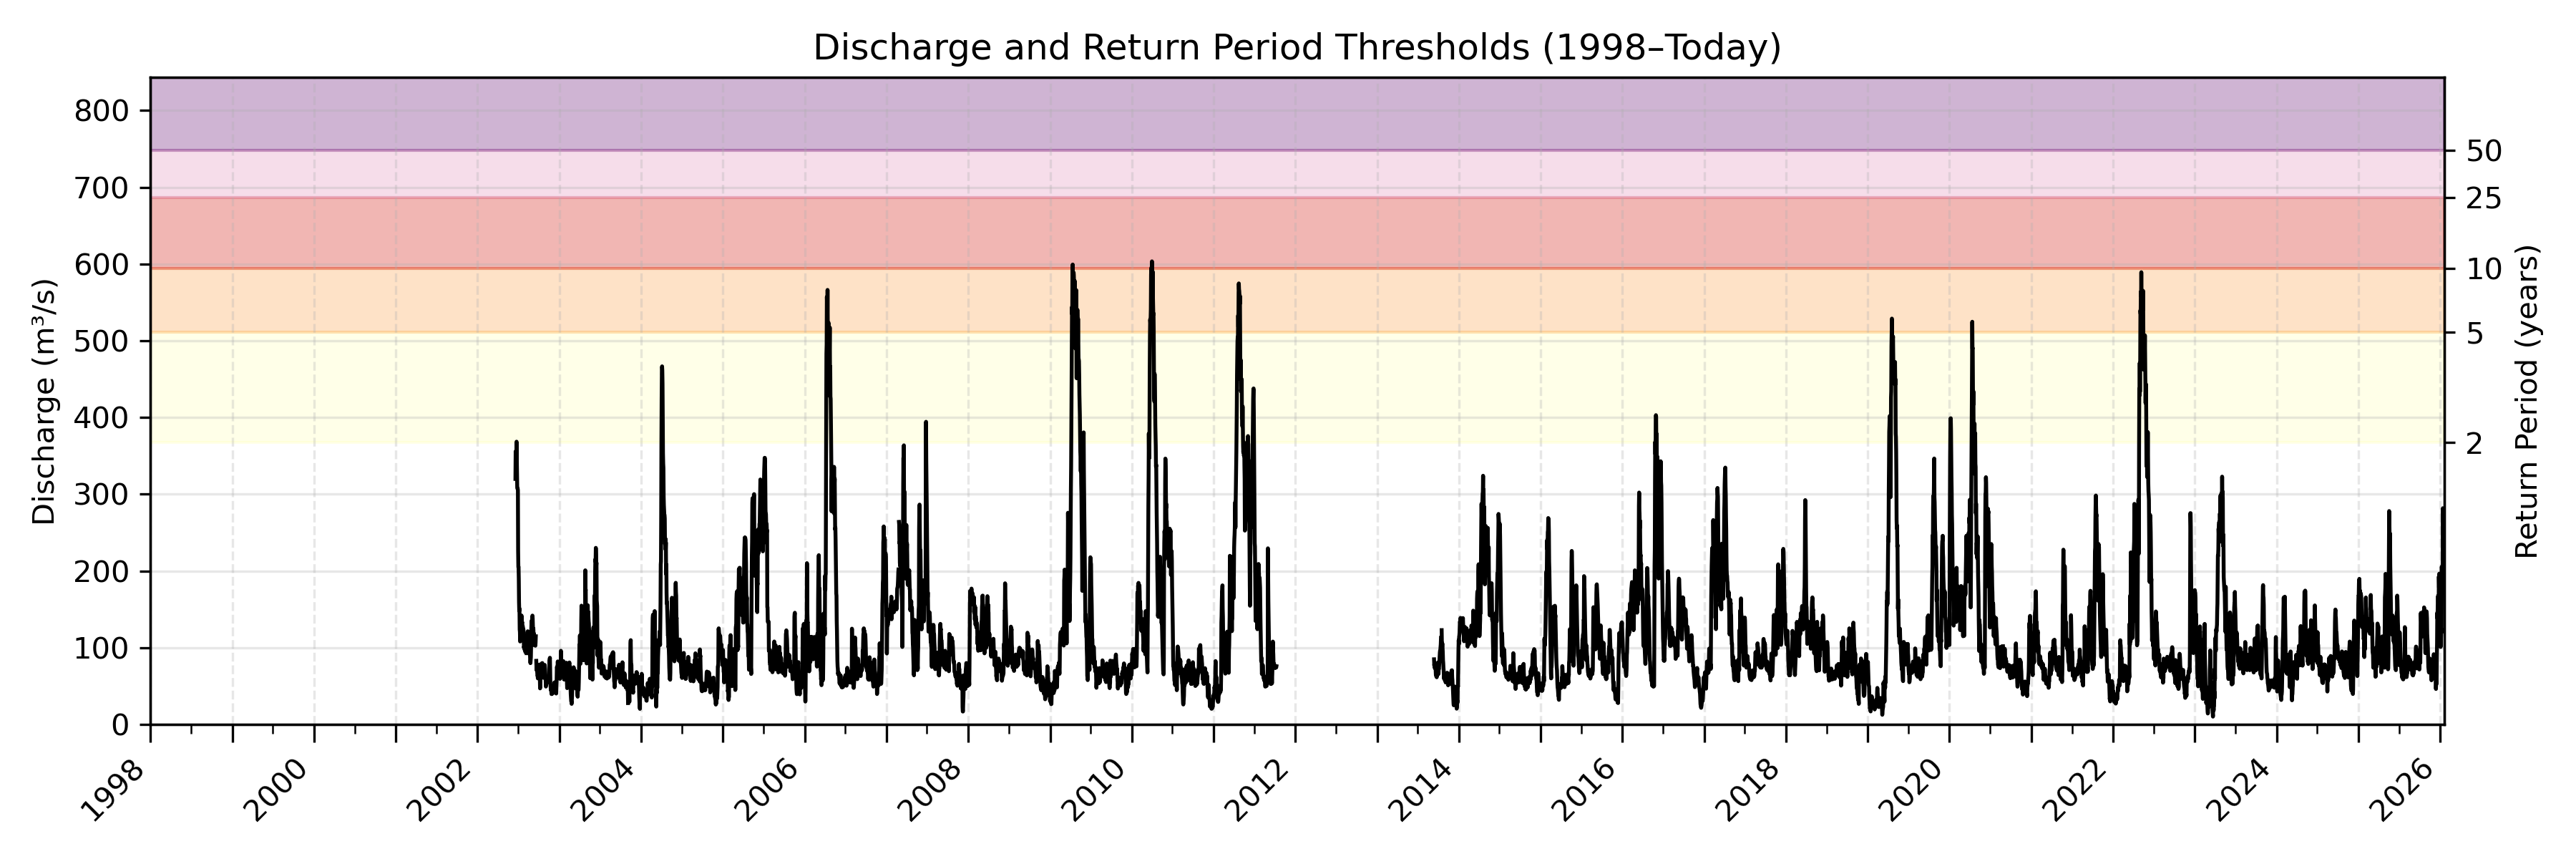
| LongTermDischarge | 117.1 m3/s |
| LastObservationDateDischarge | 13-01-2026 |
| LastObservationDischarge | 281.8 m3/s |
| DischargeFlowStatus | 2 |
| DischargeDataLink | download data |
| DischargeDailySummary | On January 13, the historical discharge typically ranges from 45.8 m3/s to 167.2 m3/s (between the 10th and the 90th percentiles). Today's discharge is 281.8 m3/s. |
| DischargeGEOJSONpoly | |
| DischargeNotes |
Location where discharge is determined.