Discharge:Station 000003: Difference between revisions
From DFO – Flood Observatory
DFO Kettner (talk | contribs) No edit summary Tag: Manual revert |
DFO Kettner (talk | contribs) No edit summary Tag: Reverted |
||
| Line 8: | Line 8: | ||
|LastObservationDischarge=1968.9 | |LastObservationDischarge=1968.9 | ||
|DischargeFlowStatus=2 | |DischargeFlowStatus=2 | ||
|DischargeDataLink=https://csdms.colorado.edu/pub/flood_observatory/DFODischarge/21_discharge.csv | |DischargeDataLink=[https://csdms.colorado.edu/pub/flood_observatory/DFODischarge/21_discharge.csv download data] | ||
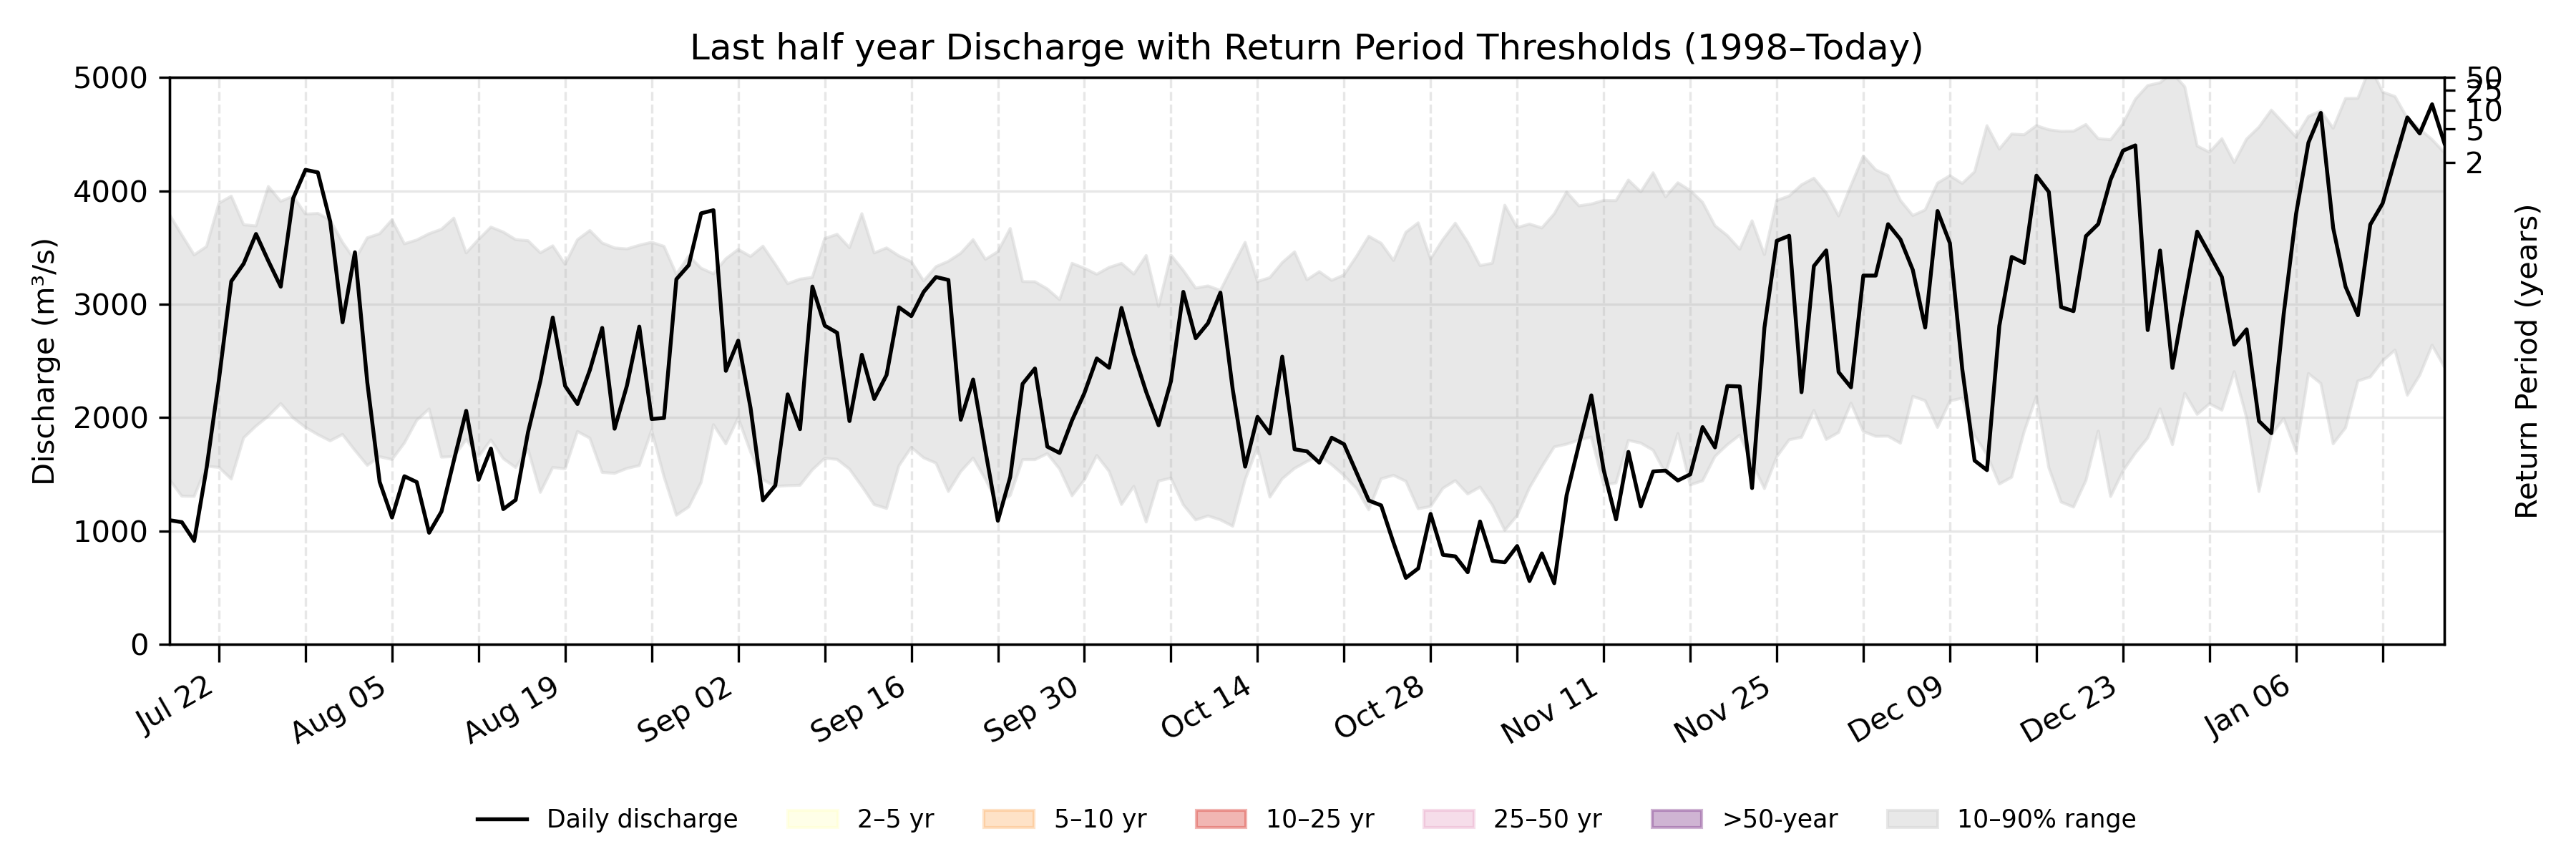
|DischargeDailySummary=On January 03, the historical discharge typically ranges from 1347.6 m<sup>3</sup>/s to 4563.2 m<sup>3</sup>/s (between the 10<sup>th</sup> and the 90<sup>th</sup> percentiles). Today's discharge is 1968.9 m<sup>3</sup>/s. | |DischargeDailySummary=On January 03, the historical discharge typically ranges from 1347.6 m<sup>3</sup>/s to 4563.2 m<sup>3</sup>/s (between the 10<sup>th</sup> and the 90<sup>th</sup> percentiles). Today's discharge is 1968.9 m<sup>3</sup>/s. | ||
|DischargeCoordinatesPoint=-13.0, -43.5 | |DischargeCoordinatesPoint=-13.0, -43.5 | ||
Revision as of 18:19, 4 January 2026
| River | Sao Francisco |
| Country | Brazil |
| AreaId | 21 |
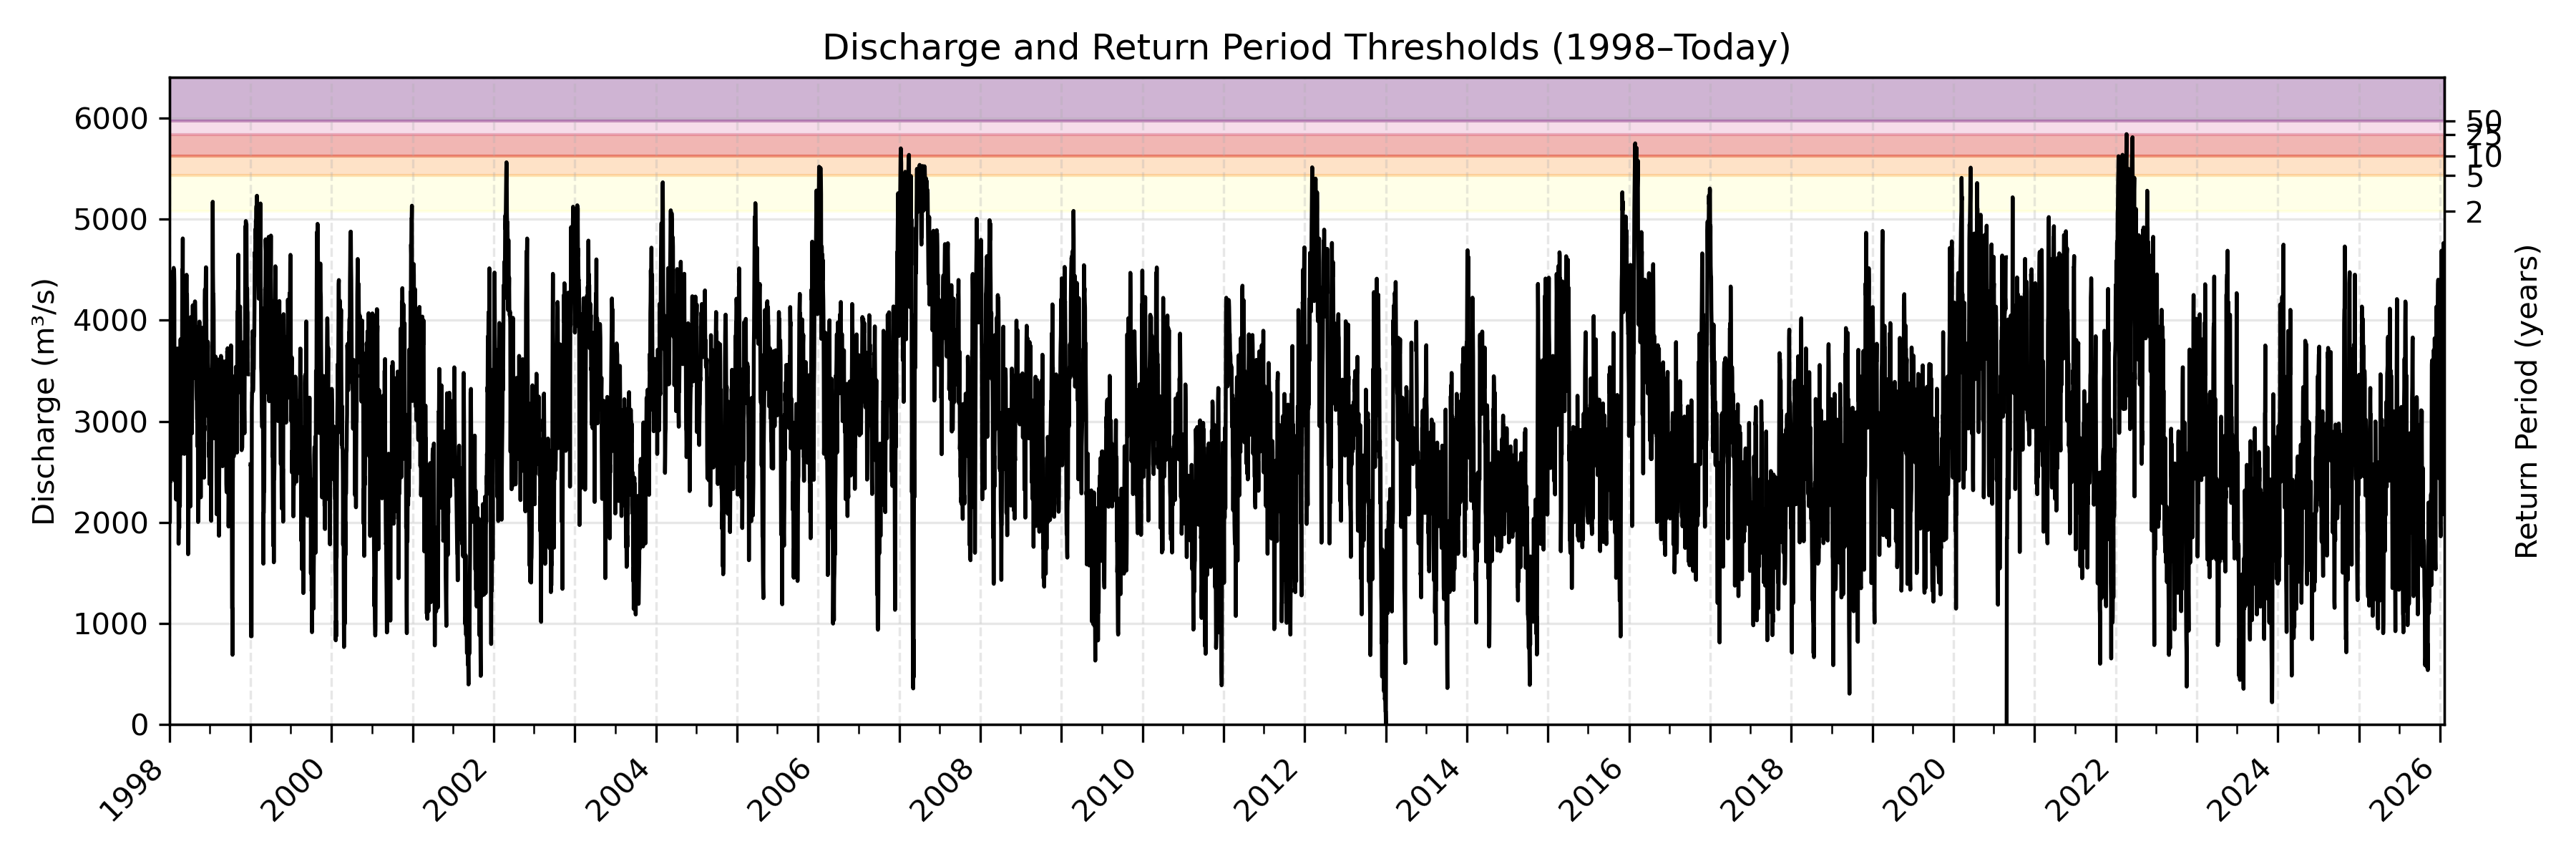
| LongTermDischarge | 2926.9 m3/s |
| LastObservationDateDischarge | 03-01-2026 |
| LastObservationDischarge | 1968.9 m3/s |
| DischargeFlowStatus | 2 |
| DischargeDataLink | [download data download data] |
| DischargeDailySummary | On January 03, the historical discharge typically ranges from 1347.6 m3/s to 4563.2 m3/s (between the 10th and the 90th percentiles). Today's discharge is 1968.9 m3/s. |
| DischargeGEOJSONpoly | |
| DischargeNotes |
Location where discharge is determined.