Discharge:Station 000018: Difference between revisions
From DFO – Flood Observatory
DFO Kettner (talk | contribs) Update discharge for AreaId=60 |
DFO Kettner (talk | contribs) Update discharge for AreaId=60 |
||
| Line 5: | Line 5: | ||
|AreaId=60 | |AreaId=60 | ||
|LongTermDischarge=317.8 | |LongTermDischarge=317.8 | ||
|LastObservationDateDischarge= | |LastObservationDateDischarge=22-12-2025 | ||
|LastObservationDischarge= | |LastObservationDischarge=142.7 | ||
|DischargeFlowStatus=2 | |DischargeFlowStatus=2 | ||
|DischargeDataLink=https://hallo.com | |DischargeDataLink=https://hallo.com | ||
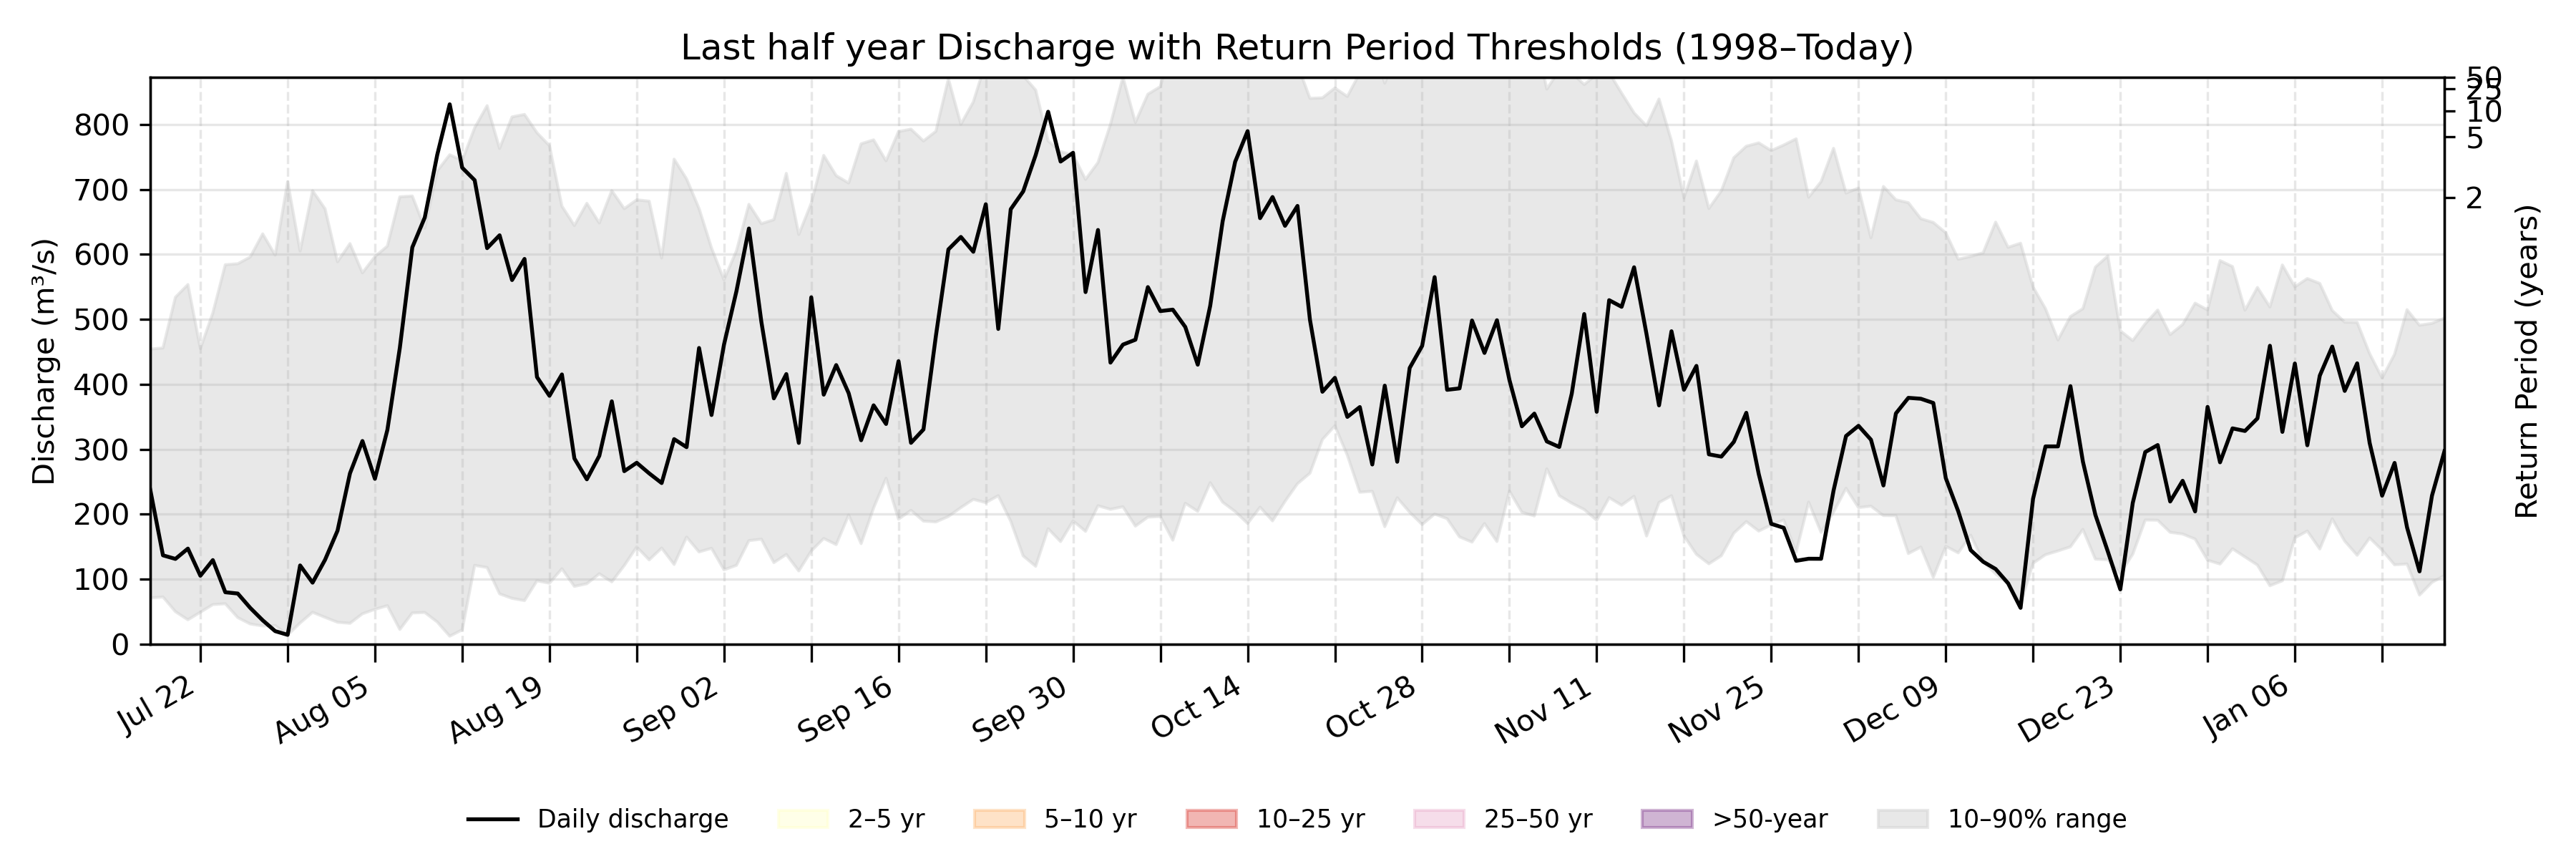
|DischargeDailySummary=On December | |DischargeDailySummary=On December 22, the historical discharge typically ranges from 130.0 m<sup>3</sup>/s to 597.4 m<sup>3</sup>/s (between the 10<sup>th</sup> and the 90<sup>th</sup> percentiles). Today's discharge is 142.7 m<sup>3</sup>/s. | ||
|DischargeCoordinatesPoint=17.9, -94.7 | |DischargeCoordinatesPoint=17.9, -94.7 | ||
|DischargeGEOJSONpoly= | |DischargeGEOJSONpoly= | ||
Revision as of 18:01, 22 December 2025
| River | Coatzacoalcos |
| Country | Mexico |
| AreaId | 60 |
| LongTermDischarge | 317.8 m3/s |
| LastObservationDateDischarge | 22-12-2025 |
| LastObservationDischarge | 142.7 m3/s |
| DischargeFlowStatus | 2 |
| DischargeDataLink | download data |
| DischargeDailySummary | On December 22, the historical discharge typically ranges from 130.0 m3/s to 597.4 m3/s (between the 10th and the 90th percentiles). Today's discharge is 142.7 m3/s. |
| DischargeGEOJSONpoly | |
| DischargeNotes |
Location where discharge is determined.