Discharge:Station 000034: Difference between revisions
From DFO – Flood Observatory
DFO Kettner (talk | contribs) Update discharge for AreaId=106 |
DFO Kettner (talk | contribs) Update discharge for AreaId=106 |
||
| (13 intermediate revisions by the same user not shown) | |||
| Line 5: | Line 5: | ||
|AreaId=106 | |AreaId=106 | ||
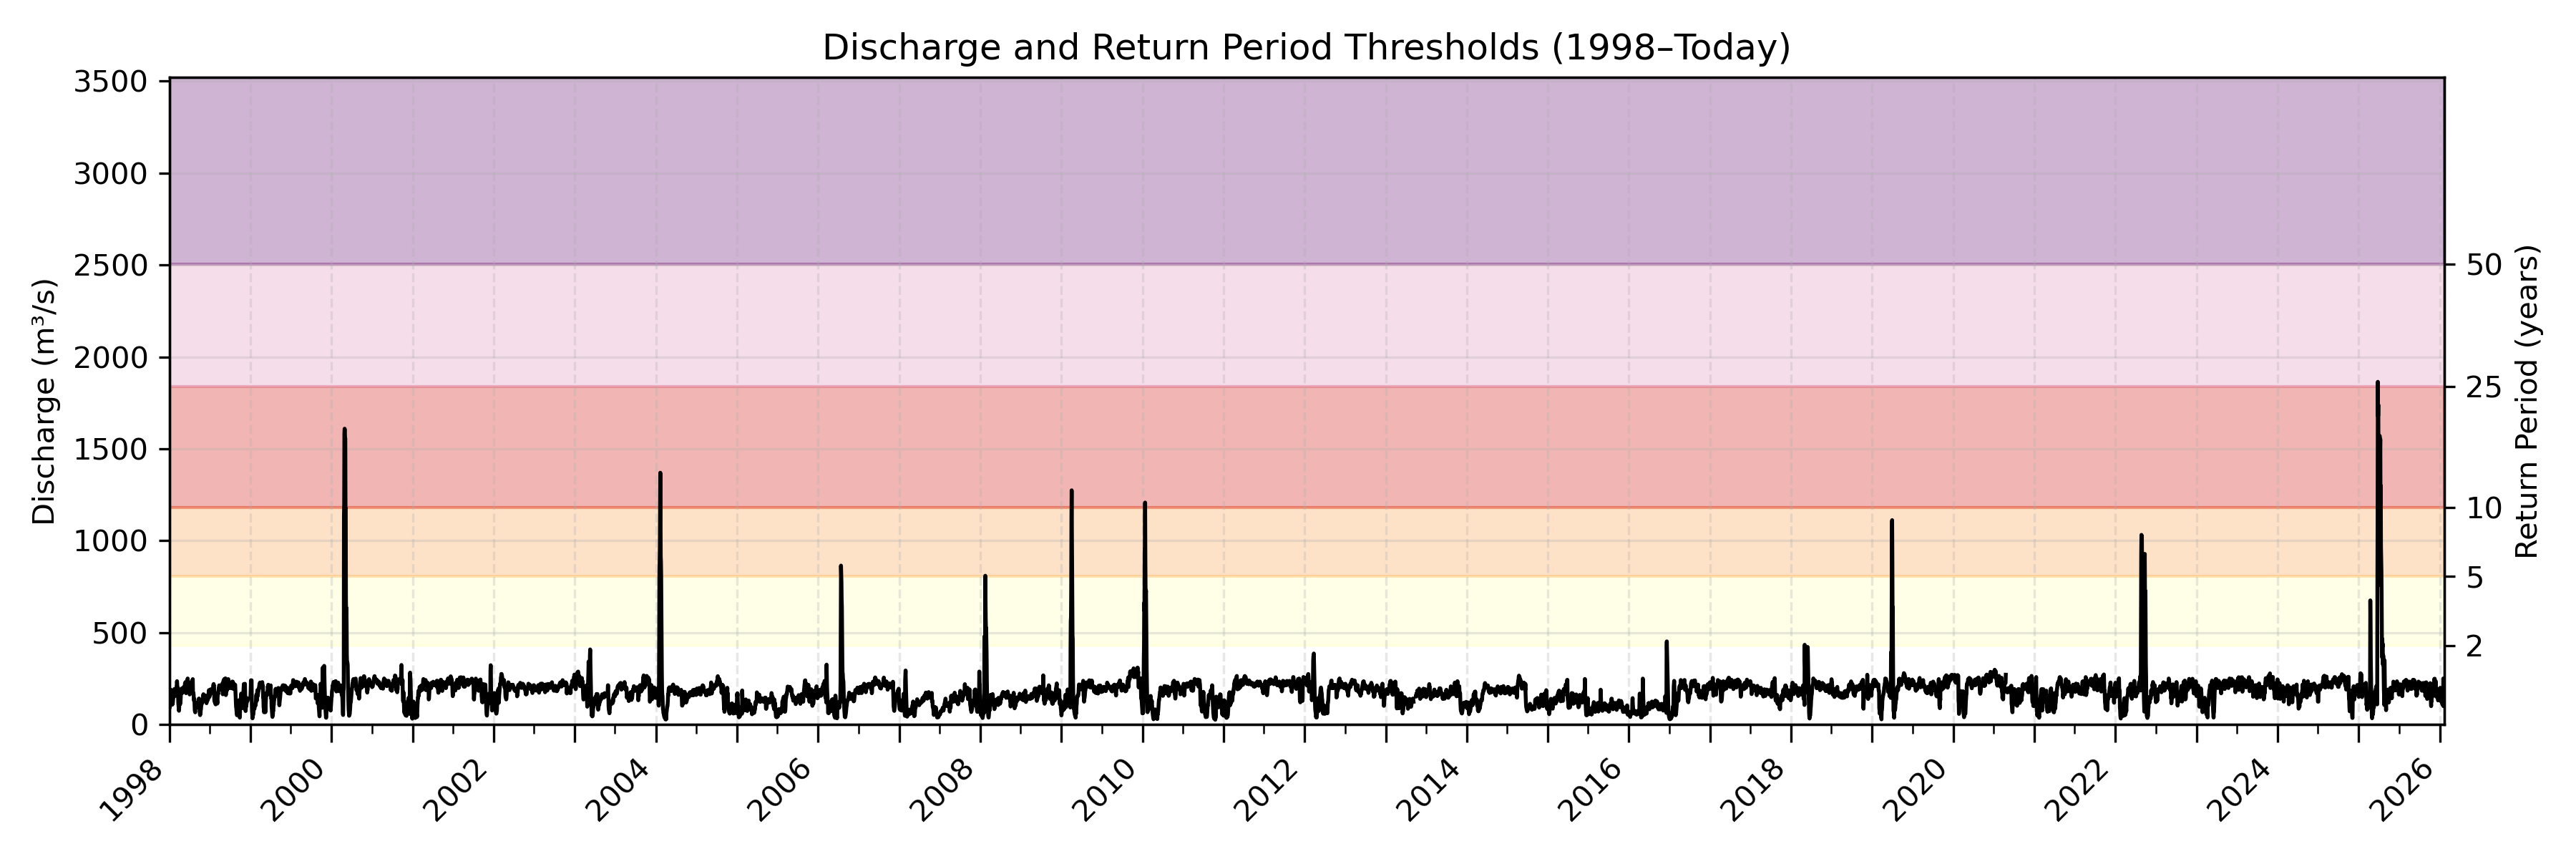
|LongTermDischarge=181.8 | |LongTermDischarge=181.8 | ||
|LastObservationDateDischarge= | |LastObservationDateDischarge=16-02-2026 | ||
|LastObservationDischarge= | |LastObservationDischarge=67.3 | ||
|DischargeFlowStatus=1 | |DischargeFlowStatus=1 | ||
|DischargeDataLink=https://csdms.colorado.edu/pub/flood_observatory/DFODischarge/106_discharge.csv | |DischargeDataLink=https://csdms.colorado.edu/pub/flood_observatory/DFODischarge/106_discharge.csv | ||
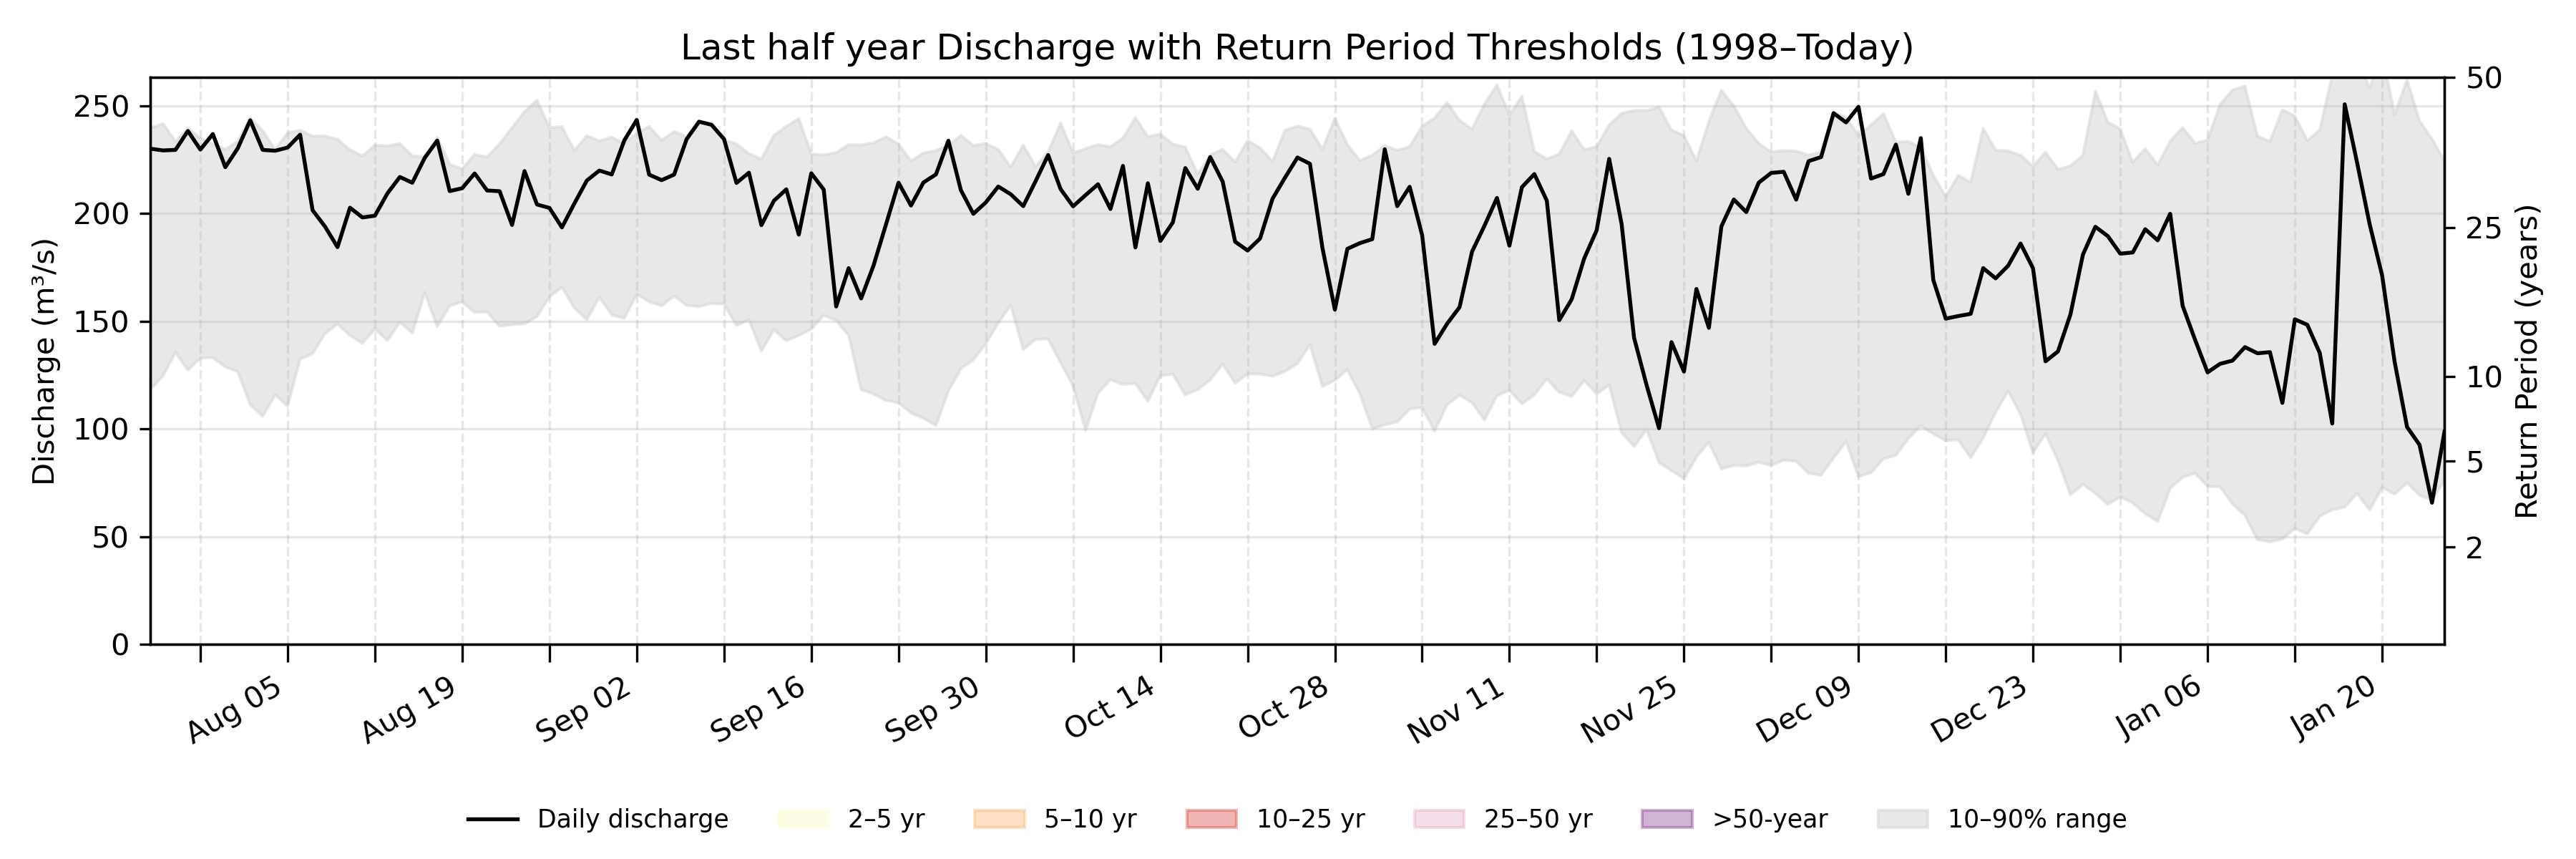
|DischargeDailySummary=On February | |DischargeDailySummary=On February 16, the historical discharge typically ranges from 64.9 m<sup>3</sup>/s to 215.8 m<sup>3</sup>/s (between the 10<sup>th</sup> and the 90<sup>th</sup> percentiles). Today's discharge is 67.3 m<sup>3</sup>/s. | ||
|DischargeCoordinatesPoint=-23.8, 143.7 | |DischargeCoordinatesPoint=-23.8, 143.7 | ||
|DischargeGEOJSONpoly= | |DischargeGEOJSONpoly= | ||
Latest revision as of 00:08, 16 February 2026
| River | Thomson |
| Country | Australia |
| AreaId | 106 |
| LongTermDischarge | 181.8 m3/s |
| LastObservationDateDischarge | 16-02-2026 |
| LastObservationDischarge | 67.3 m3/s |
| DischargeFlowStatus | 1 |
| DischargeDataLink | download data |
| DischargeDailySummary | On February 16, the historical discharge typically ranges from 64.9 m3/s to 215.8 m3/s (between the 10th and the 90th percentiles). Today's discharge is 67.3 m3/s. |
| DischargeGEOJSONpoly | |
| DischargeNotes |
Location where discharge is determined.