Lower Yangtze Surface Water Record.
This display shows areas of expanded surface water during recent flooding. It also provides the observed history of flooding, commencing in the year 2000. See the Drought Display for areas of reduced surface water during times of drought.
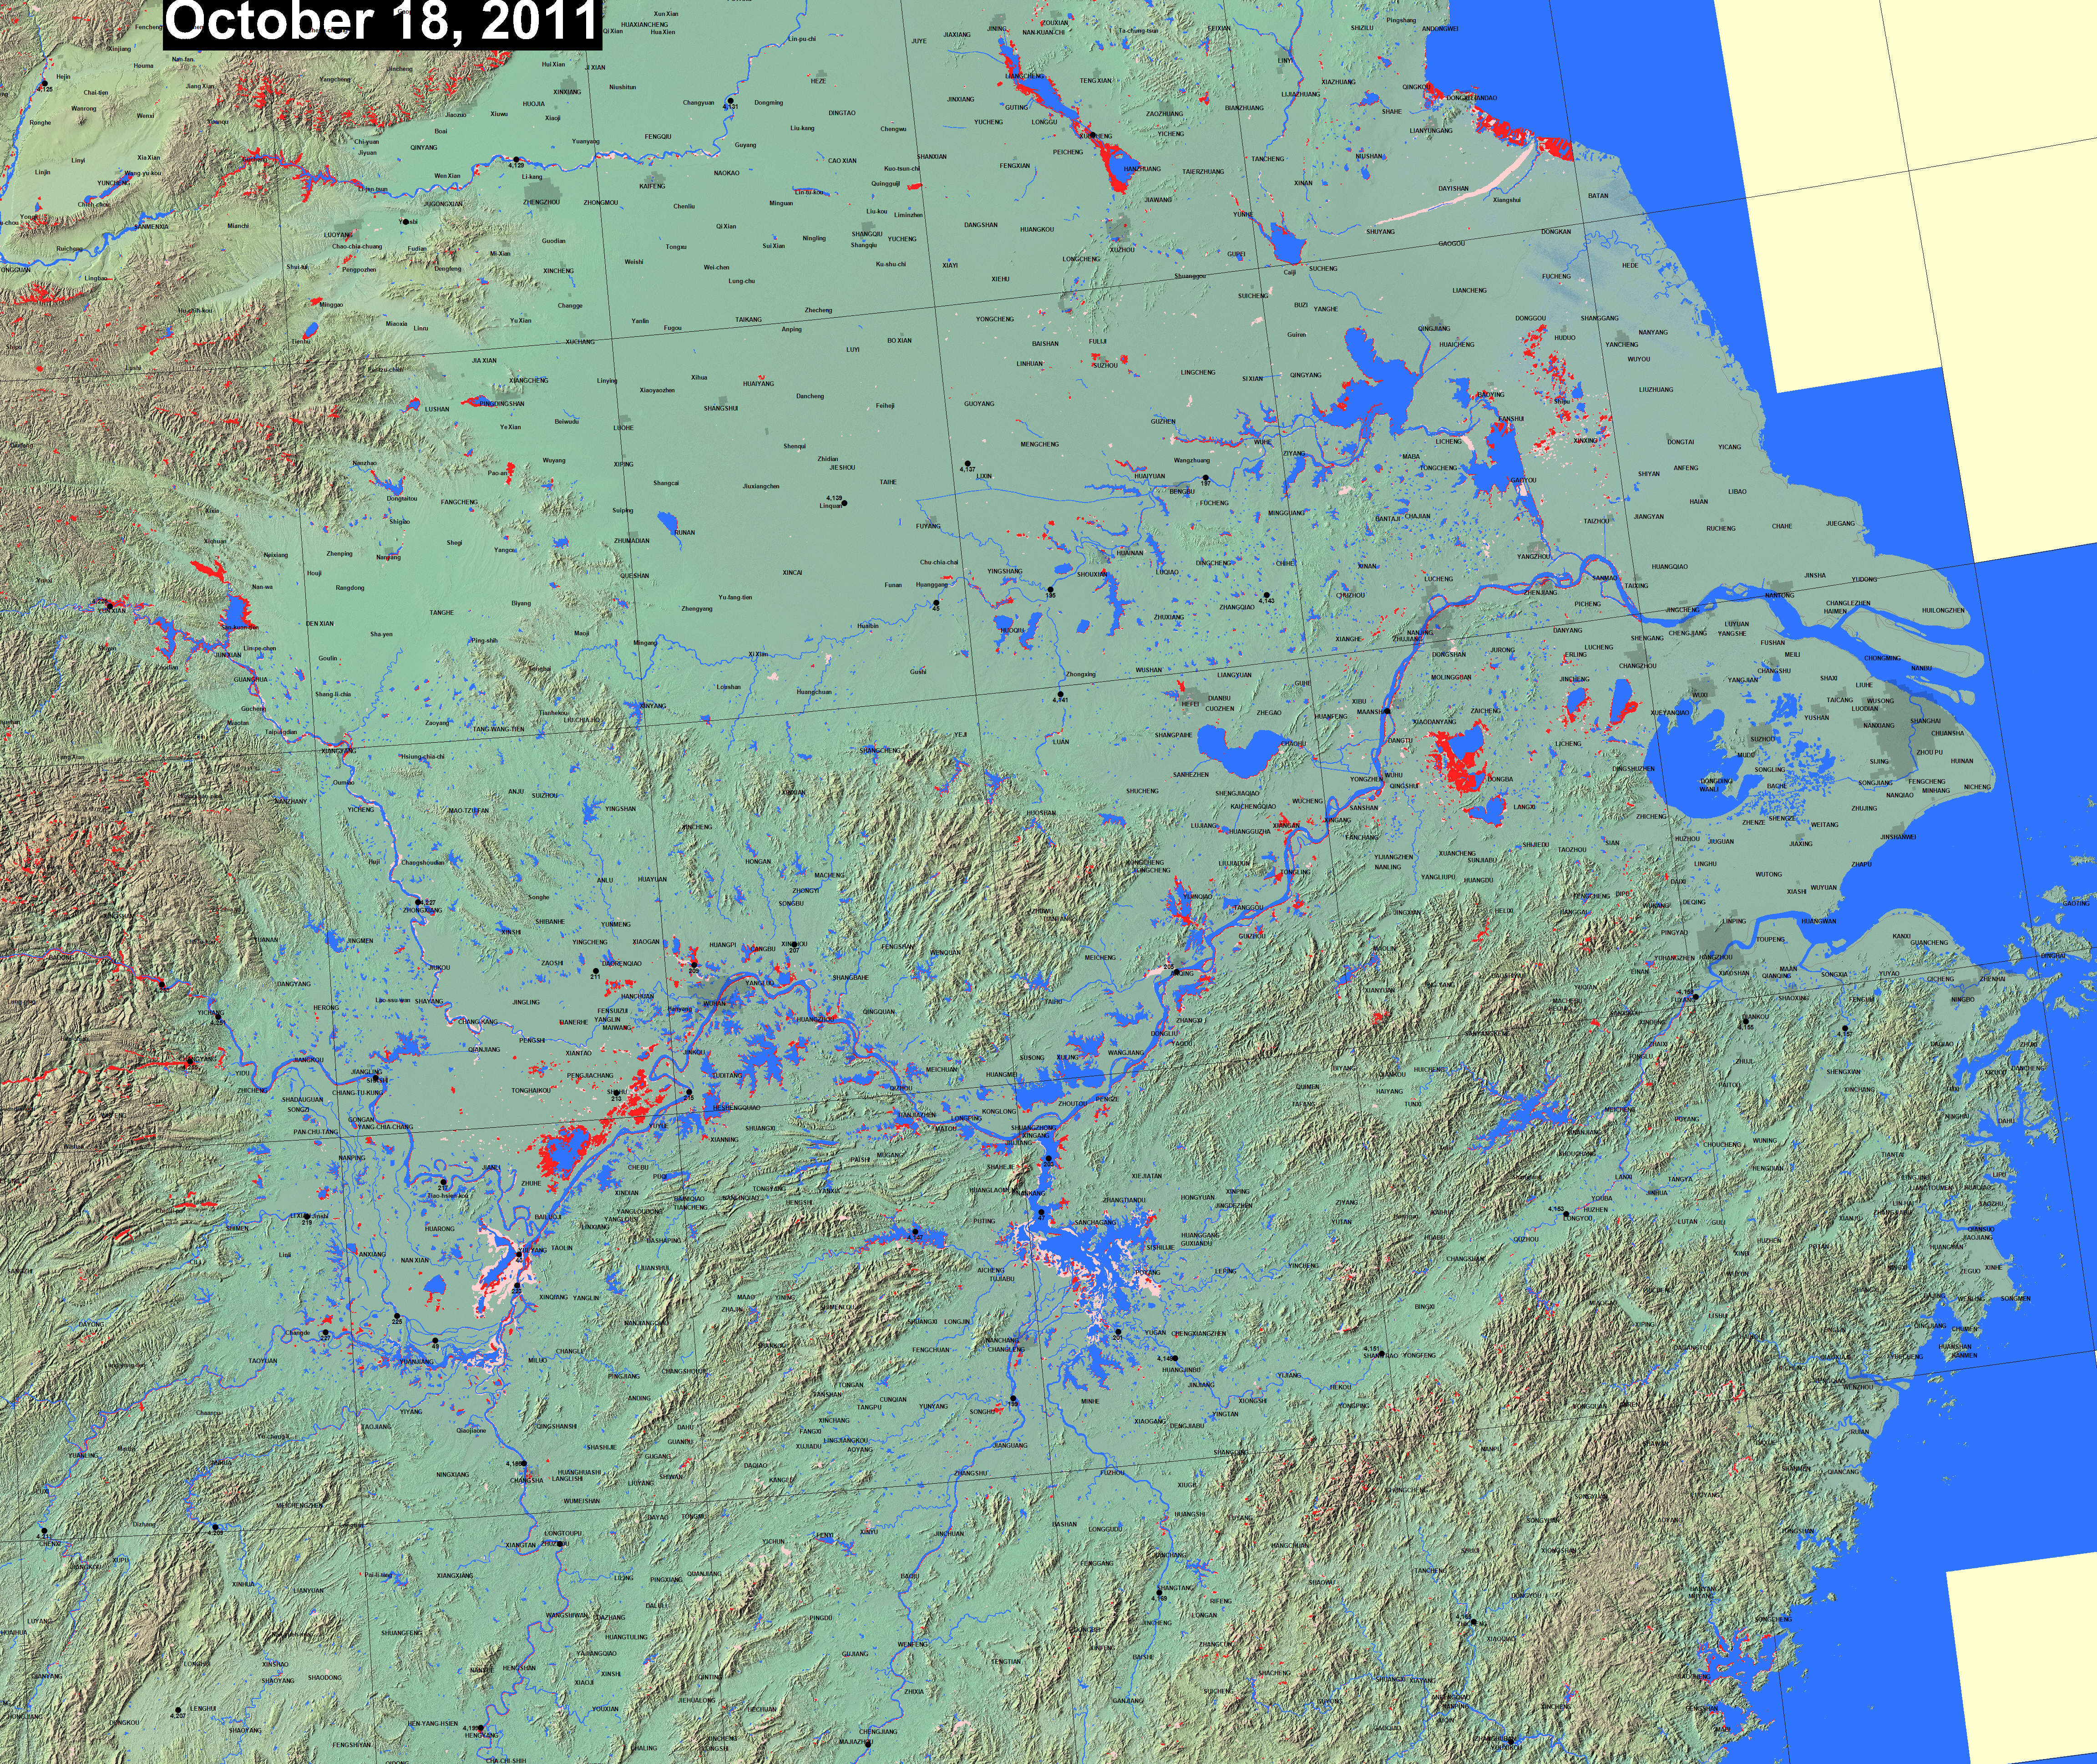
Dark blue and red together show the extent of current surface water as imaged by NASA's two MODIS sensors. Water areas are accumulated over 10 days to remove obscuration by cloud cover. Red indicates flooded land during this accumulation period (end date shown in display). Dark blue is the reference water (February, 2000, from the Shuttle Radar Topography Mission Water Body data). Light red is flooding mapped recently: in the current year. During flood events, and as the extent of lakes, reservoirs, and rivers expand, red areas appear and increase in size. As flooding wanes and floodplains dry, red transitions to light red and then (in the new year) to light blue.
Light blue areas include all land observed to be inundated by flooding, 2000 to the present year, using mainly the MODIS sensors but, in some cases, Radarsat, ASTER, or other higher spatial resolution data.
Error notes: 1) In mountainous regions, terrain shadows mimic surface water and are mis-classified as water in our current algorithm. We are working to reduce such noise. 2) Reservoirs/impoundments constructed since yr 2000 appear permanently in red. 3)The observational record illustrated may not include all floods: prior to 2011 the records were obtained manually and focus was on major flood events
Other information: See also the FAQ. Clickable black dots on these displays link to experimental AMSR-E river discharge sites and data. The shaded relief background is from topography provided by NASA SRTM data. For the most recent MODIS-based surface water available, see the NASA NRT Experimental Flood Maps. Recent GIS data (daily surface water information) from the automated MODIS-LANCE NRT processor are located at http://csdms.colorado.edu/pub/flood_observatory/MODISlance/ . GIS data (MapInfo format) of the long term record of flooding are also available: at this location. Finally, see the technical description, and the history of display updates via powerpoint slides.