Lower Yangtze Surface Water Record-Drought.
This display shows areas of reduced surface water during during times of drought. See the Flood Display for areas of expanded surface water during floods.
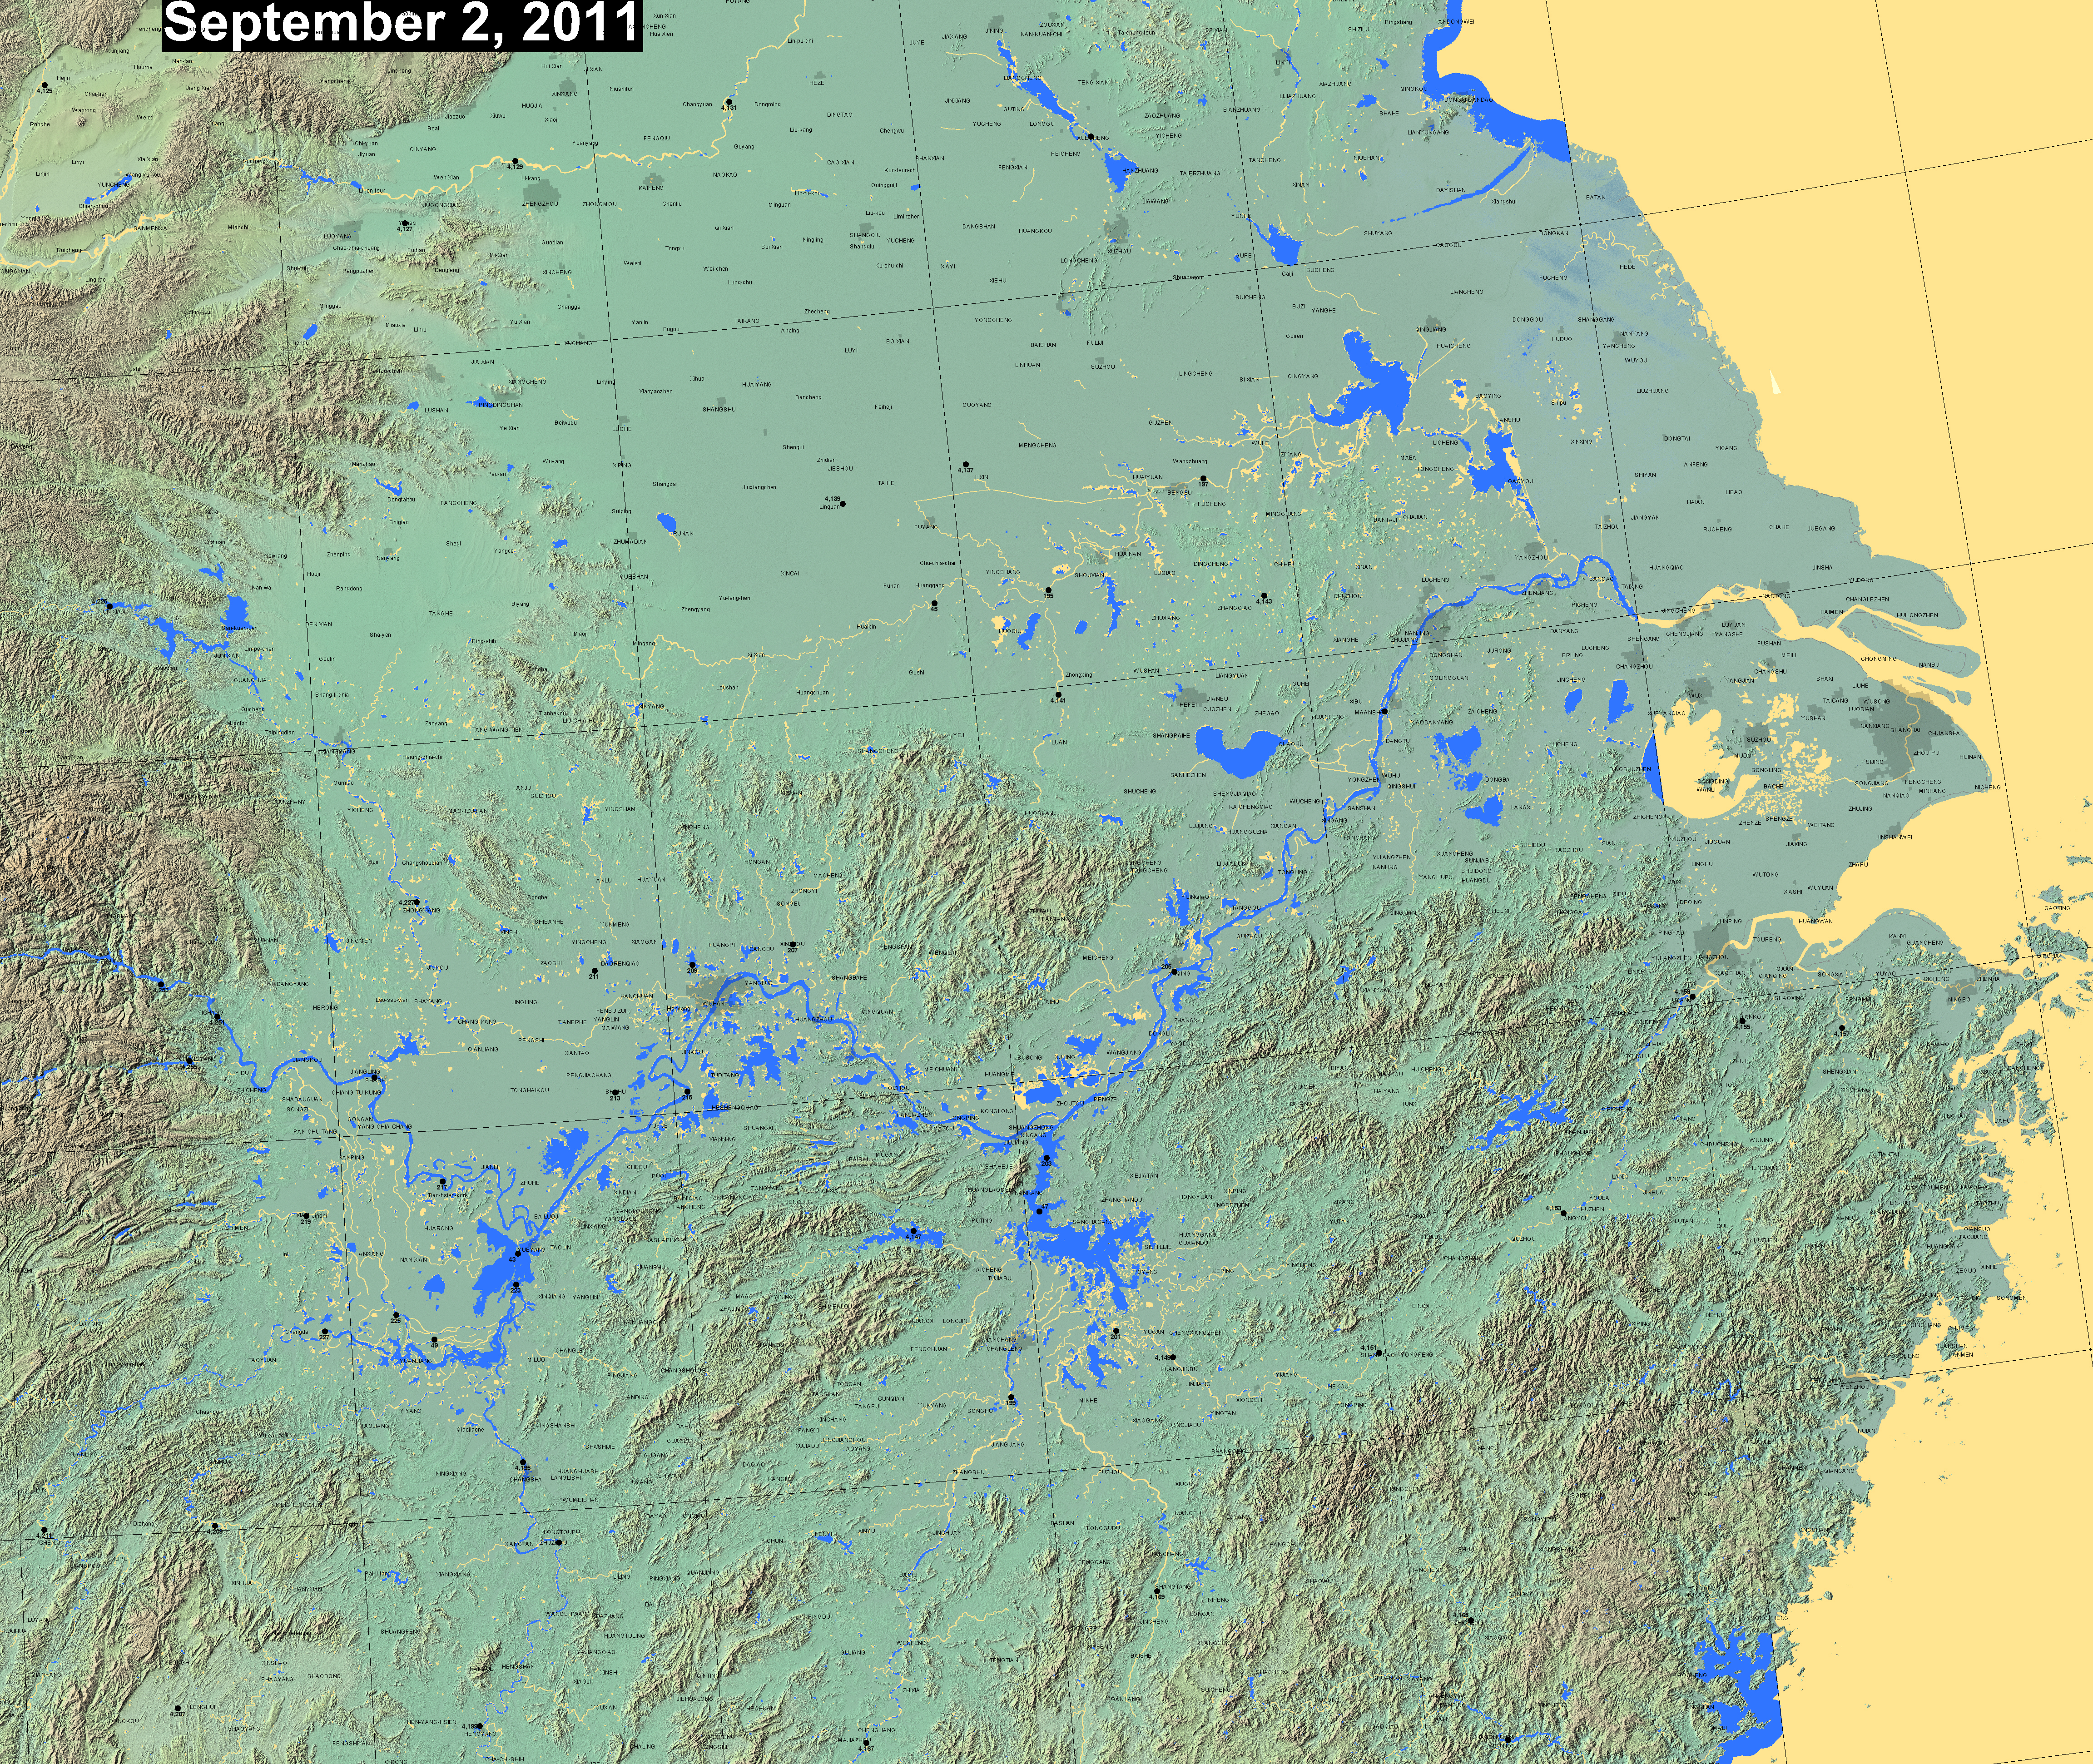
Shown in dark blue is the extent of current surface water as imaged by the two MODIS sensors aboard Terra and Aqua. Water areas are accumulated over 14 days to remove obscuration by cloud cover. Yellow indicates currently dry land that was covered by surface water on a reference date (February, 2000, from the Shuttle Radar Topography Mission Water Body dataset). During times of hydrologic drought, and as the extent of lakes, reservoirs, and rivers shrink, yellow areas appear and increase in size.
Known errors: 1) In mountainous regions, terrain shadows mimic surface water and are mis-classified as water in our current algorithm; we are working to reduce such noise. 2) The reference water is at much higher spatial resolution (90 m instead of 250 m). As a result, small or narrow water bodies may appear in yellow but are not necessarily locations of reduced surface water. Larger areas of yellow, however, should have been classified as water during the current 14 day accumulation, and clearly represent significant surface water contraction. The contraction of lakes and artificial impoundments (reservoirs) in particular is particularly well observed.
Clickable black dots link to experimental AMSR-E river discharge estimates. The shaded relief background is from topography provided by NASA SRTM data. For the most recent MODIS-based surface water available, see the NASA NRT Experimental Flood Maps. Recent GIS data from the automated MODIS-LANCE NRT processor for this display are located at http://csdms.colorado.edu/pub/flood_observatory/MODISlance/ . See also the technical description, and the history of display updates, via powerpoint slides.