Active Archive of Large Floods, 1985-Present
Master Index of Inundation Maps
Dynamic Atlas of the Earth's Surface Water
Ganges/Brahmaputra Regional Flood Management Information System

Frequently Asked Questions (FAQ)
What are "reported floods"?
We survey online news reports, governmental and international relief agency web sites. and other electronic data sources for reports of major flooding, locate the affected areas by drawing polygons within our geographic information system, gather certain other data such as "date began", and compile these into the "Dartmouth Active Archive of Major Floods". Correct citation for this archive, available both as .html (for the 30 most recent events) and as an Microsoft Excel file (entire archive, without the GIS polygon) is: Brakenridge, G. R, Anderson, E.K., and Carlos, H., 2009, Dartmouth Active Archive of Major Floods, http://www.dartmouth.edu/~floods/Archives/index.html.
What are "flood-generating Watersheds"?
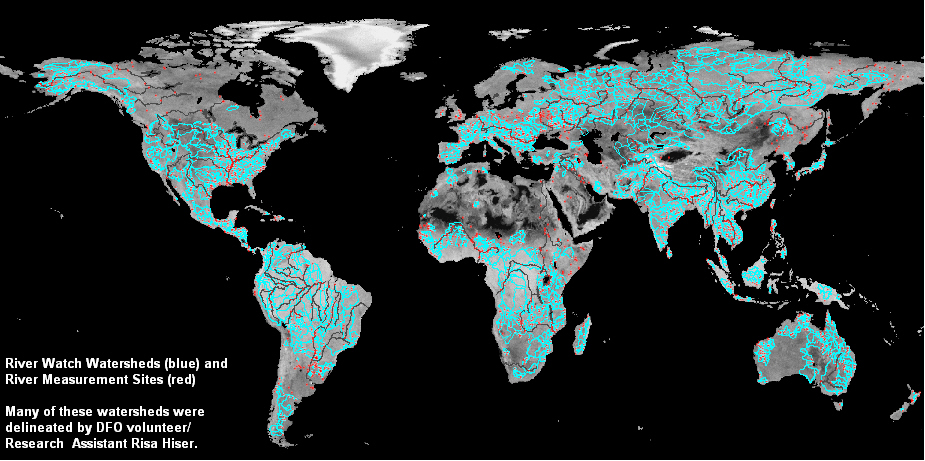
The River Watch processor, based on a feed of NASA AMSR-E satellite microwave data, produces a remote sensing signal that tracks river discharge at 2500+ carefully selected river measurement sites. We can determine when these sites are experiencing river discharges greater than those with a 1.33 yr ("flood") or 5 yr ("major flood") recurrence interval. DFO staff are delineating accurate watersheds for each of the sites. Status of such contributing area delineation is shown below.
The "Current Flooding Display" on the Observatory home page shows in red those watersheds whose measurement sites are experiencing flooding or major flooding.
How current is the "Current Flooding Display?
See the display legend. Also: for reported floods, the display is updated daily, and floods occurring within the previous 7 days are retained as numbered objects. For flood-generating watersheds, there is currently a time lag of 1-2 days from satellite overpass to update of the river measurement site signal values at the Joint Research Centre. Several days lag may then be added by futher processing at DFO to estimated discharge. We are working to reduce the combined lag time.
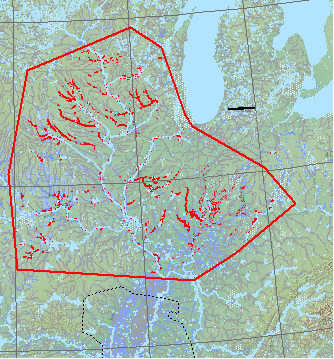
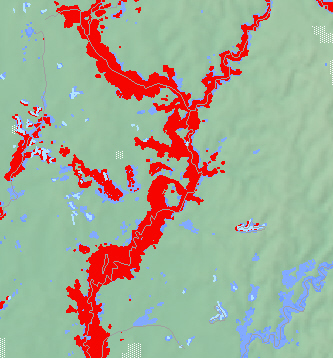
What is the difference between "area affected" and "area inundated"?
On the left, the red polygon shows "area affected". It is here delinated more accurately than commonly possible when based only on news and other reports: it shows the actual area experiencing flooding (small red areas are imaged flooded land). In many cases, the area affected polygons are very approximate.
On the right, the red areas are actual inundated land as imaged by the MODIS sensors. Light blue is permanent water, and other blue colors show previous flood events.
Have all of the 3500+ catalogued flood events been mapped and/or measured?
No, in fact most have not been mapped or measured. We began mapping floods using ERS- and other orbital remote sensors in early 1993, during the Great Flood of the Upper Mississippi Valley, and then quite intensively using the two MODIS sensors aboard Terra and then Aqua, commencing in early 2000. Given the frequency of MODIS coverage (twice daily at most locations), it is possible to use this optical sensor and occasional gaps in even heavy cloud cover to image and map many, perhaps most, of the ~150 major floods that occur each year. Lacking automated techniques, however, our small staff manages much fewer.
Over the years, however, DFO staff has mapped hundreds of flood events. As these are compiled into GIS databases, there is emerging a global atlas of flood hazard based on actual flood experience. This atlas has become the "Surface Water Data Record", and because it also makes sense to map new floods in the context of previous ones.
If time and resources permit, we hope also to use archived MODIS data to map many floods that we missed. Each new event, once mapped, provides additional information concerning future flood hazard.
What is the Surface Water Data Record?
Initially, we used the MODIS sensors to map floods as they occurred, and these "rapid response inundation maps" were published on this web site. In response to specific requests, we also distributed such maps directly to relief agencies or to researchers (and sometimes provided the component GIS data files). We then compiled all this map information into an Atlas which shows an increasingly comprehensive view of observed changes in surface water and of flood hazard.
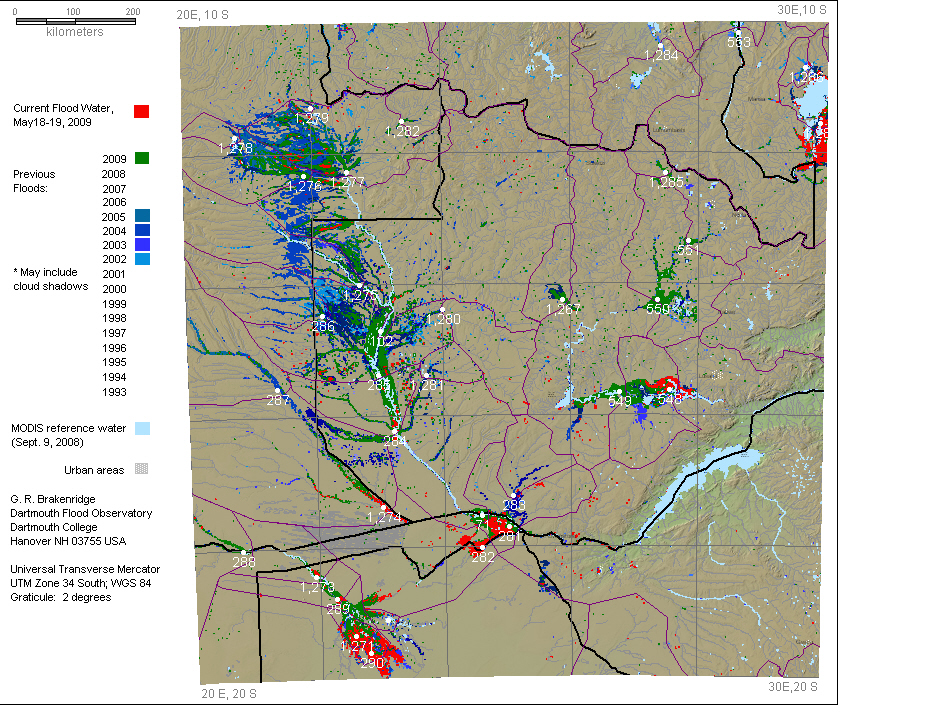
Now we have merged the two map products, and a third (the River Watch discharge measurement sites; click on the numbered sites in the displays below) into one Data Record. The Record is organized into, in most cases, 10 degree by 10 degree sheets. A sample sheet is shown below in reduced format (they are published at this web site in dimensions of either 48 or 54 inch widths, at 96 dpi, as .jpgs). The effective map scale of these digital maps is 1:125,000 on a 1280 x 800 computer monitor. There are two versions of each: a Flood version, showing changes in high water and associated land inundation, and a Drought version, showing surface water contractions during unusually dry conditions. As data continue to be compiled, the Flood version provides the imaged maximum limit of inundation in the time period of record, and the Drought version shows the smallest water areas observed.
How can the Surface Water Data Record be Interpreted and Used?
The accumulated information obtained by satellite remote sensing is simplified for map display as follows.
For the Flood version:
1. All floods occurring within particular years are mapped in specific colors.
2. Flood layers are stacked from oldest, at bottom, to youngest, at top (younger, larger floods obscure older, smaller ones).
3. The reference water (associated with mean conditions) is above all flood layers (this allows comparison of flooding to mean conditions).
4. During the current year, new flooding is always mapped in red, above all previous floods.
5. Each sucessive update to surface water in the current year is shown in red, but previously mapped flooding in the current year changes to green.
Through this approach, the imaged waxing and waning of flood events can also be visualized in multi-temporal slide shows.
Sample Flood version display, much reduced, is shown below: Clickable white dots are River Watch sites.
For the Drought version:
1. No flood layers are included.
2. Mean flow conditions and surface water extent are red and are at the base of the water map layers.
3. During periods of low water, the latest surface water extent is light blue and resides above the mean water layer.
4. Visible red areas, therefore, represent newly dry land as of the date of most recent imaging.
5. Over years of time, the minimum water extents are preserved as a dark blue layer above the mean water layer.
6. The year of these period-of-record minima are shown via text annotation in the displays.
Sample Drought version display, much reduced, is shown below. Clickable white dots are River Watch sites

How does the Surface Water Data Record indicate future flood hazard?
The Record provides useful information regarding future flood hazard: which we are currently in process of quantifying. For example, in many cases, the River Watch sites (white numbered dots in the sample flood display above, clickable on the Record sheets themselves) show the flood hydrographs responsible for the mapped inundations. Since the River Watch discharge record is continuous back to mid-2002, recurrence interval (exceedance probabilties) can be placed on these flood hydrographs and their associated flooded lands. Such information is being added to the Record displays as analysis proceeds (underway in 2009).
Can I obtain the Surface Water Data Record data in GIS format?
The Observatory receives many requests for copies of its large archive of GIS files showing flood inundation, which are covered by various applicable copyright and intellectual property laws. When such requests are for small subsets of the total archive, we commonly provide such free of charge.
We have provided large portions of our historical inundation data to the "PDC" (Pacific Disaster Center) and to the "UNISDR" (United Nations International Strategy for Disaster Reduction" for incorporation into their "Risk and Poverty in a Changing Climate" report just released. In both cases, provision of such data was under the terms of a formal contract, signed by both parties.
DFO publishes and continues to update large scale maps providing satellite-based flood inundation extents (the Surface Water Data Record). The raster versons of these maps can be ingested into GIS mapping sofware. Without additional funding, however, DFO does not have resources for translation of its internal GIS workspaces and individual data files into non-native file formats (they presently are in MapInfo format), and for the technical support needed for non-resident end users to reassemble the individual files into workspaces that can produce similar displays.
Why is caution required in the interpretation of satellite-provided flood inundation limits?
In some cases, end users request GIS files showing a flood inundation limit derived from a single image, and usually in order to evaluate either the extent of current flooding or the risk of future flooding. However, in many regions, surface water normally experiences a large amount of annual variability. As a result, unusual flooding can only be accurately evaluated by comparison to previously imaged and mapped normal, seasonal flooding.
For example, imaging and mapping of a current flood in Sub-Saharan Africa, monsoonal Asia, or parts of the seasonally flooded high latitudes may falsely delineate very large areas as "flooded", even though only quite restricted areas are experiencing unusual flooding. Some method of establishing the normal range of surface water extent is necessary. An approach such as the Surface Water Data Record provides for consistent orbital surveillance of water variability, and more accurate identification of the actual areas affected by any unusual flooding.
What is the "River Watch" processor and how does it work?
River Watch is a cooperative project between the Dartmouth Flood Observatory (Prof. Robert Brakenridge) and GDACS-GFDS, Global Disaster Alert Coordination System, Global Flood Detection System (Dr. Tom De Groeve), European Commission Joint Research Centre, Ispra, Italy. As rivers rise and discharge increases, water surface area within a defined river reach increases. Microwave emission can monitor such changes without major interference by cloud cover. River Watch uses the NASA/JAXA satellite microwave sensor AMSR-E, which provides global coverage of the Earth’s land surface on a near-daily basis. The 36.5 Ghz, descending orbit only, horizontal polarization only signal is used: its pixel dimensions on the ground are approximately 8 x 12 km (we collect all data with centroids within a 10 km radius of a fixed point target). The data are first retrieved by the Joint Research Center from NASA and JAXA data facilities, and then reformatted for distribution to the Dartmouth processor.
The discharge estimator is a ratio of: C, single pixel calibration target "brightness temperature" (microwave radiance) for a nearby land parcel unaffected by river changes, to M, measurement target brightness temperature (for a pixel centered over the river reach). Due to low emission from water surfaces, C/M values increase as river discharge and reach water surface area increases, and especially as overbank flow is approached and exceeded. In contrast, the ratio is unaffected by soil moisture, vegetation, or other changes affecting both C and M. Transformation of the remote sensing signal to actual discharge values on an international basis is accomplished by comparison of monthly means of remote sensing signal to regional gaging station data and with adjustment for differing contributing areas.
The accuracy, and precision of such orbital measurements is tested along U.S. and European rivers where daily in situ discharge data are also available. See this article for further explanation (in this publication, a gridded AMSR-E data product is used). The initiation and removal of river ice cover is also detected: ice breakup immediately increases the C/M ratio.
There are 2500+ measurement sites, distributed globally (see "flood generating watershed" display, above). Most have not yet been calibrated to actual discharge, but instead a standard "rating equation" has been applied: these sites show relative discharge changes only. DFO is progressively calibrating all of the sites to actual discharge.
Who uses data from the Dartmouth Flood Observatory?
Since much of our data are accessible from this web site, site access statistics help address this question. In the 7-day period ending 24-Jul-2009, these statistics applied:
Successful requests: 131,013 (62,232)
Average successful requests per day: 9,066 (8,890)
Successful requests for pages: 92,016 (45,520)
Average successful requests for pages per day: 6,367 (6,502)
Failed requests: 1,137 (535)
Redirected requests: 5,092 (1,869)
Distinct files requested: 14,567 (10,805)
Distinct hosts served: 5,884 (3,117)
Data transferred: 76.53 gigabytes (37.55 gigabytes)
Average data transferred per day: 5.30 gigabytes (5.36 gigabytes).Users include a wide variety of research, educational, disaster alert and relief, and national and regional water ministry personnel. Below are some examples (citations in published literature are not included):
Disaster alert and relief users:
- ReliefWeb (global hub for humanitarian information, UN Office for the Coordination of Humanitarian Affairs (OCHA)
- OCHA (UN Office for the Coordination of Humanitarian Affairs), Regional Office for Asia and the Pacific
- Sentinel Asia (Disaster Management Support System in the Asia-Pacific Region, Japanese Space Agency (JAXA)
- The Pacific Disaster Center
- The GDACS (Global Disaster Alert and Coordination System) project of the European Commission
- Thomson Reuters Foundation AlertNet (alerting humanitarians to emergencies)
- HEWS (Humanitarian Early Warning Service of the World Food Program, UN)
- GRIP (Global Risk Identification Programme, hosted by the UN Development Programme, UNDP)
- The U.S. NOAA Satellite and Information Service, National Climatic Data Center
- UN-Habitat Disaster Assessment Portal
- U.S. Geological Survey Maps on Demand (products related to hurricanes Katrina and Rita)
- Map of U.S. Government Humanitarian Assistance to Burma, USAID (http://myanmar.humanitarianinfo.org/map
center/Maps)/
Some Examples of Educational users (specific courses, U.S. only):
- Homework assignment VI, flooding exercises, Tulane University, EENS 2004 Natural Disasters
- U.S. National Association of Geology Teachers (NAGT), Geology and Human Health (DFO listed as resource)
- ENGR 4510, Climate Change and Natural Hazards, University of Oklahoma
- University of Illinois Urbana Champaign, Geology 118, Natural Disasters
- University of California Santa Cruz, Geology 104, Geologic Hazards
- Loma Linda University, ESSC 500, World Regional Geography
- University of Massachusetts, Geo250, Natural Disasters
- Western Oregon University ESA476/576, Hydrology
- University of Michigan Geological Sciences 207
- University of Washington, Department of Urban Design and Planning, UDP598X Natural Hazard Mitigation Planning
- Georgia College and State University, Geography 4120 Natural Hazards
- University of Arkansas, Geology 113-005 Physical Geology
- University of Texas, CE394K.E, GIS in Water Resources
This work is made possible by data obtained by NASA, JAXA, ESA, and other space agencies. Funding support is from the Earth Surface and Interior Focus Area and the Applied Sciences Program, Science Mission Directorate, NASA, and from the European Commission, through the GDACS project, Joint Research Centre, Ispra, Italy. We acknowledge Dartmouth College, Department of Geography, and the CSDMS Facility, University of Colorado, Institute for Arctic and Alpine Research (INSTAAR) for office and computer support.
http://floodobservatory.colorado.edu