


![]()
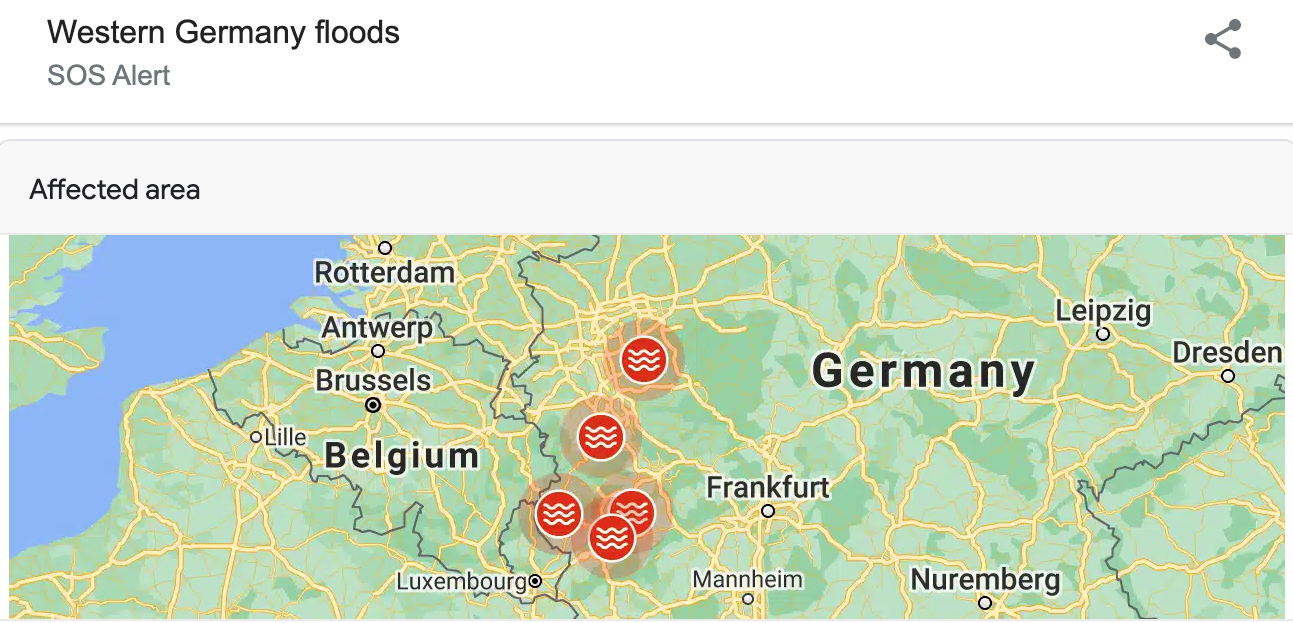
"Germany – Fatalities, Evacuations, Dozens Feared Missing After Severe Flooding 15 JULY, 2021 BY RICHARD DAVIES IN EUROPE, NEWS Flooding after torrential rain has caused widespread damage in Germany. Four people have died and dozens are thought to be missing after buildings collapsed in flooding in Rhineland-Palatinate. Flood-related fatalities were also reported in North Rhine-Westphalia and one person was reported missing in Saxony. Update: The district of Euskirchen in North Rhine-Westphalia reported at least 8 people have died in catastrophic flooding in the area. Several villages have been evacuated, including Flamersheim, after the Steinbachtalsperre dam threatened to break. Telecommunications in the area have failed and emergency service numbers are not working. Authorities said people were being rescued from floods in Schleiden, Gemünd and Oberhausen.” See Flood List
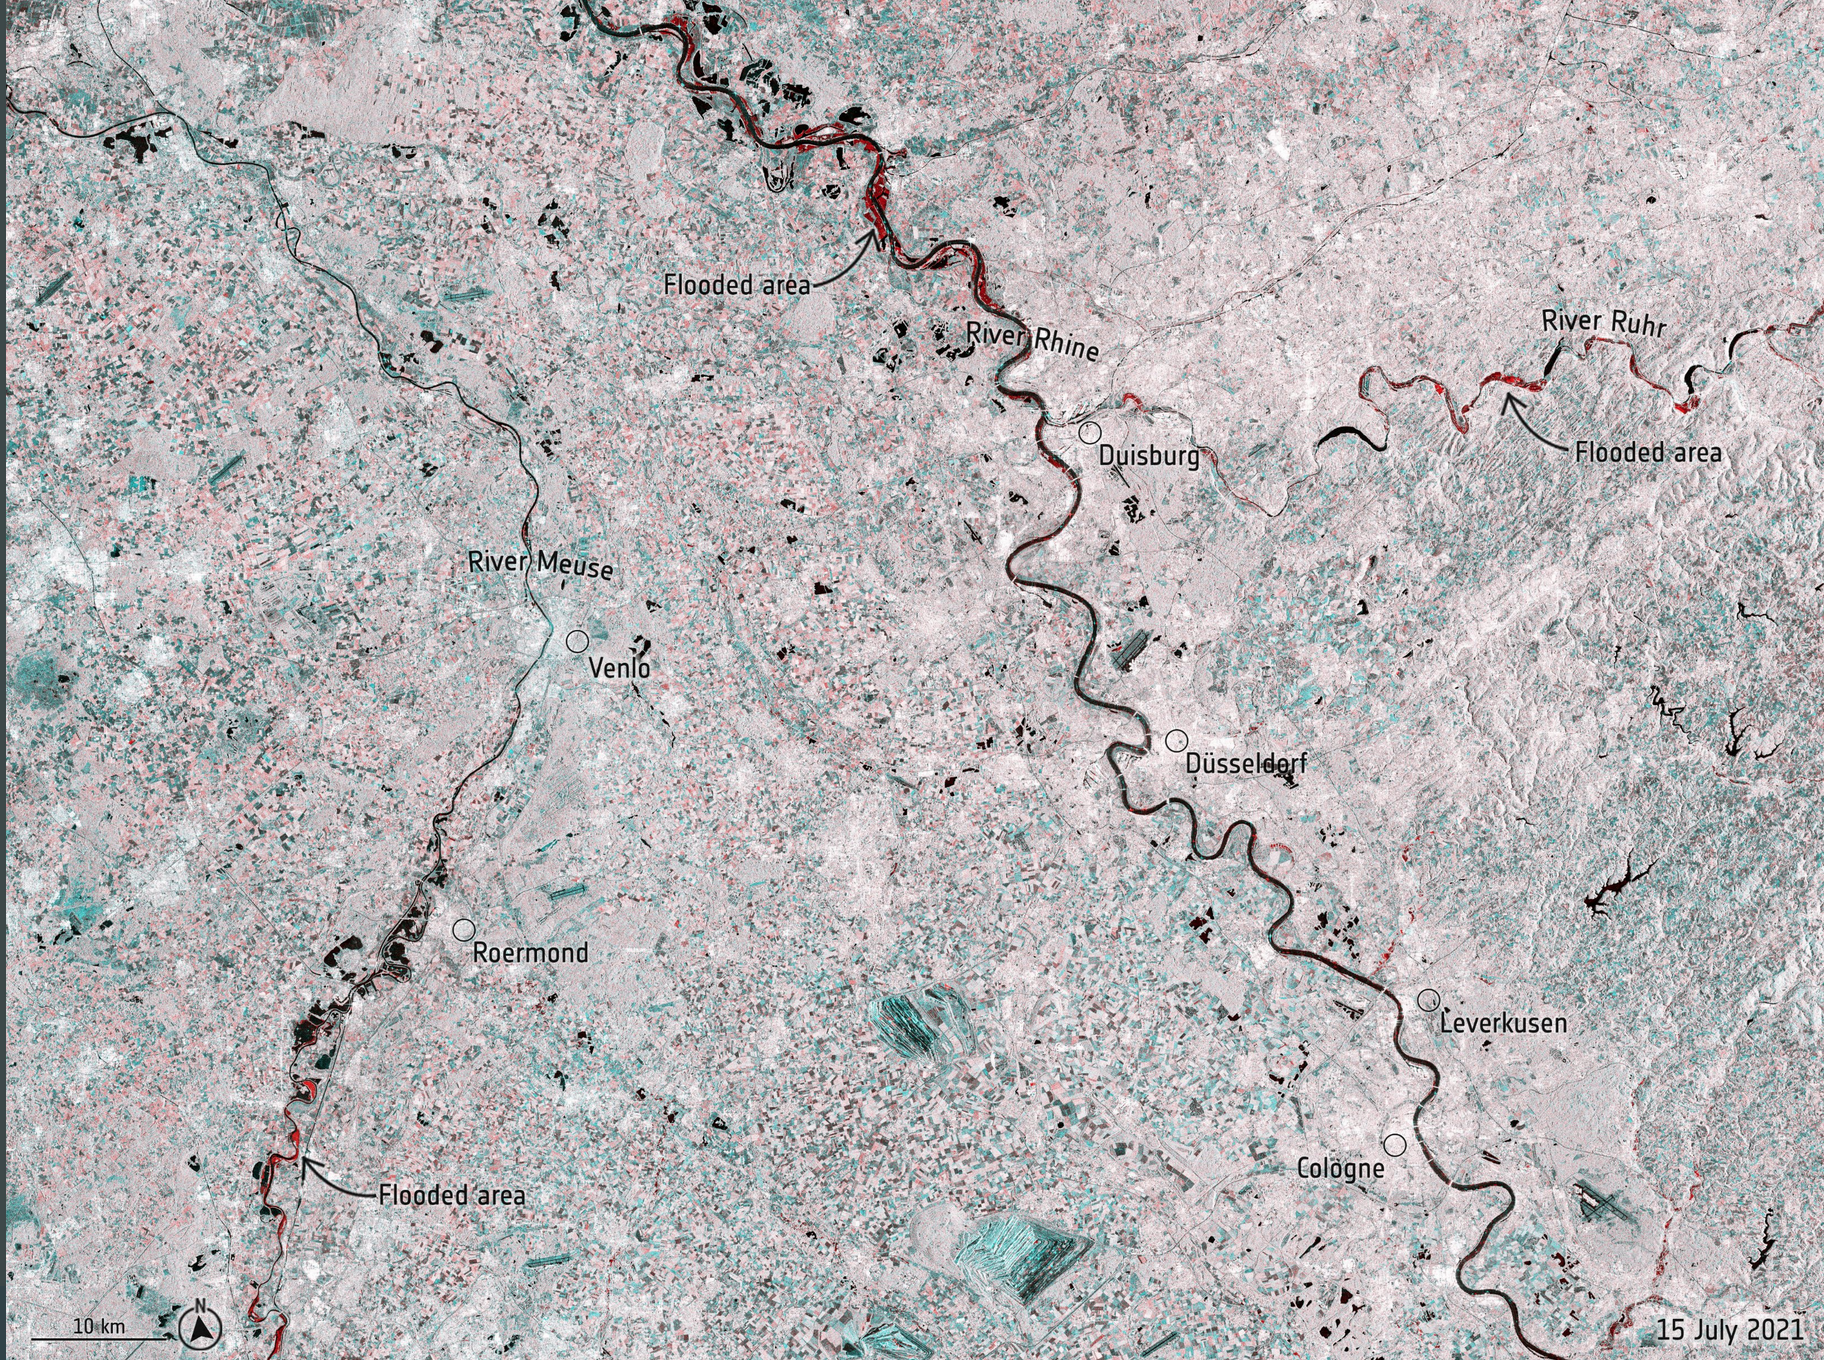
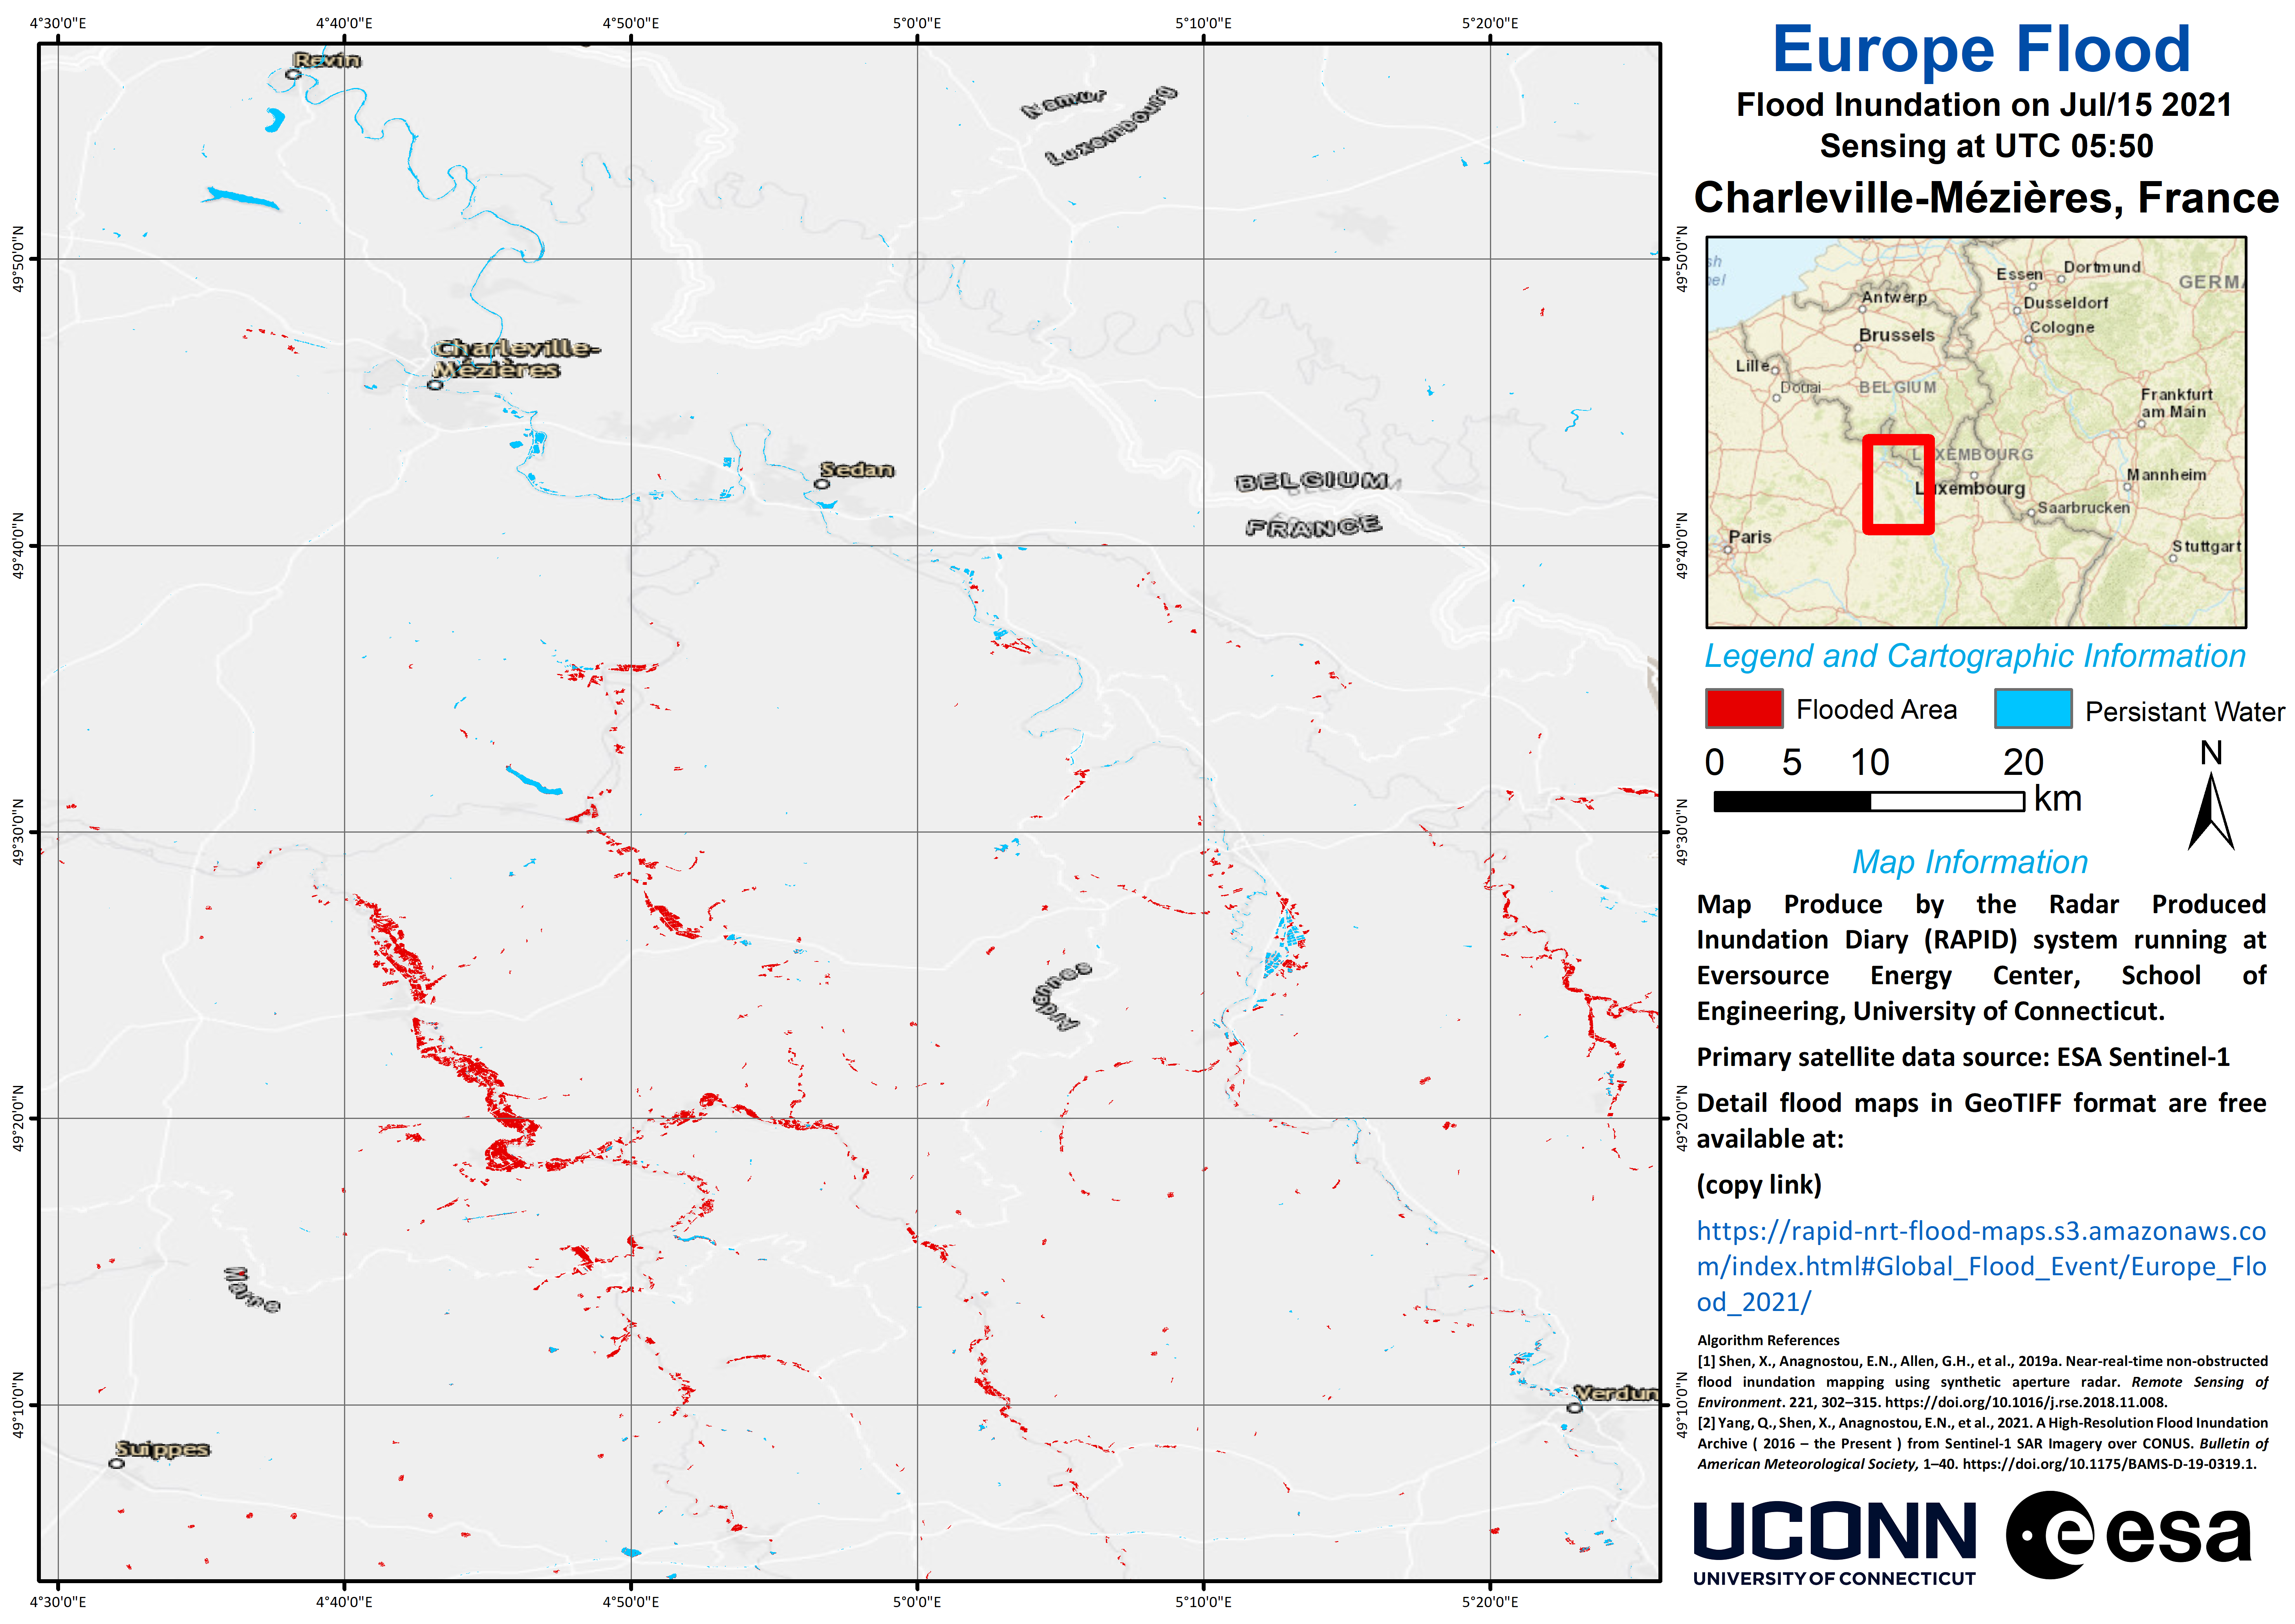
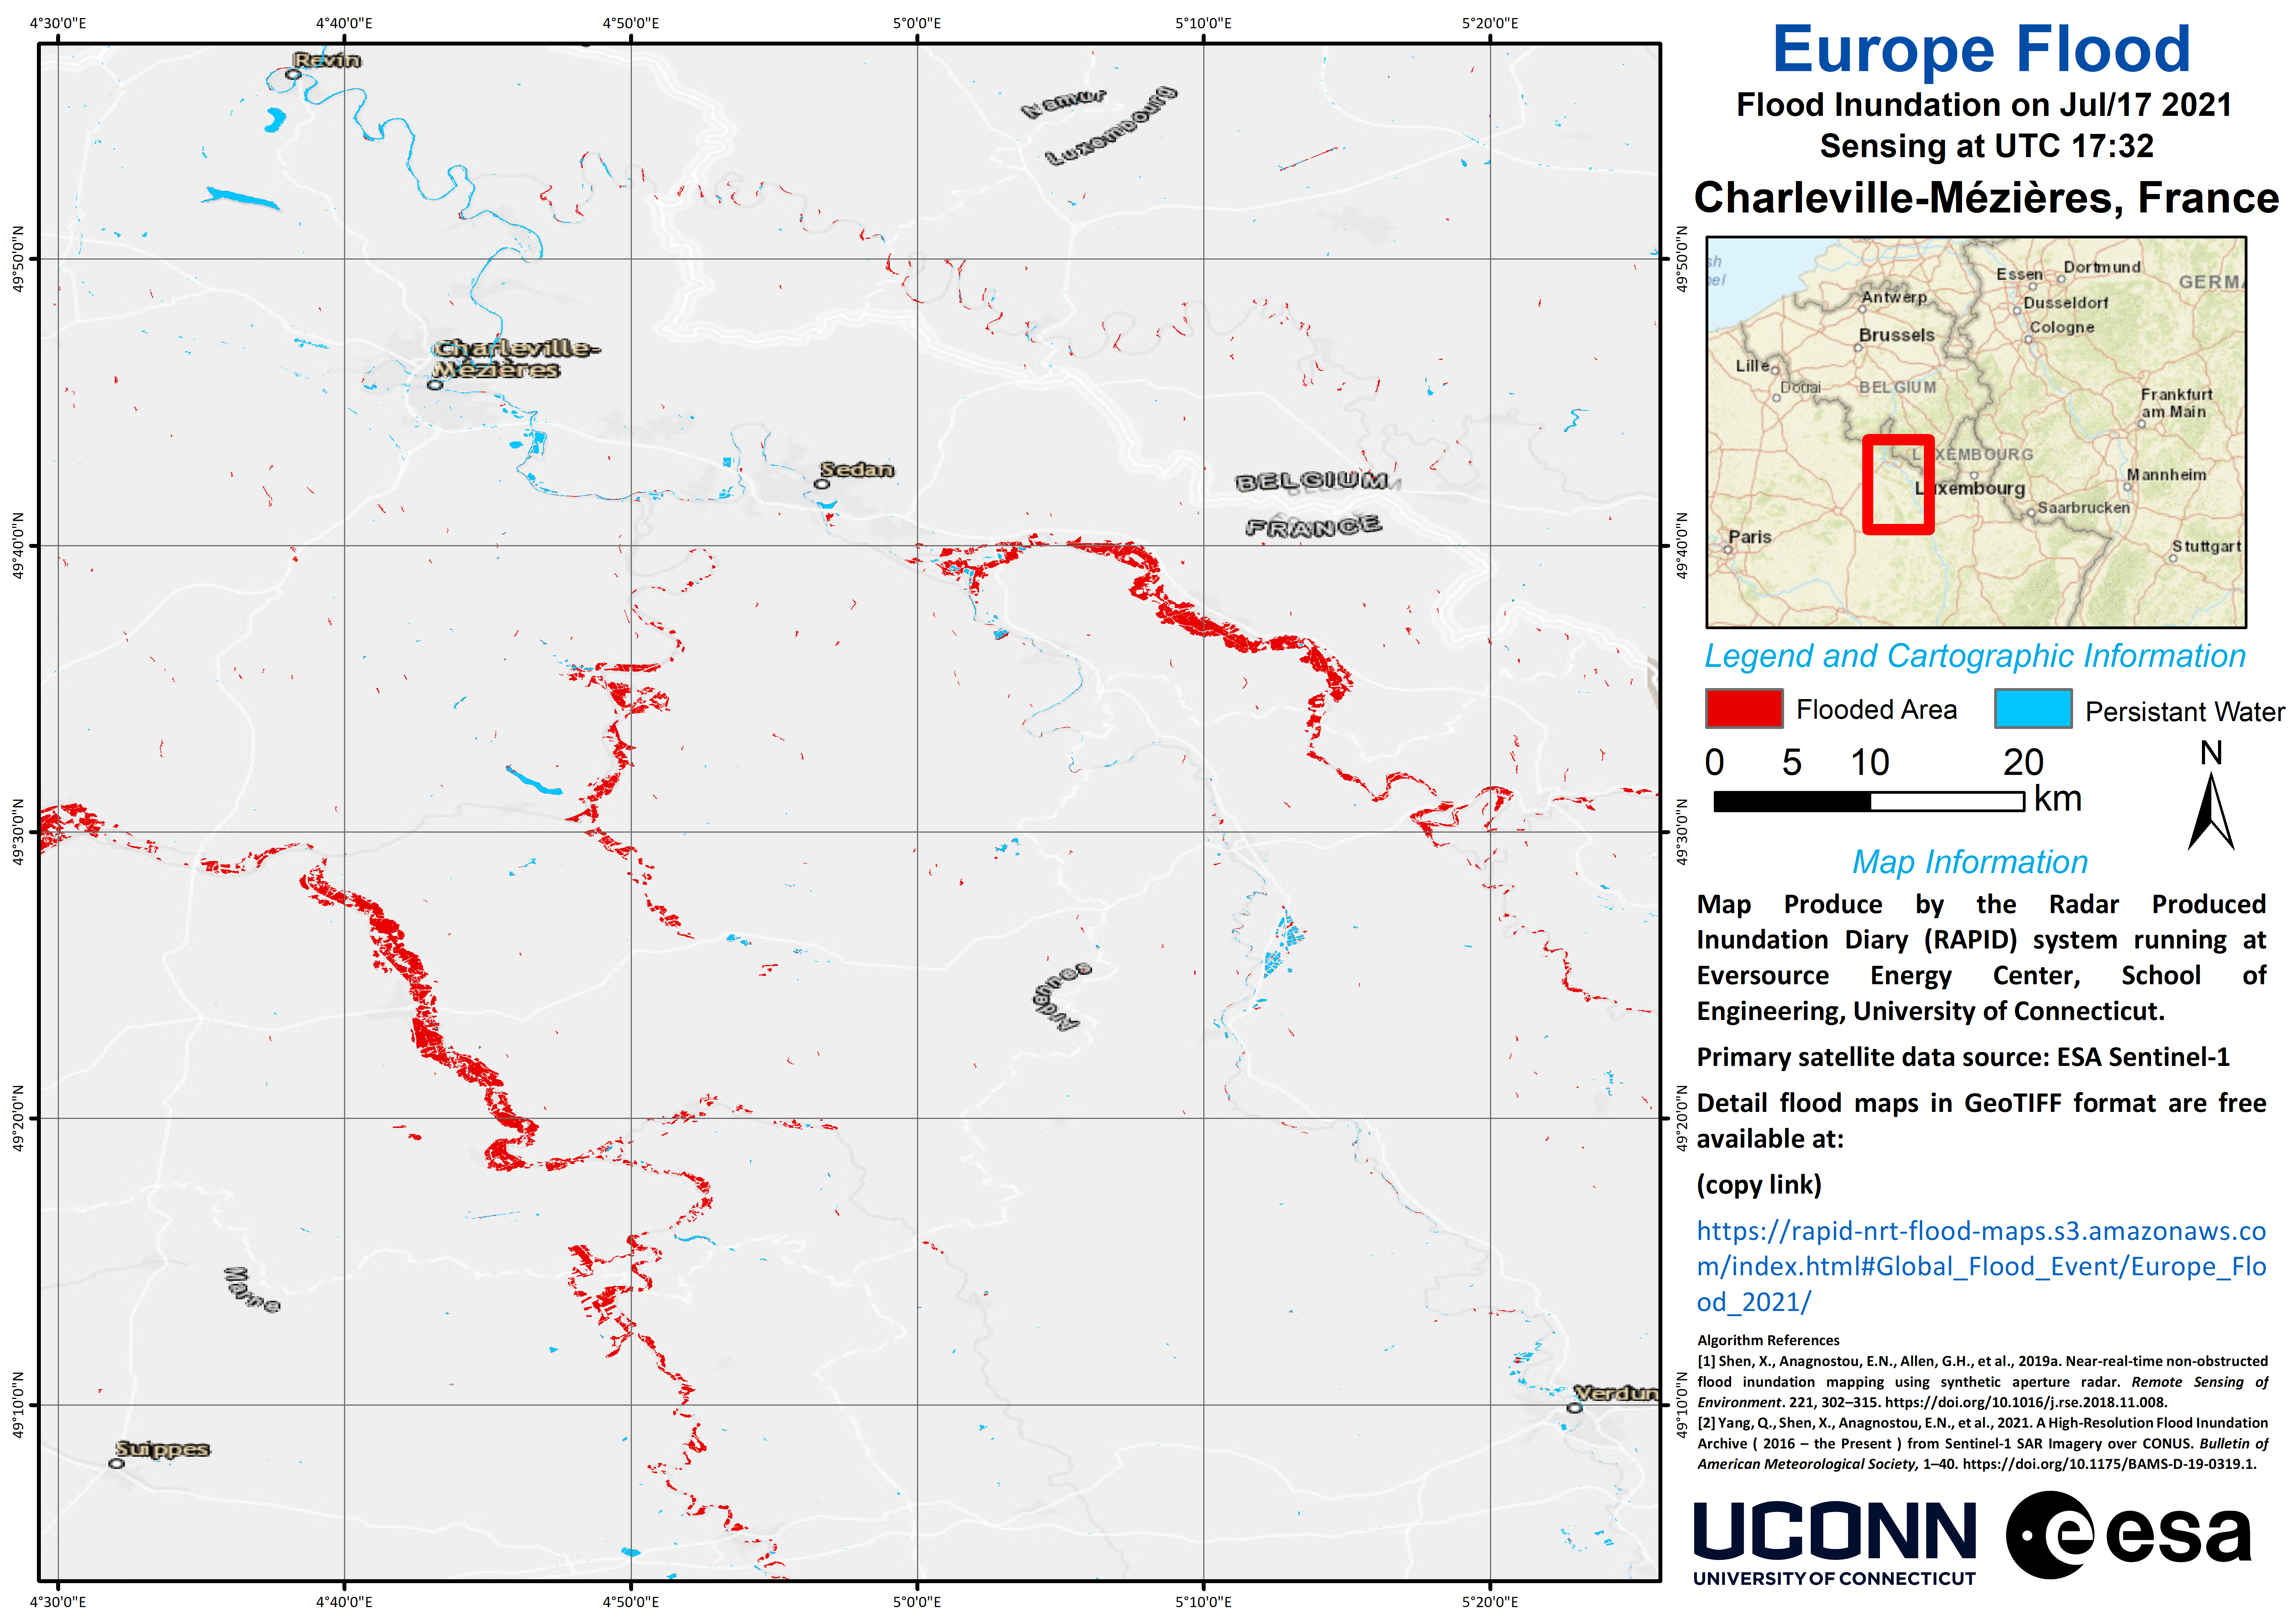
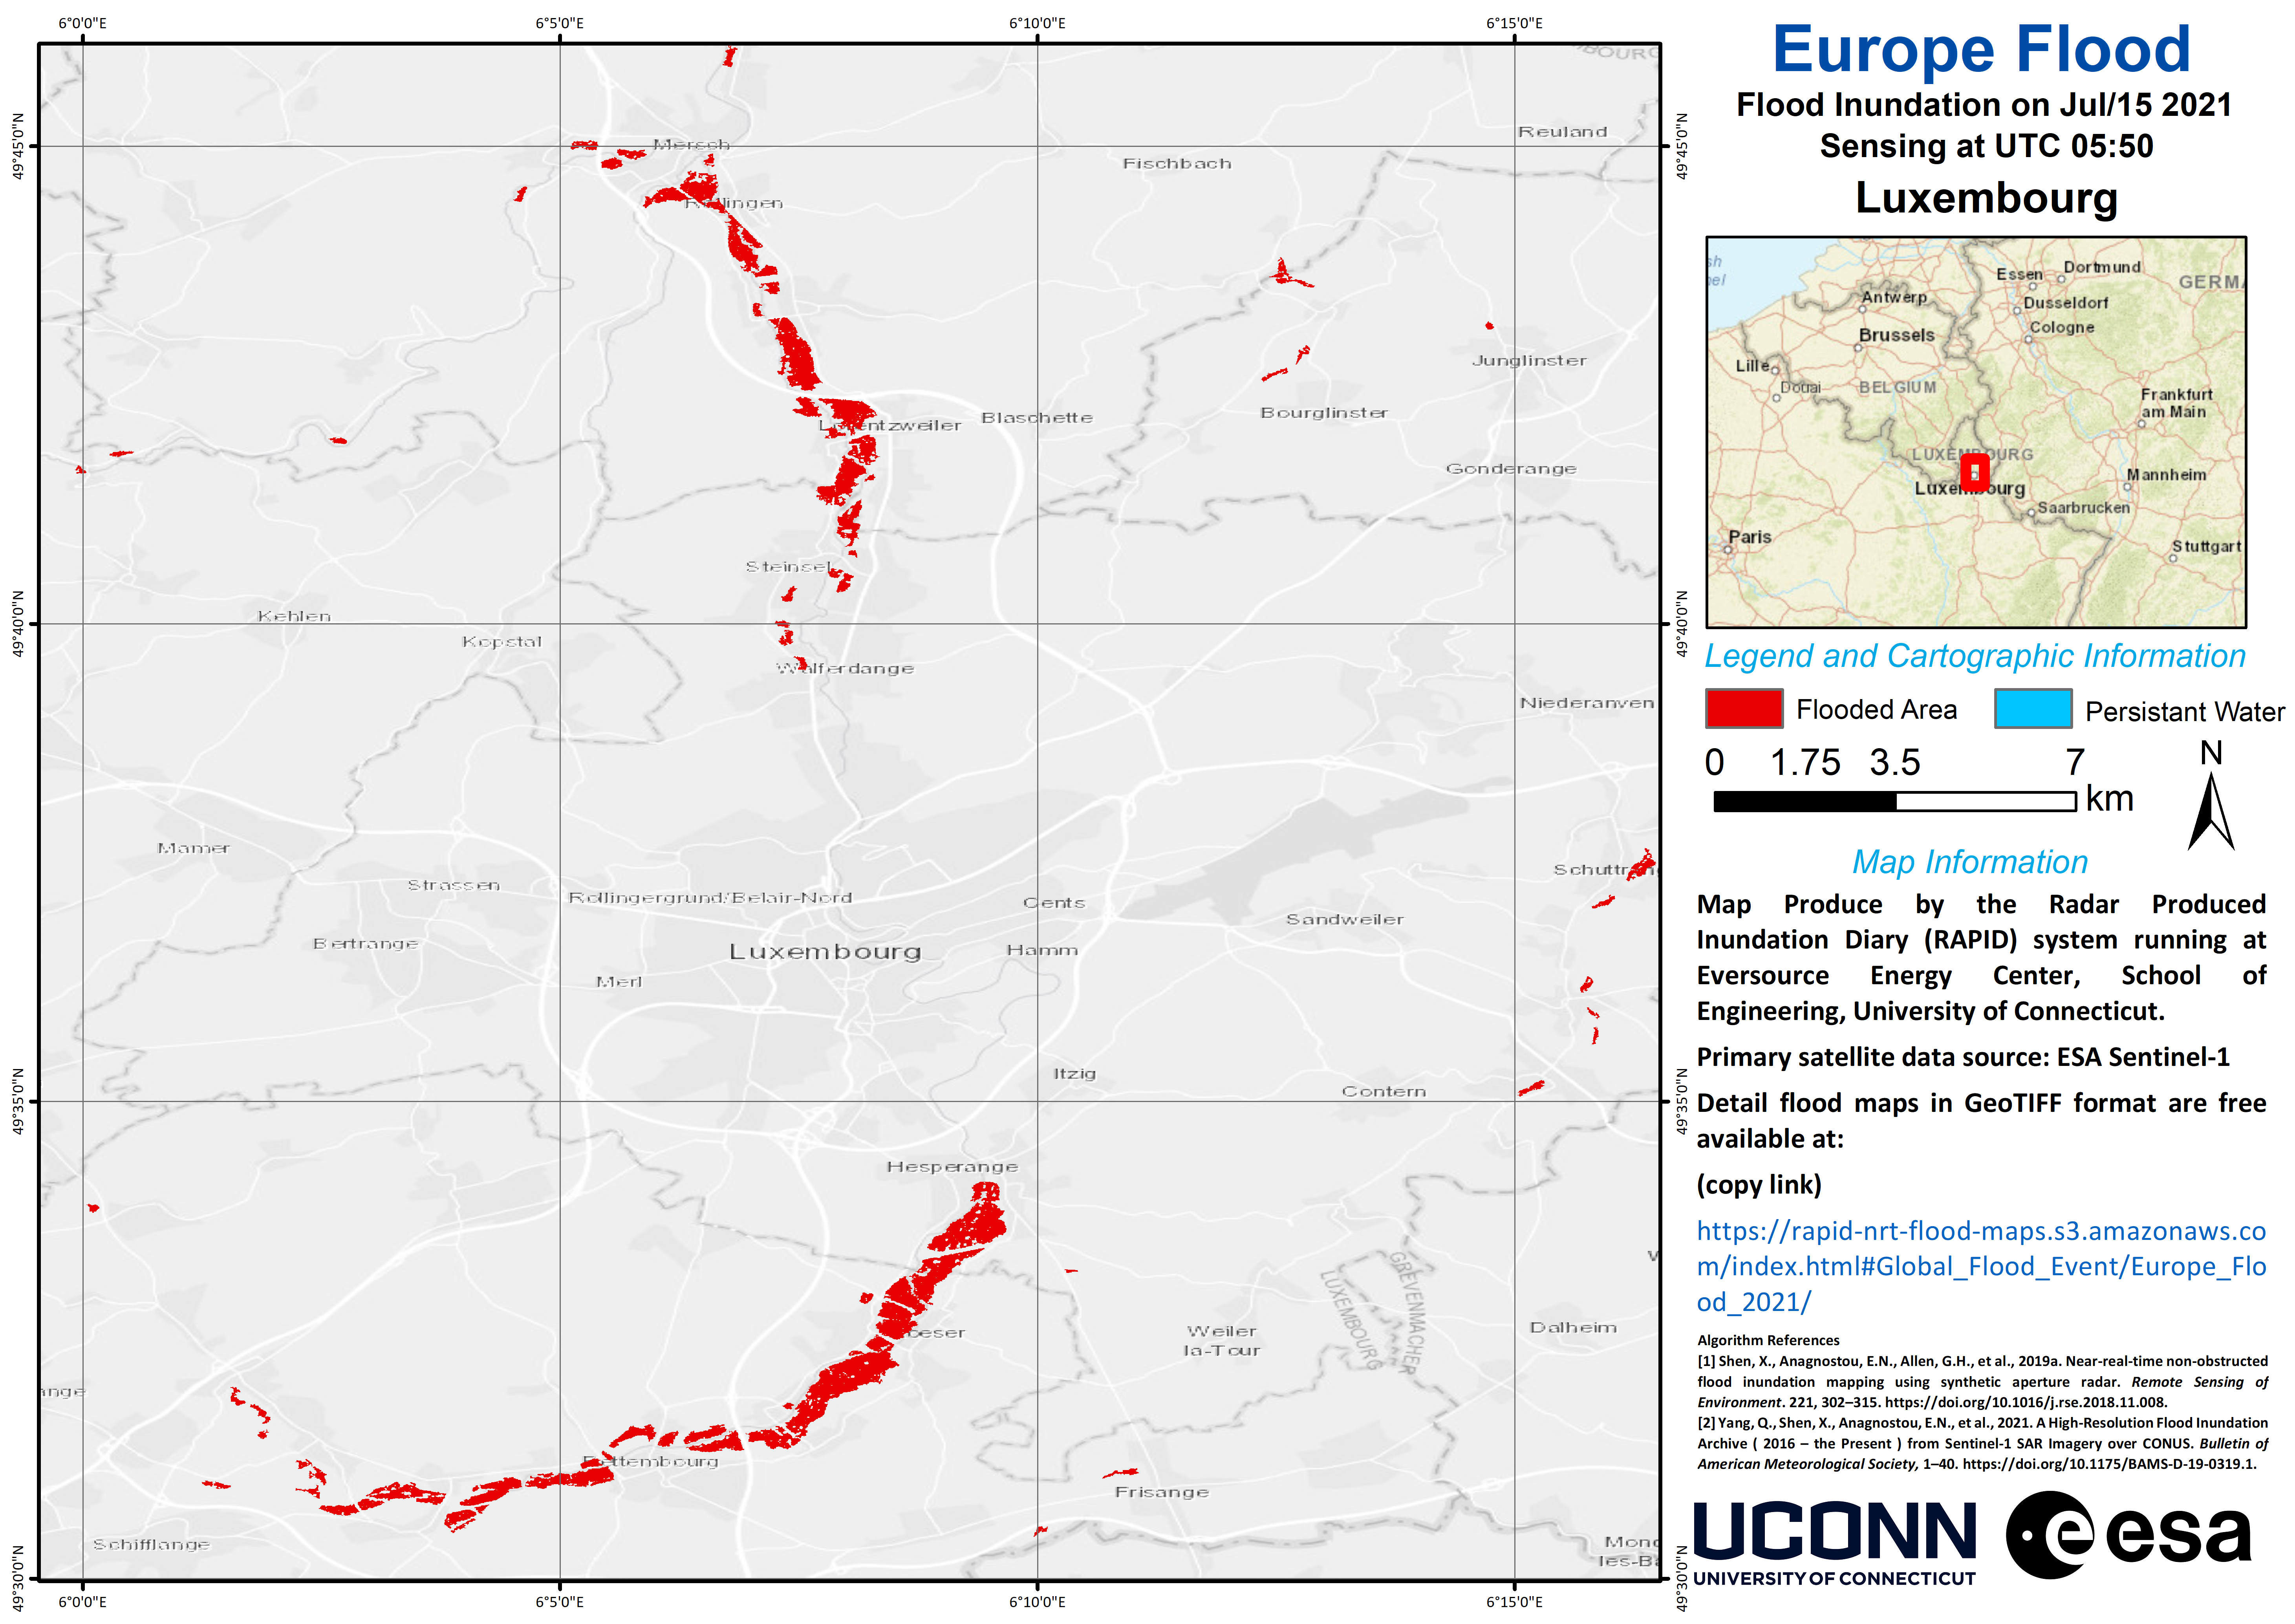
Multi-temporal color composite, showing flooding in red (flood image date and time: July 15, 2021, 05:50 UTC). From Luxembourg Institute of Science and Technology (LIST), Dr. Patrick Matgen
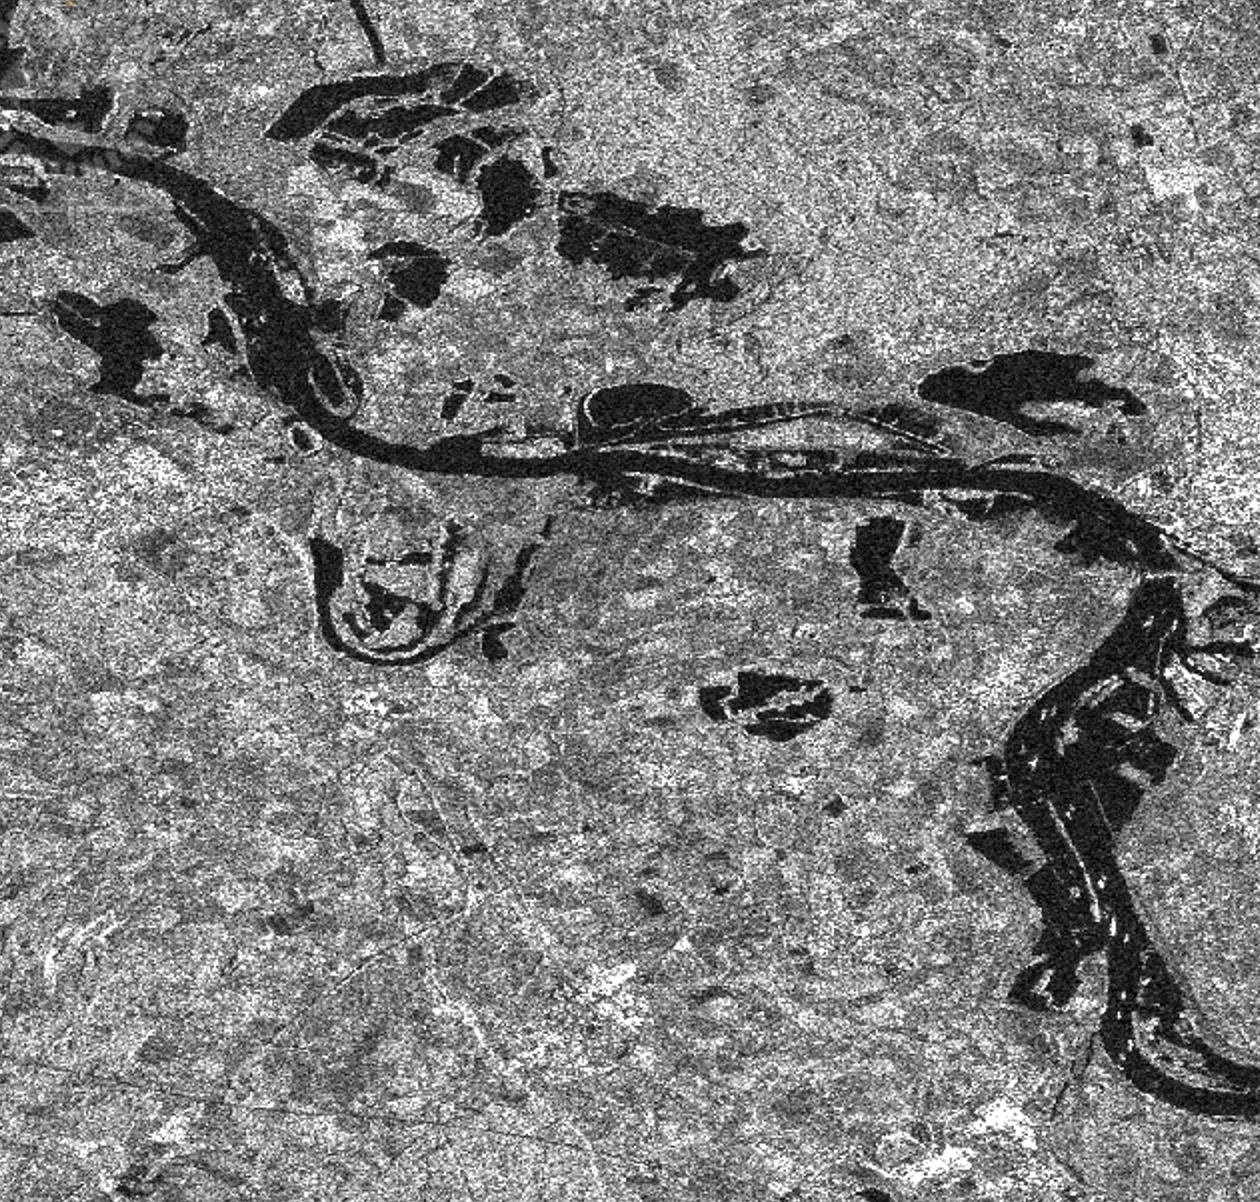
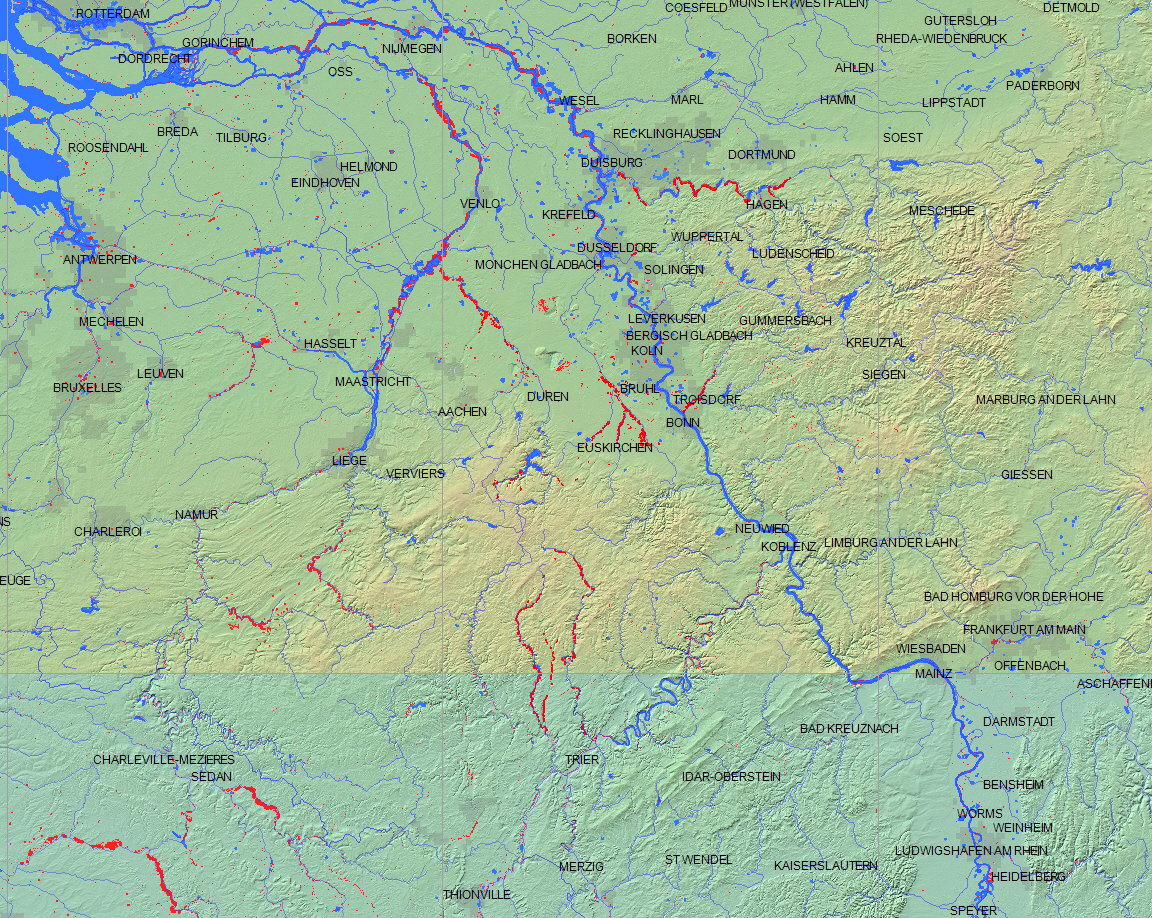
Detail 1 of July 15 05:50 ESA/Copernicus Sentinel Sar image processed at DFO. This shows Rhine River west and south of Wesel; compare with upper portion of image above.
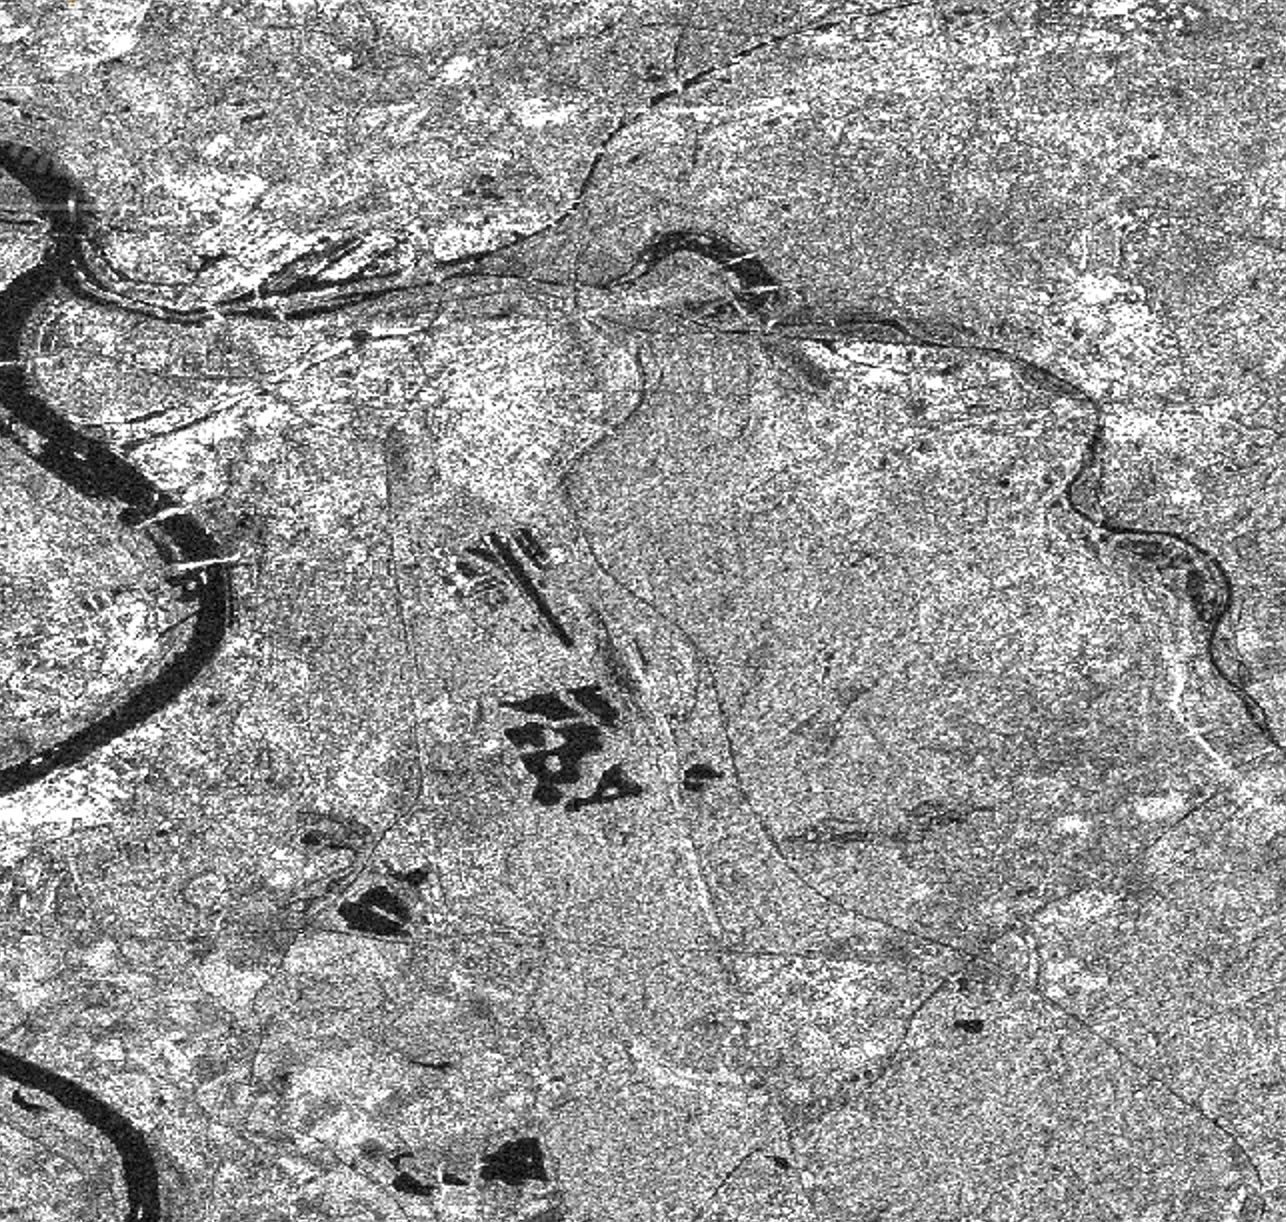
Detail 2 of July 15 05:50 ESA/Copernicus Sentinel Sar image processed at DFO. Ruhr River at Duisburg.
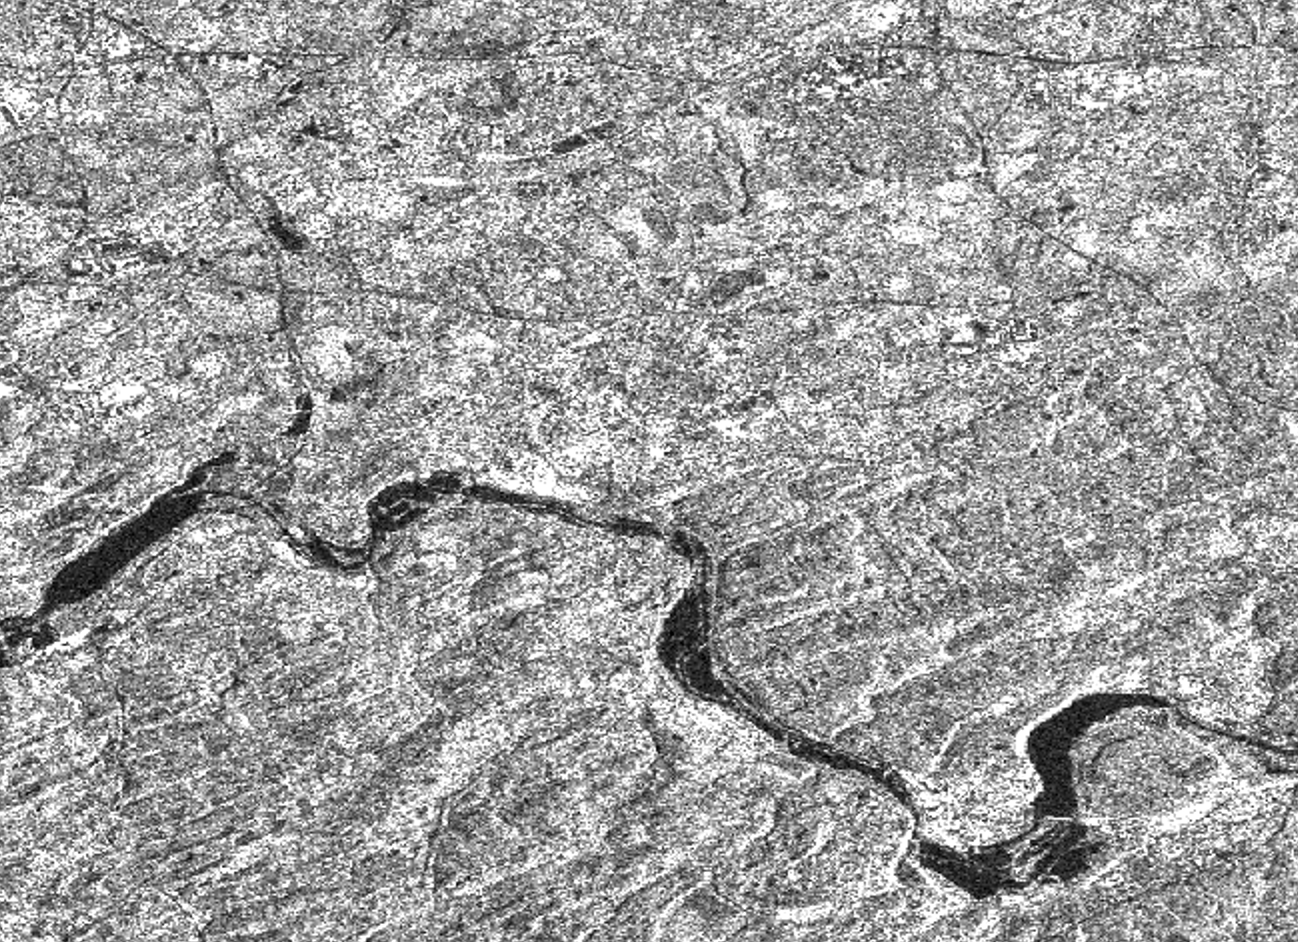
Detail 3 of July 15 05:50 ESA/Copernicus Sentinel Sar image processed at DFO. Ruhr River east of Duisburg.
The Flood Observatory maintains a Global Active Archive of large flood events, 1985 to present. New major flood events are entered into this archive each week. A hand-drawn GIS polygon for each event outlines the region affected.
This event was selected for Observatory production of map and GIS data products.This web page and associated image and map (GIS) files become the permanent Flood Observatory record of the flood.
As part of collaborations with other organizations, including
GEO and the Global Flood
Partnership, the Observatory's maps are made available here to the public.
Geotif versions and GIS files are also available. With attribution, maps and
data can be used freely for non-commercial purposes. With permission, they can
be used for commercial purposes. Consult Robert.Brakenridge or Albert.Kettner (at
Colorado.edu) if questions. Attribution for this map when Sentinel SAR data are
used: "Dartmouth Flood Observatory at the University of Colorado, from satellite
data provided by NASA and Copernicus/European Space Agency". When using GIS data
(see below) provided to DFO from other sources, please acknowledge original
source.
NASA Landsat 8 and Copernicus/ESA Sentinel SAR data if used in this map were obtained from the the U.S. Geological Survey Hazards Data Distribution System. and the Sentinels Science Data hub, respectively. Landsat 8 is jointly managed by NASA and the United States Geological Survey. Copernicus is supported by the European Commission. MODIS data are obtained from the NASA NRT Global Flood Mapping facility (surface water extents) and from NASA Worldview (image files); SUOMI/VIIRS image data are also retrieved from NASA Worldview. Sentinel 1 SAR-based flood mapping is also contributed by Xinyi Shen and Qing Yang and the Rapid system at the University of Connecticut.
Flood extent files (Shp or Mapinfo) and geotif files supporting this Flood Event Map are located here.
These files may include high spatial resolution mapping such as from Sentinel or Landsat, or lower resolution files from MODIS. File names commonly include the sensor source (e.g., S1 for Sentinel 1, LS8 for Landsat, MODIS, Aqua, or Terra for MODIS) and the image date.
The NASA Earth Sciences Program, the Latin American Development Bank, the World Bank, the European Commission's Global Disaster Alert and Coordination System, GDACS, and Copernicus Emergency Management Service, the Google Earth Engine research awards program, the Committee on Earth Observation Satellites (CEOS) Disasters Working Group-Flood Pilot, the Japanese Space Agency, and the European Space Agency all have supported the Observatory's work via research grants and contracts or free satellite-derived data.
The Dartmouth Flood Observatory was founded in 1993 at Dartmouth College, Hanover, NH USA and moved to the University of Colorado, INSTAAR, CSDMS in 2010. The institutional support of both universities is gratefully acknowledged.
(counting since July 16, 2021)