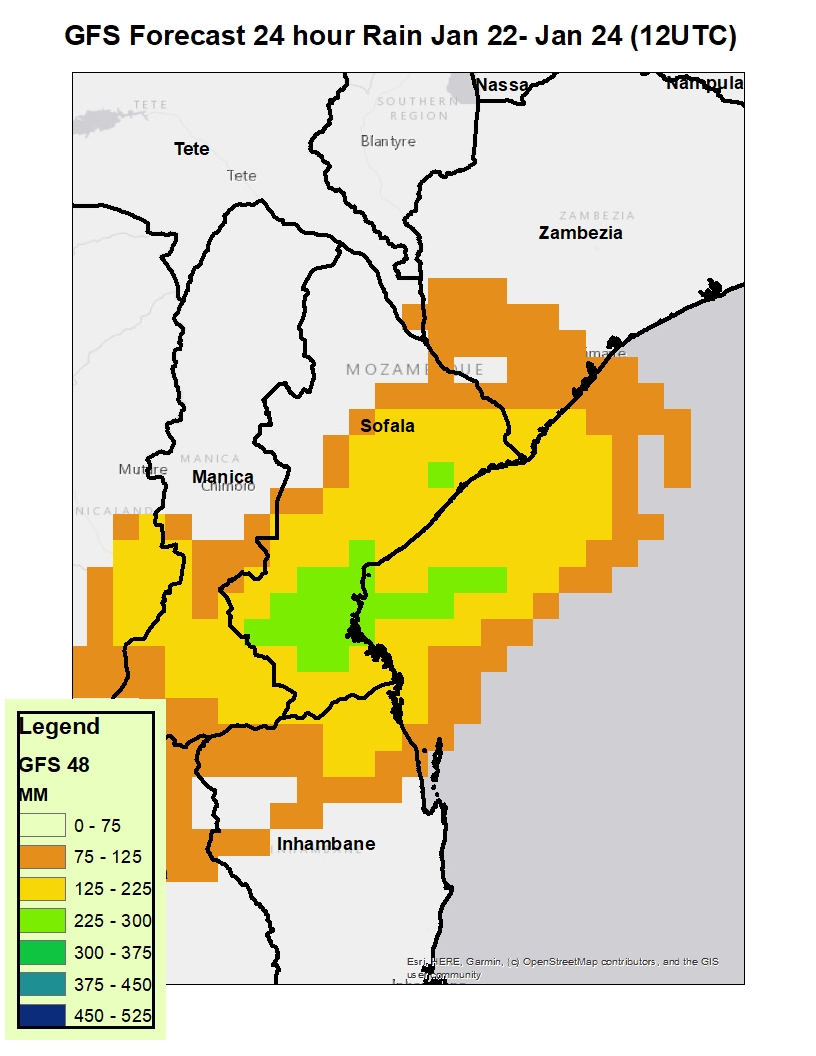


"Southern Africa – Tropical Cyclone Eloise Triggers Floods in Mozambique, Zimbabwe and South Africa 25 January, 2021 by Richard Davies in Africa, News Disaster authorities report that 6 people have died in Mozambique after Tropical Cyclone Eloise made landfall in Sofala Province early on 23 January 2021. Flood and storm damage in Buzi District, Sofala, Mozambique, after Tropical Storm Eloise, January 2021. Photo: INGD Previously the storm caused wind damage and flooding in parts of Madagascar, where at least 1 fatality was reported. In Mozambique, Eloise caused severe flooding in parts of Sofala Province, but also affected Zambezia, Inhambane and Manica provinces as the storm made its way west. Mozambique’s National Institute for Disaster Risk Management and Reduction (INGD) reported over 175,000 people have been affected by the passage of the storm. INGD added that 6 people have died and 12 injured. Flooding caused severe damage to thousands of homes and over 8,000 people have been displaced, mostly in Sofala Province. INGD estimated that a total of 136,755 hectares of farmland has been flooded in affected areas. In Zimbabwe, heavy rains caused flooding, mudslides and destruction of infrastructure in Manicaland, Mashonaland East and Central, Matabeleland South and Masvingo provinces, according to a report by the UN Office for the Coordination of Humanitarian Affairs.Three people died after being swept away by flood waters in Chipinge, Manicaland Province. Heavy rain has increased river and dam levels. Zimbabwe National Water Authority (ZINWA) said the Tokwe Mukosi (also Tugwi Mukosi) dam near Ngundu, Bikita District in Masvingo Province was “discharging a combined average of 16 cubic meters (16000 litres) per second”, as of 25 January. Areas downstream along the Tokwe River have been placed on high alert. In South Africa, SA Weather Service said heavy rain affected parts of Limpopo and Mpumalanga provinces, with some flooding reported in Venda in the far north of Limpopo..” Quoted from Flood List

Results from the Global Flood Monitoring System (GFMS) at ESSIC, University of Maryland, courtesy of Dr. Robert Adler and as shown in the DFO Web MapServer. Date: 2021-01-25. This is flooding as modeled from input precipitation data, topography, and flow routing computations.

FloodScan maps flood extent without cloud cover inteference. It derives flooded fraction from 22-km microwave information (AMSR2 and GMI) and downscales it using a footprint-matched database built from topography and Global Surface Water Explorer data. Data provided for evaluation purposes only. Feedback on usefulness is greatly appreciated. Source: Atmospheric and Environmental Research (AER).


The Flood Observatory maintains a Global Active Archive of large flood events, 1985 to present. New major flood events are entered into this archive each week. A hand-drawn GIS polygon for each event outlines the region affected.
This event was selected for Observatory production of map and GIS data products.This web page and associated image and map (GIS) files become the permanent Flood Observatory record of the flood.
As part of collaborations with other organizations, including
GEO and the Global Flood
Partnership, the Observatory's maps are made available here to the public.
Geotif versions and GIS files are also available. With attribution, maps and
data can be used freely for non-commercial purposes. With permission, they can
be used for commercial purposes. Consult the Creative Commons Attribution-NonCommercial-ShareAlike 4.0
International License and Robert.Brakenridge or Albert.Kettner (at
Colorado.edu) if questions. Attribution for this map when Sentinel SAR data are
used: "Dartmouth Flood Observatory at the University of Colorado, from satellite
data provided by NASA and Copernicus/European Space Agency". When using GIS data
(see below) provided to DFO from other sources, please acknowledge original
source.
NASA Landsat 8 and Copernicus/ESA Sentinel SAR data if used in this map were obtained from the the U.S. Geological Survey Hazards Data Distribution System. and the Sentinels Science Data hub, respectively. Landsat 8 is jointly managed by NASA and the United States Geological Survey. Copernicus is supported by the European Commission. MODIS data are obtained from the NASA NRT Global Flood Mapping facility (surface water extents) and from NASA Worldview (image files); SUOMI/VIIRS image data are also retrieved from NASA Worldview. Sentinel 1 SAR-based flood mapping is also contributed by Xinyi Shen and Qing Yang and the Rapid system at the University of Connecticut.
Flood extent files (Shp or Mapinfo) and geotif files supporting this Flood Event Map are located here.
These files may include high spatial resolution mapping such as from Sentinel or Landsat, or lower resolution files from MODIS. File names commonly include the sensor source (e.g., S1 for Sentinel 1, LS8 for Landsat, MODIS, Aqua, or Terra for MODIS) and the image date.
The NASA Earth Sciences Program, the Latin American Development Bank, the World Bank, the European Commission's Global Disaster Alert and Coordination System, GDACS, and Copernicus Emergency Management Service, the Google Earth Engine research awards program, the Committee on Earth Observation Satellites (CEOS) Disasters Working Group-Flood Pilot, the Japanese Space Agency, and the European Space Agency all have supported the Observatory's work via research grants and contracts or free satellite-derived data.
The Dartmouth Flood Observatory was founded in 1993 at Dartmouth College, Hanover, NH USA and moved to the University of Colorado, INSTAAR, CSDMS in 2010. The institutional support of both universities is gratefully acknowledged.
(counting since January 25, 2021)