


![]()
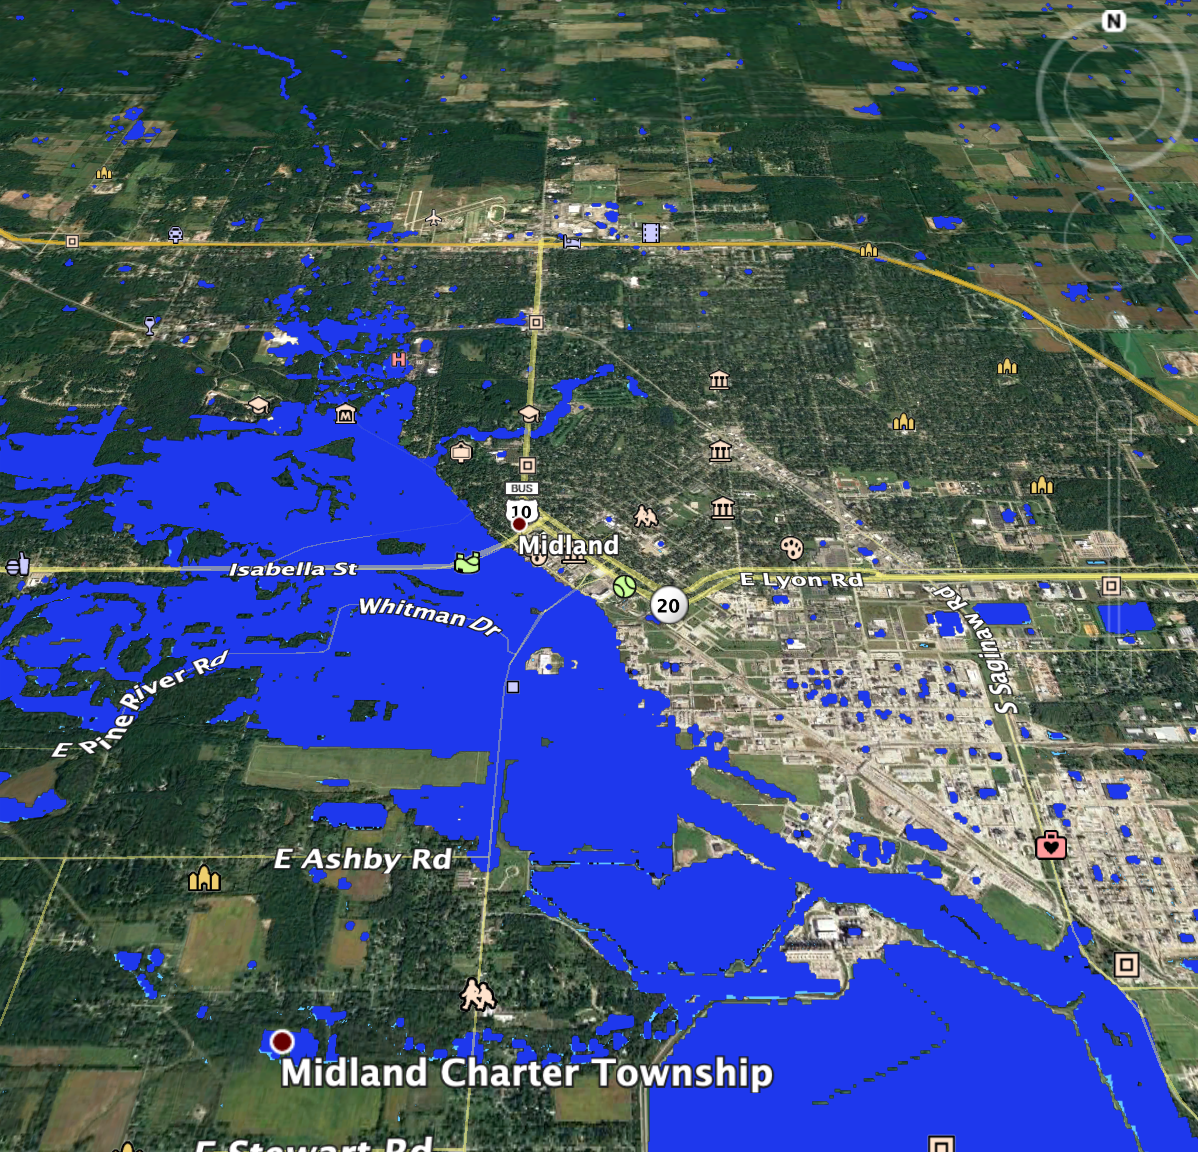
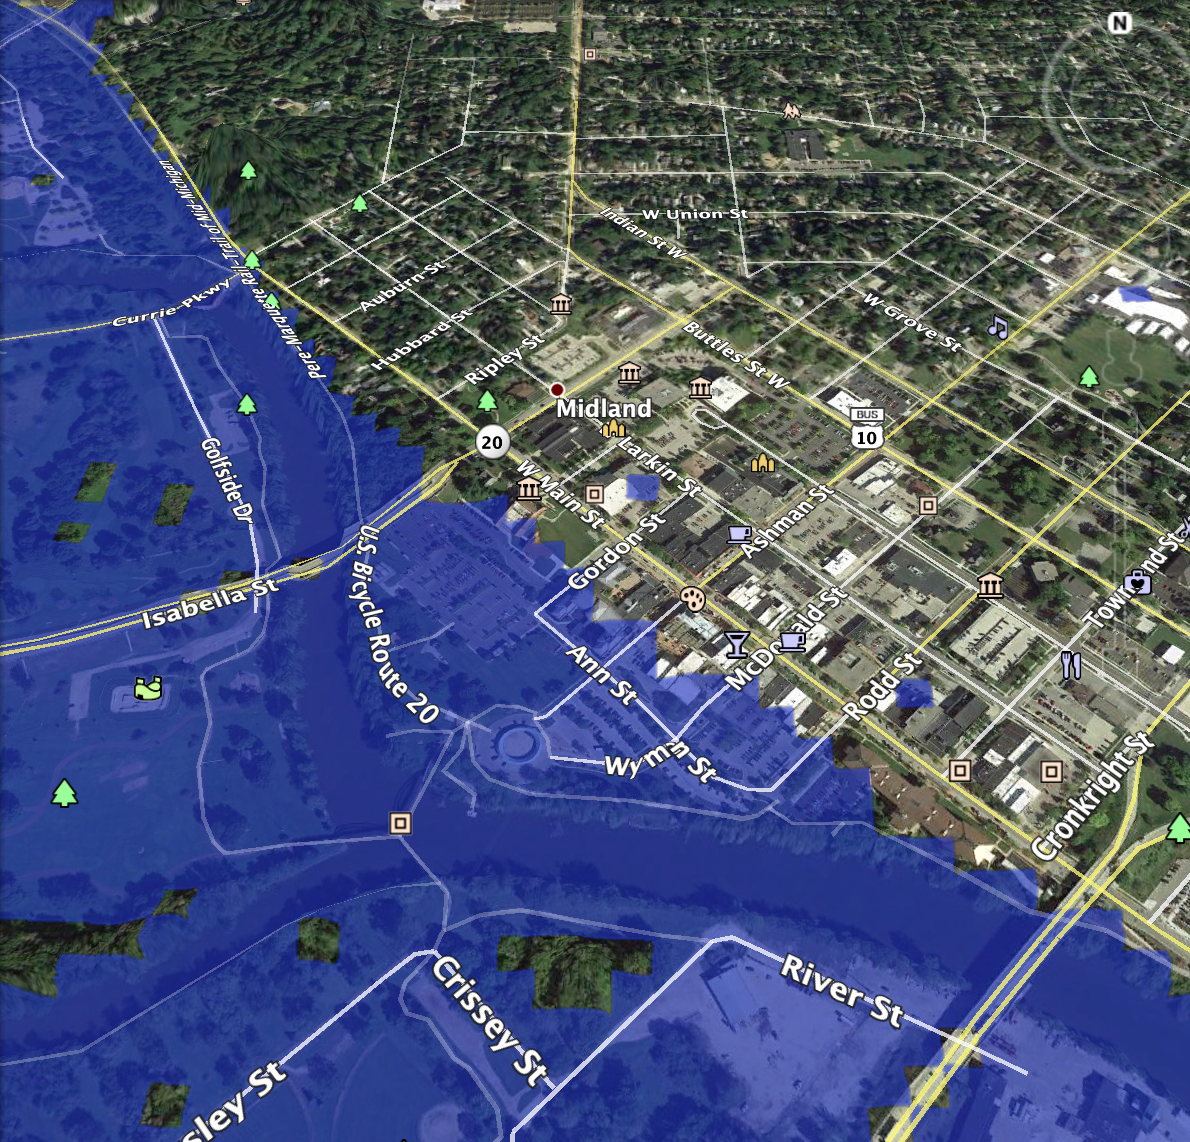
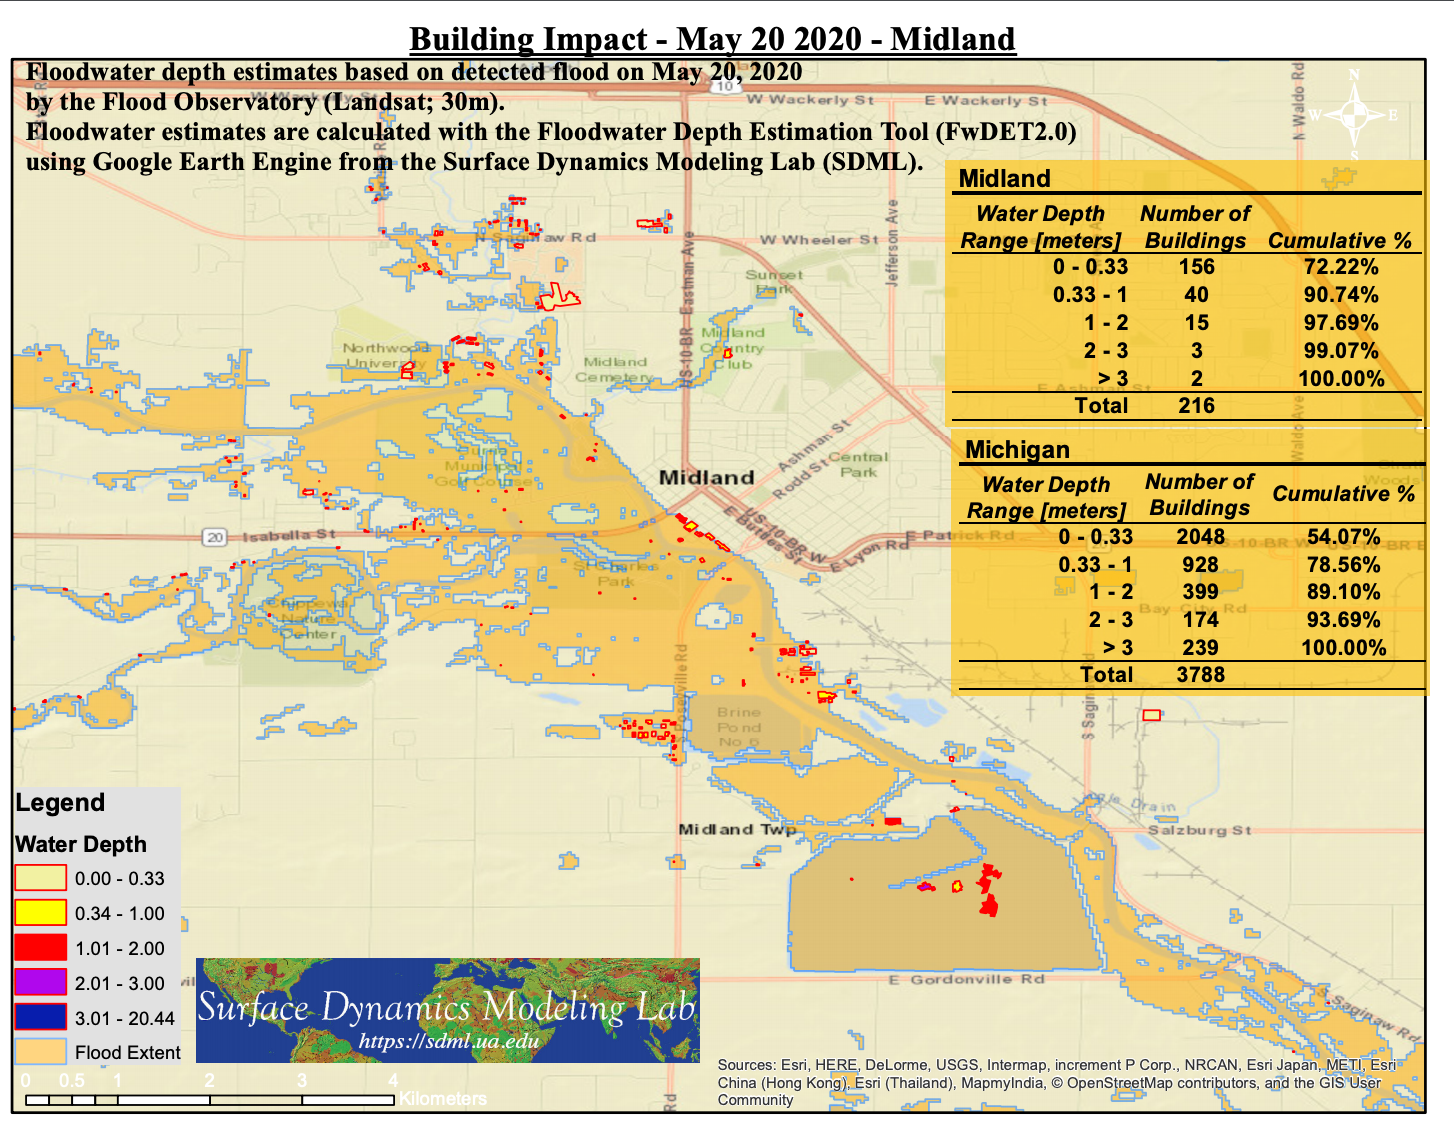
"USA – Thousands Told to Evacuate in Michigan After Dams Fail 20 May, 2020 by FloodList Governor Gretchen Whitmer declared an emergency for Midland County on 19 May after 2 dams failed. The Edenville and Sanford dams in Midland County were breached after heavy rain over the past few days and residents nearby have been told to evacuate immediately. “If you have not evacuated the area, do so now and get somewhere safe,” said Governor Whitmer. Several shelters have been set up in schools and public buildings to house those evacuating. Officials said that evacuation notices affect around 10,000 people from 3,500 homes in the towns of Edenville, Sanford and parts of the city of Midland. Governor Whitmer added: “This is unlike anything we’ve seen in Midland County. If you have a family member or loved one who lives in another part of the state, go there now. If you don’t, go to one of the shelters that have opened across the county. I want to thank the emergency responders, Michigan National Guard members, and the Michigan State Police on the ground helping residents evacuate. Stay safe, and take care of each other.”
Midland residents were also advised to seek higher ground as far as possible from the Tittabawassee river which is at Major Flood stage, according to the National Weather Service (NWS). NWS Detroit said: “Flash Flood Emergencies in effect for entire length of the Tittabawassee River in Midland county. Dangerous flash flooding ongoing!” The Tittabawassee in Midland is expected to crest on 20 May at around 38 feet / 11.58 metres, well above the record high of 33.9 feet / 10.33 metres set in September 1986. Major Flood stage here is 28 feet / 8.53 metres. ” Quoted from Flood List
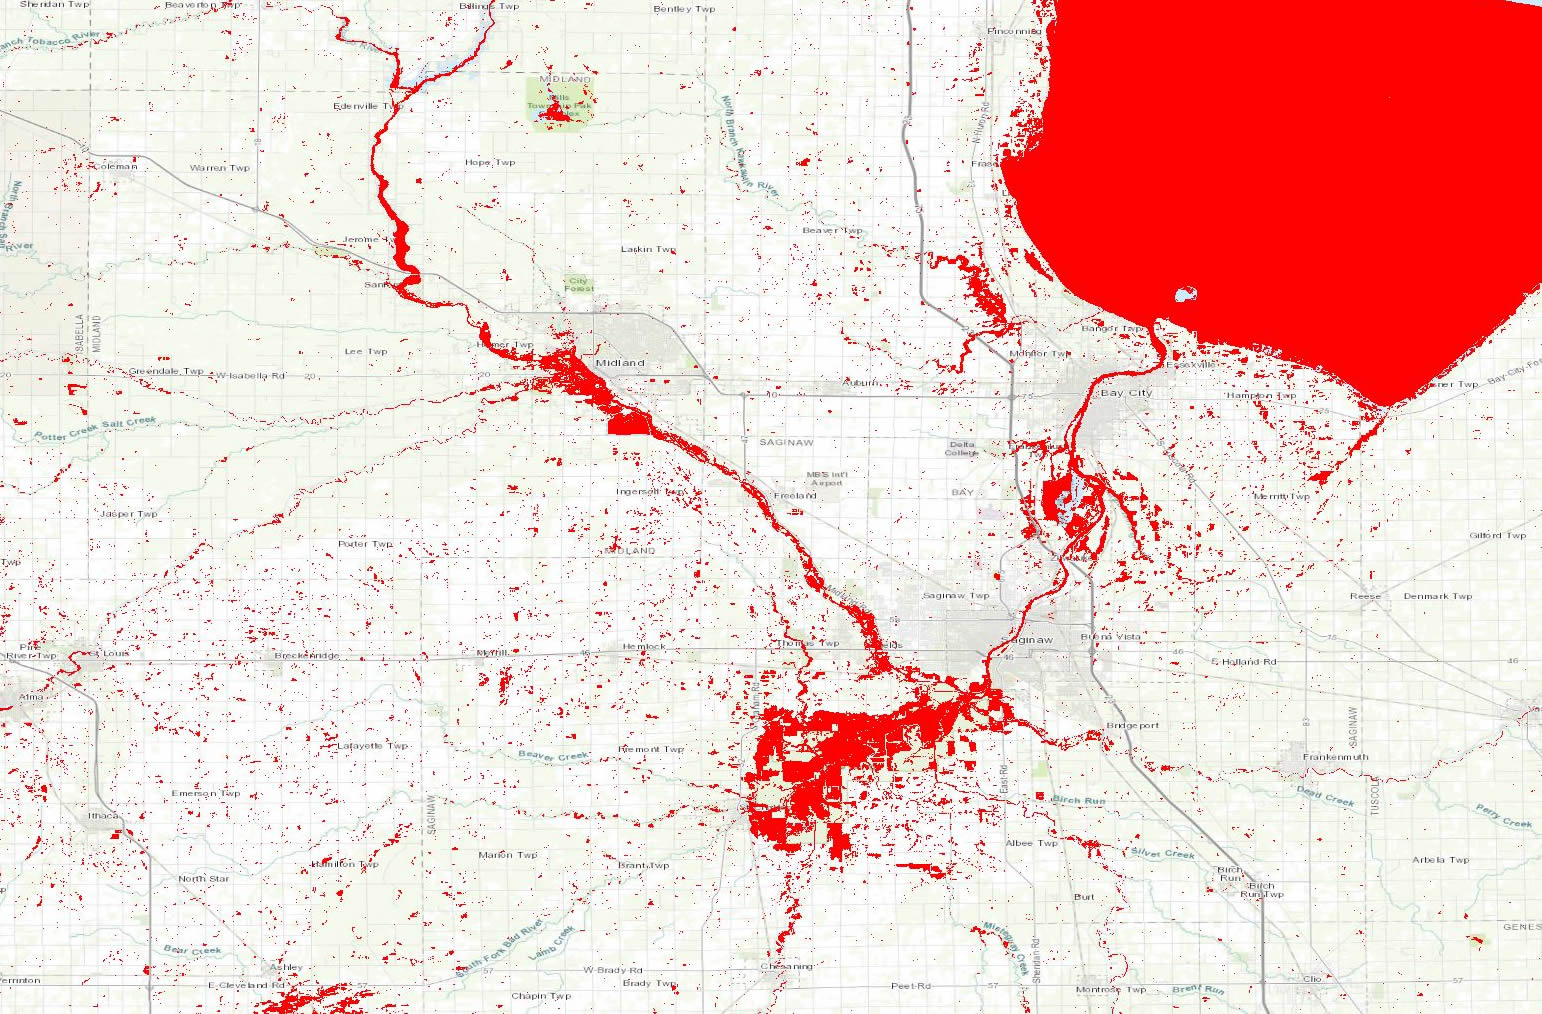
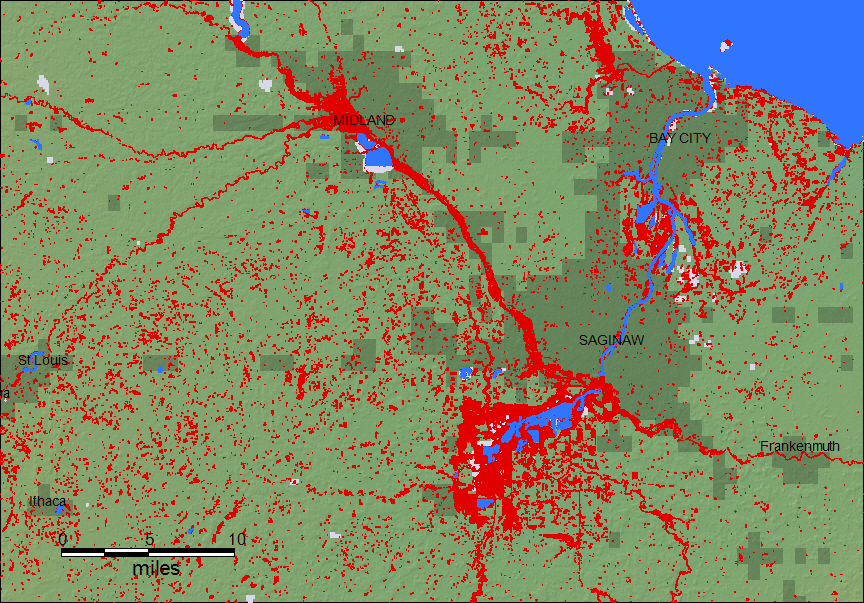
The Flood Observatory maintains a Global Active Archive of large flood events, 1985 to present. New major flood events are entered into this archive each week. A hand-drawn GIS polygon for each event outlines the region affected.
This event was selected for Observatory production of map and GIS data products.This web page and associated image and map (GIS) files become the permanent Flood Observatory record of the flood.
As part of collaborations with other organizations, including
GEO and the Global Flood
Partnership, the Observatory's maps are made available here to the public.
Geotif versions and GIS files are also available. With attribution, maps and
data can be used freely for non-commercial purposes. With permission, they can
be used for commercial purposes. Consult the Creative Commons Attribution-NonCommercial-ShareAlike 4.0
International License and Robert.Brakenridge or Albert.Kettner (at
Colorado.edu) if questions. Attribution for this map when Sentinel SAR data are
used: "Dartmouth Flood Observatory at the University of Colorado, from satellite
data provided by NASA and Copernicus/European Space Agency". When using GIS data
(see below) provided to DFO from other sources, please acknowledge original
source.
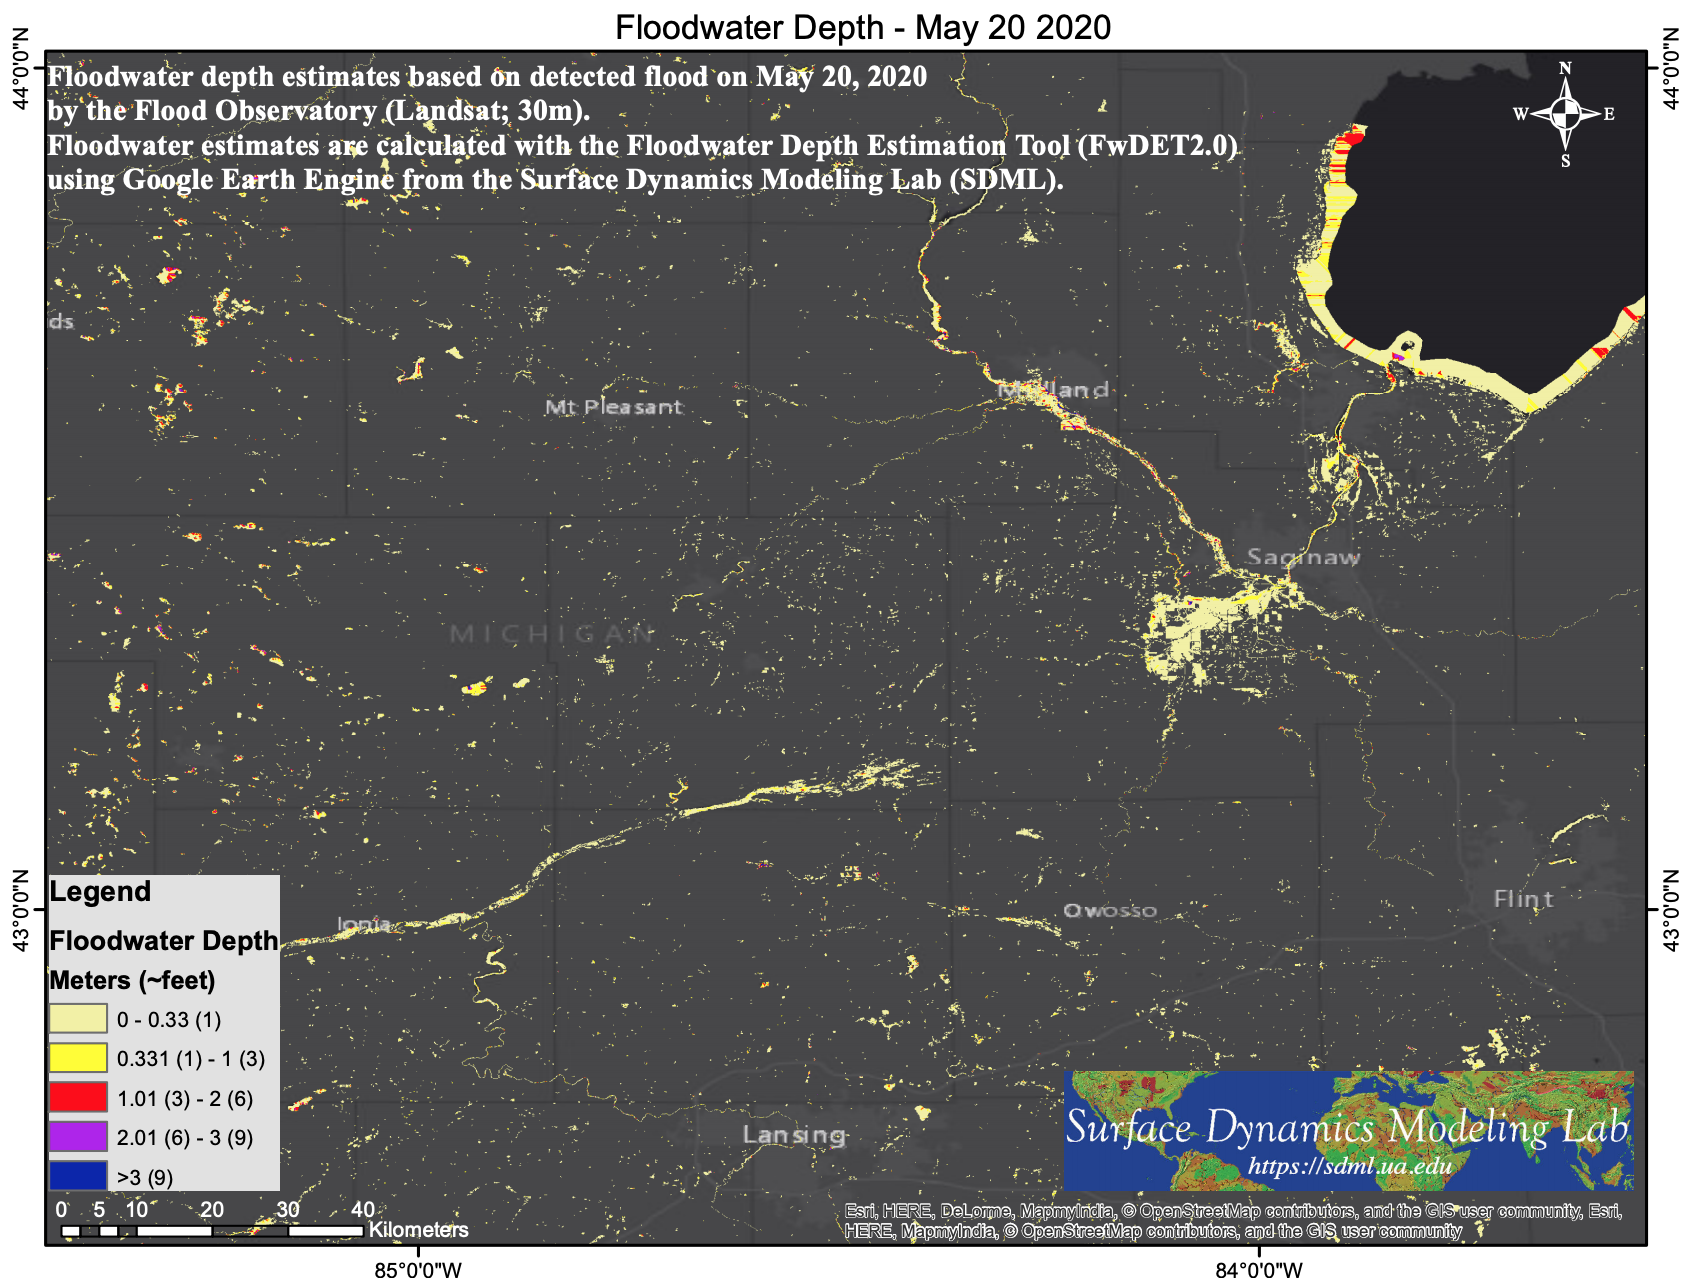
NASA Landsat 8 and Copernicus/ESA Sentinel SAR data if used in this map were obtained from the the U.S. Geological Survey Hazards Data Distribution System. and the Sentinels Science Data hub, respectively. Landsat 8 is jointly managed by NASA and the United States Geological Survey. Copernicus is supported by the European Commission. MODIS data are obtained from the NASA NRT Global Flood Mapping facility (surface water extents) and from NASA Worldview (image files); SUOMI/VIIRS image data are also retrieved from NASA Worldview.
Flood extent files (Shp or Mapinfo) supporting this Flood Event Map are located here.
These files may include high spatial resolution mapping such as from Sentinel or Landsat, or lower resolution files from MODIS. File names commonly include the sensor source (e.g., S1 for Sentinel 1, LS8 for Landsat, MODIS, Aqua, or Terra for MODIS) and the image date.
The NASA Earth Sciences Program, the Latin American Development Bank, the World Bank, the European Commission's Global Disaster Alert and Coordination System, GDACS, and Copernicus Emergency Management Service, the Google Earth Engine research awards program, the Committee on Earth Observation Satellites (CEOS) Disasters Working Group-Flood Pilot, the Japanese Space Agency, and the European Space Agency all have supported the Observatory's work via research grants and contracts or free satellite-derived data.
The Dartmouth Flood Observatory was founded by Robert Brakenridge in 1993 at Dartmouth College, Hanover, NH USA and moved to the University of Colorado, INSTAAR, CSDMS in 2010. The institutional support of both universities is gratefully acknowledged.
(counting since May 20, 2020)