

On 09 September 2024 at 06:00, Typhoon YAGI passed over central and northern Philippines, Hainan island and Guangdong province, southern China, and northernVietnam and caused large rainfall, floods and landslides that have resulted in many casualties. The combined effects of the monsoon and tropical disturbances have caused flooding and flash floods in northern Laos and Thailand. In Vietnam, the authorities have reported, as of 11 September, 127 fatalities, approximately 54 people still missing, more than 750 injured and over 52,000 evacuated people across northern provinces. Quang Ninh and Hai Phong provinces are the worst affected. Three provinces have declared emergencies: Lao Cai, Tuyen Quang and Yen Bai. UNICEF-supported facilities hosting a range of activities for children — were also flooded and partially damaged. See also https://en.wikipedia.org/wiki/Typhoon_Yagi.
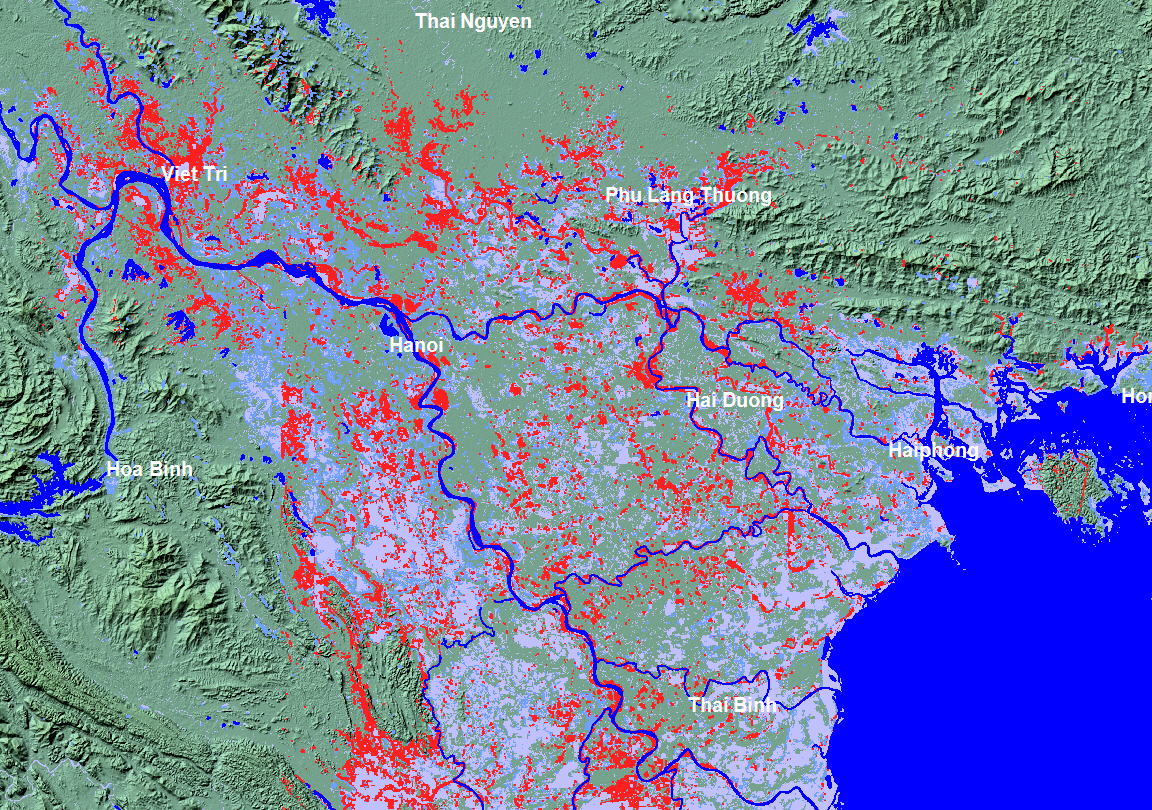
Medium blue: DFO Maximum Observed Flooding, all sensors, 1993 to present. Light blue/gray: Landsat maximum water over 37 years and DFO Mean Annual Flood. Much of this land floods nearly every year. Dark blue: NASA Shuttle Water Boundary Data (winter, 2000). Red: new water on September 12, 2024 compared to late August. Source: ESA/Copernicus S1 SAR data. Geotif version available upon request: Robert.Brakenridge@Colorado.edu . Area around Hoa Binh not yet mapped.

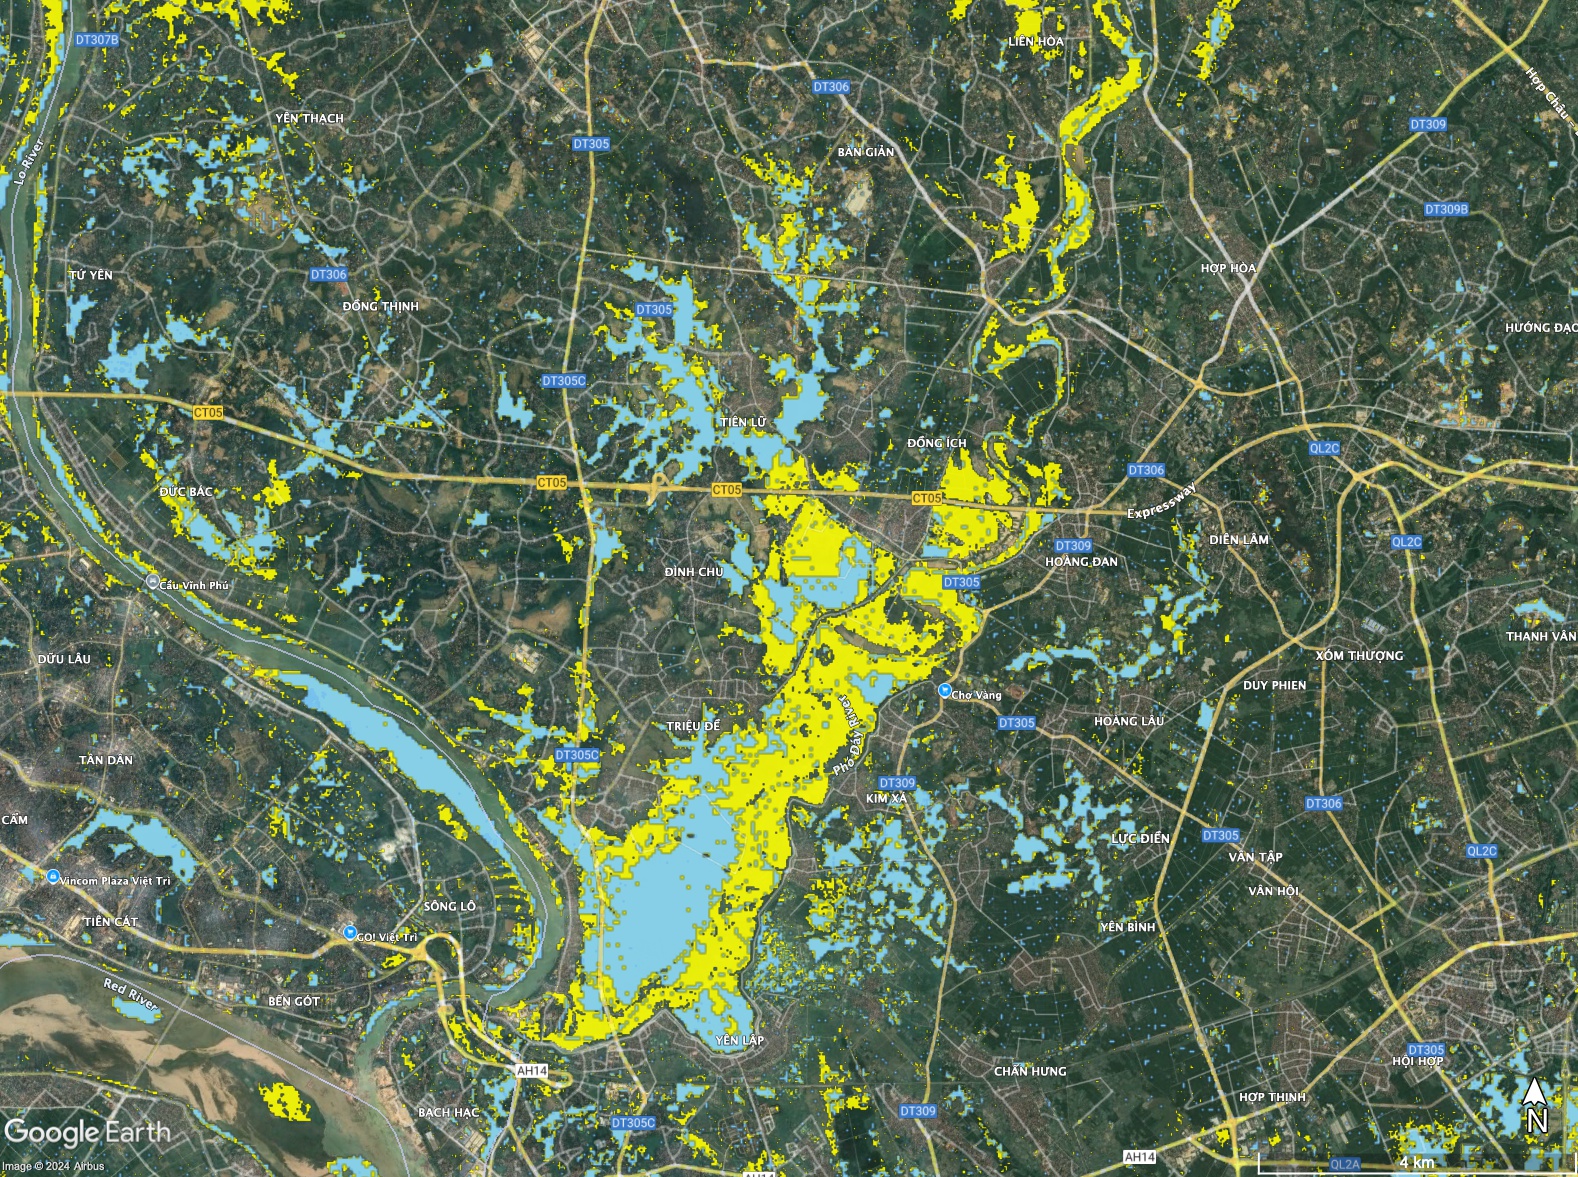
Inundation map from JPL showing flooding (yellow) on 12 Sep 2014 and pre-existing surface water on 31 Aug 2024 derived from Sentinel-1 SAR data using the Depolarization Reduction Algorithm for Global Observations of inundatioN (DRAGON) developed and implemented at JPL. In this map, the inundated areas are overlaid with the road network on the Google Earth base map. SRTM Water Bodies data were used to make the known water bodies (circa 2000) transparent to reveal the underlying features.
Acknowledgments: The research at the Jet Propulsion Laboratory (JPL), California Institute of Technology, is supported by the NASA Land Cover and Land Use Change (LCLUC) Program under a contract with NASA (80NM0018D0004). We acknowledge the Copernicus Programme and the European Space Agency for the use of Sentinel-1 SAR data

NASA Automated Near Real Time MODIS-based Flood Mapping, from the global daily update (screeen shot). Courtesty Dr. Dan Slayback, NASA GSFC. "I had looked a few days ago but thought it was too cloudy for any MODIS...but maybe that was before the 13th as now I see we did capture some flooding 13-16 in the 1-day product in particular. Screenshot below for the 14th from our prototype flood view. More details and link to data source to follow.
.png)
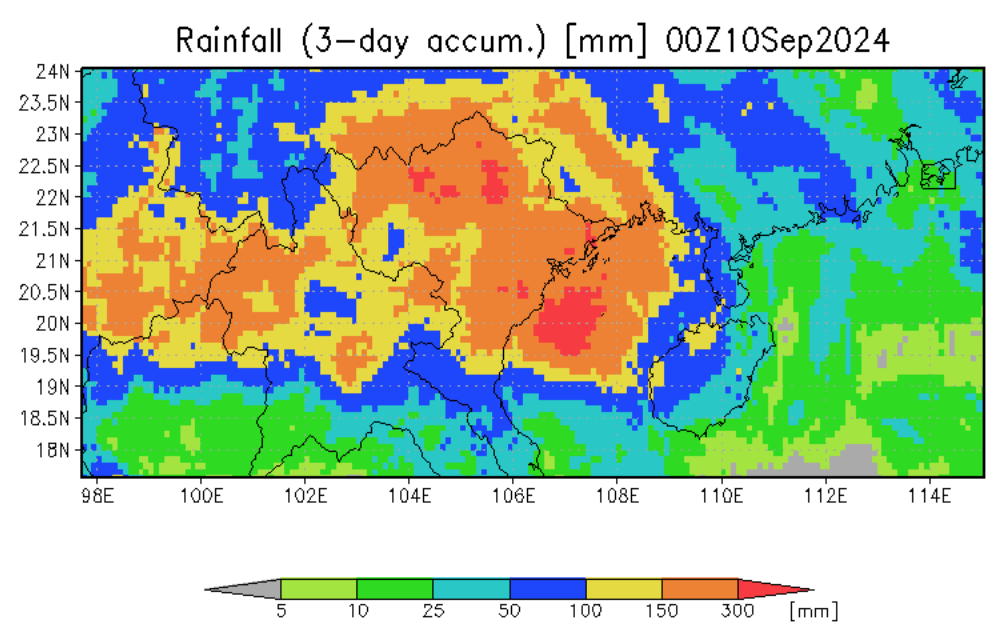
Satellite rainfall (NASA IMERG), coarse resolution flood calculation, fine resolution inundation/depth calculation from U.of Maryland GFMS. Courtesy Dr. Robert Adler, University of Maryland.

This event was selected for Observatory production of map and GIS data products. Updating of the Flood Event Archive has been discontinued; 2024 events are designated by year and geographic area.
We anticipate adding further maps. NASA Landsat 8 and Copernicus/ESA Sentinel SAR data if used are obtained from the the U.S. Geological Survey Hazards Data Distribution System. and the Sentinels Science Data hub, respectively. Landsat 8 is jointly managed by NASA and the United States Geological Survey. Copernicus is supported by the European Commission. MODIS data are obtained from the NASA NRT Global Flood Mapping facility (surface water extents) and from NASA Worldview (image files); SUOMI/VIIRS image data are also retrieved from NASA Worldview.
Flood extent files (Shp or Mapinfo) and geotif files supporting this Flood Event Map can be located here after user request.
These files may include high spatial resolution mapping such as from Sentinel or Landsat, or lower resolution files from MODIS. File names commonly include the sensor source (e.g., S1 for Sentinel 1, LS8 for Landsat, MODIS, Aqua, or Terra for MODIS) and the image date.
The Dartmouth Flood Observatory was founded in 1993 at Dartmouth College, Hanover, NH USA and moved to the University of Colorado, INSTAAR, CSDMS in 2010. The institutional support of both universities is gratefully acknowledged. The present work is supported via NASA grants to S. V. Nghiem, Jet Propulsion Laboratory and to F. Policelli, NASA GSFC
(counting since September 18, 2024)