


![]()
The International Charter has been activated by UNOSAT on behalf of the UN World Food Programme (WFP) for flooding in Bangladesh. Extensive flooding has affected over two million people in north-eastern Bangladesh, following weeks of heavy monsoon rainfall that have submerged homes and devastated farmland. Much of the Sylhet district (75 percent), including over half the area's crops and paddy fields, are submerged, threatening livelihoods and food security. According to reports from the water development board, widespread flooding was triggered by prolonged torrential rain and water runoff from the hilly regions upstream on the border with India, which caused four rivers to swell beyond their danger marks. Water and sanitation infrastructure across the region has suffered major damage. Hundreds of schools were flooded. Dozens of child protection community hubs — UNICEF-supported facilities hosting a range of activities for children — were also flooded and partially damaged. Bangladesh is used to flooding, but climate change is making floods more intense and less predictable, making it impossible for families to stay safe, let alone plan ahead," said Khondoker Golam Tawhid, Programme Head, Disaster Risk Management Programme, BRAC. The worst-affected areas are receiving emergency health, nutrition, safe water and sanitation, from BRAC, funded by UNICEF. https://disasterscharter.org/web/guest/activations/-/article/flood-in-bangladesh-activation-888-
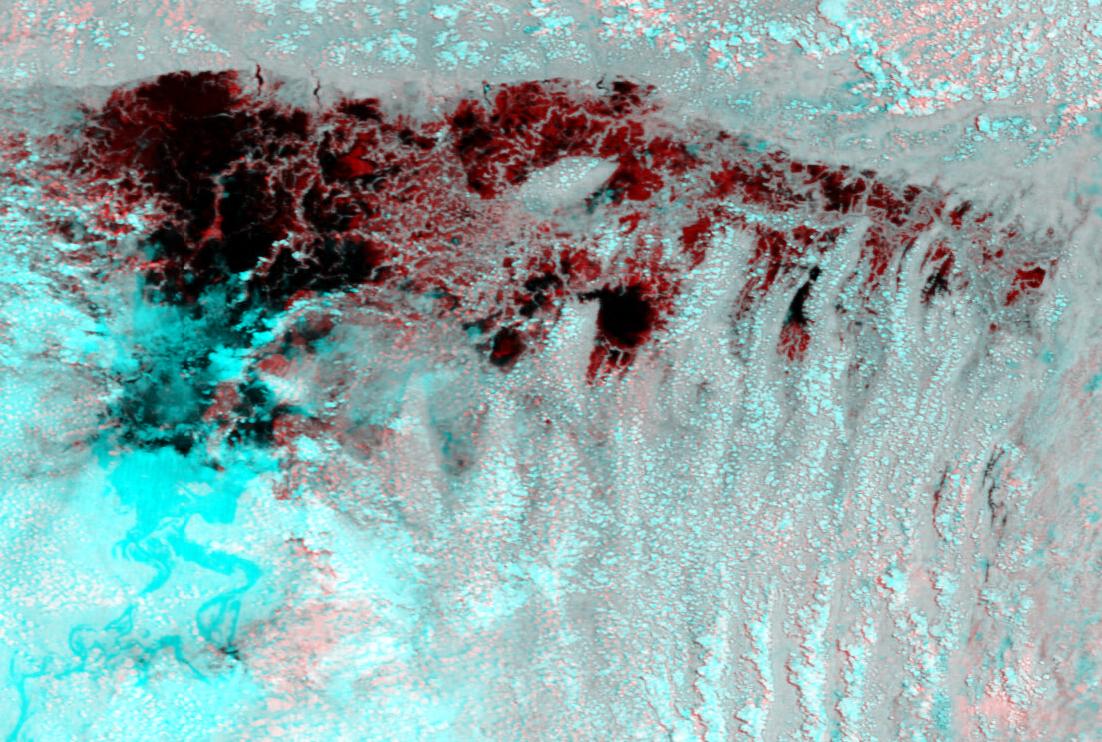
Multi-temporal color composite, showing normal monsoonal flooding in black and unusual flooding in red. Fllood image date:: June 26, 2024; comparison image August 5, 2021. NASA MODIS Terra Band 2 false color composite., Geotif version available upon request: Robert.Brakenridge@Colorado.edu
Unusual flooding, June 26, 2024 in red, mean annual flood in light blue, and permanent surface water, dark blue. Red flood layer is also available as a .shp file.

June 26, 2024: two sample views below of the Google Earth kmz file available here. In these examples, the unusual flooding is shown in blue; the flood information is from the above.


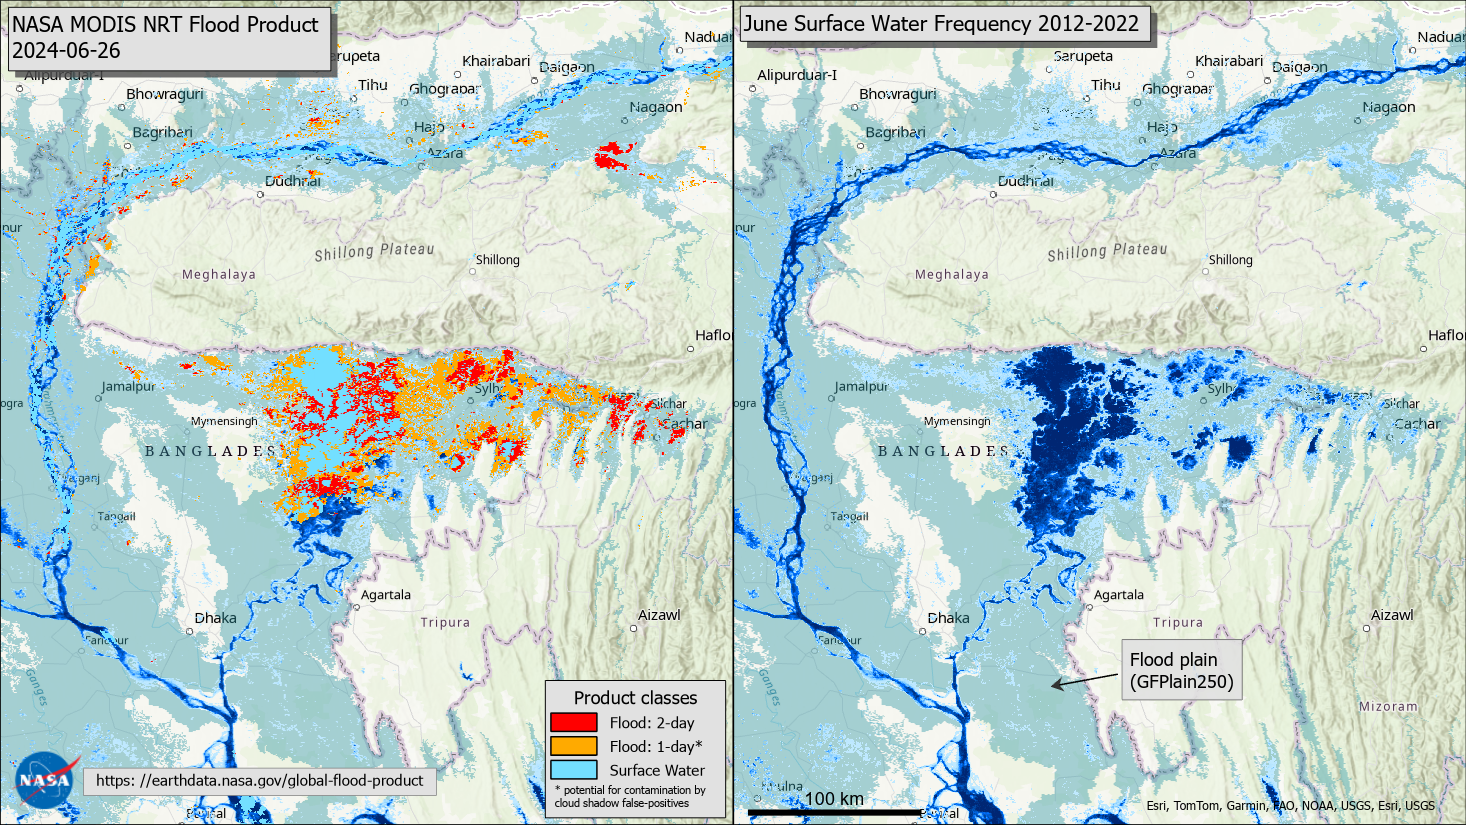
MODIS-based flood map from 26 June, courtesy Dr. Dan Slayback, NASA GSFC. Left: shows both 1 and 2-day products. 2-day includes observations from 25 June, and is less likely to have cloud shadow false-positives. Flooding is in red for 1-day product. On right, and background on left, is the frequency of water detection (flood or not) over 11 years from MODIS information, with the GFPlain 250 floodplain dataset also shown for reference.
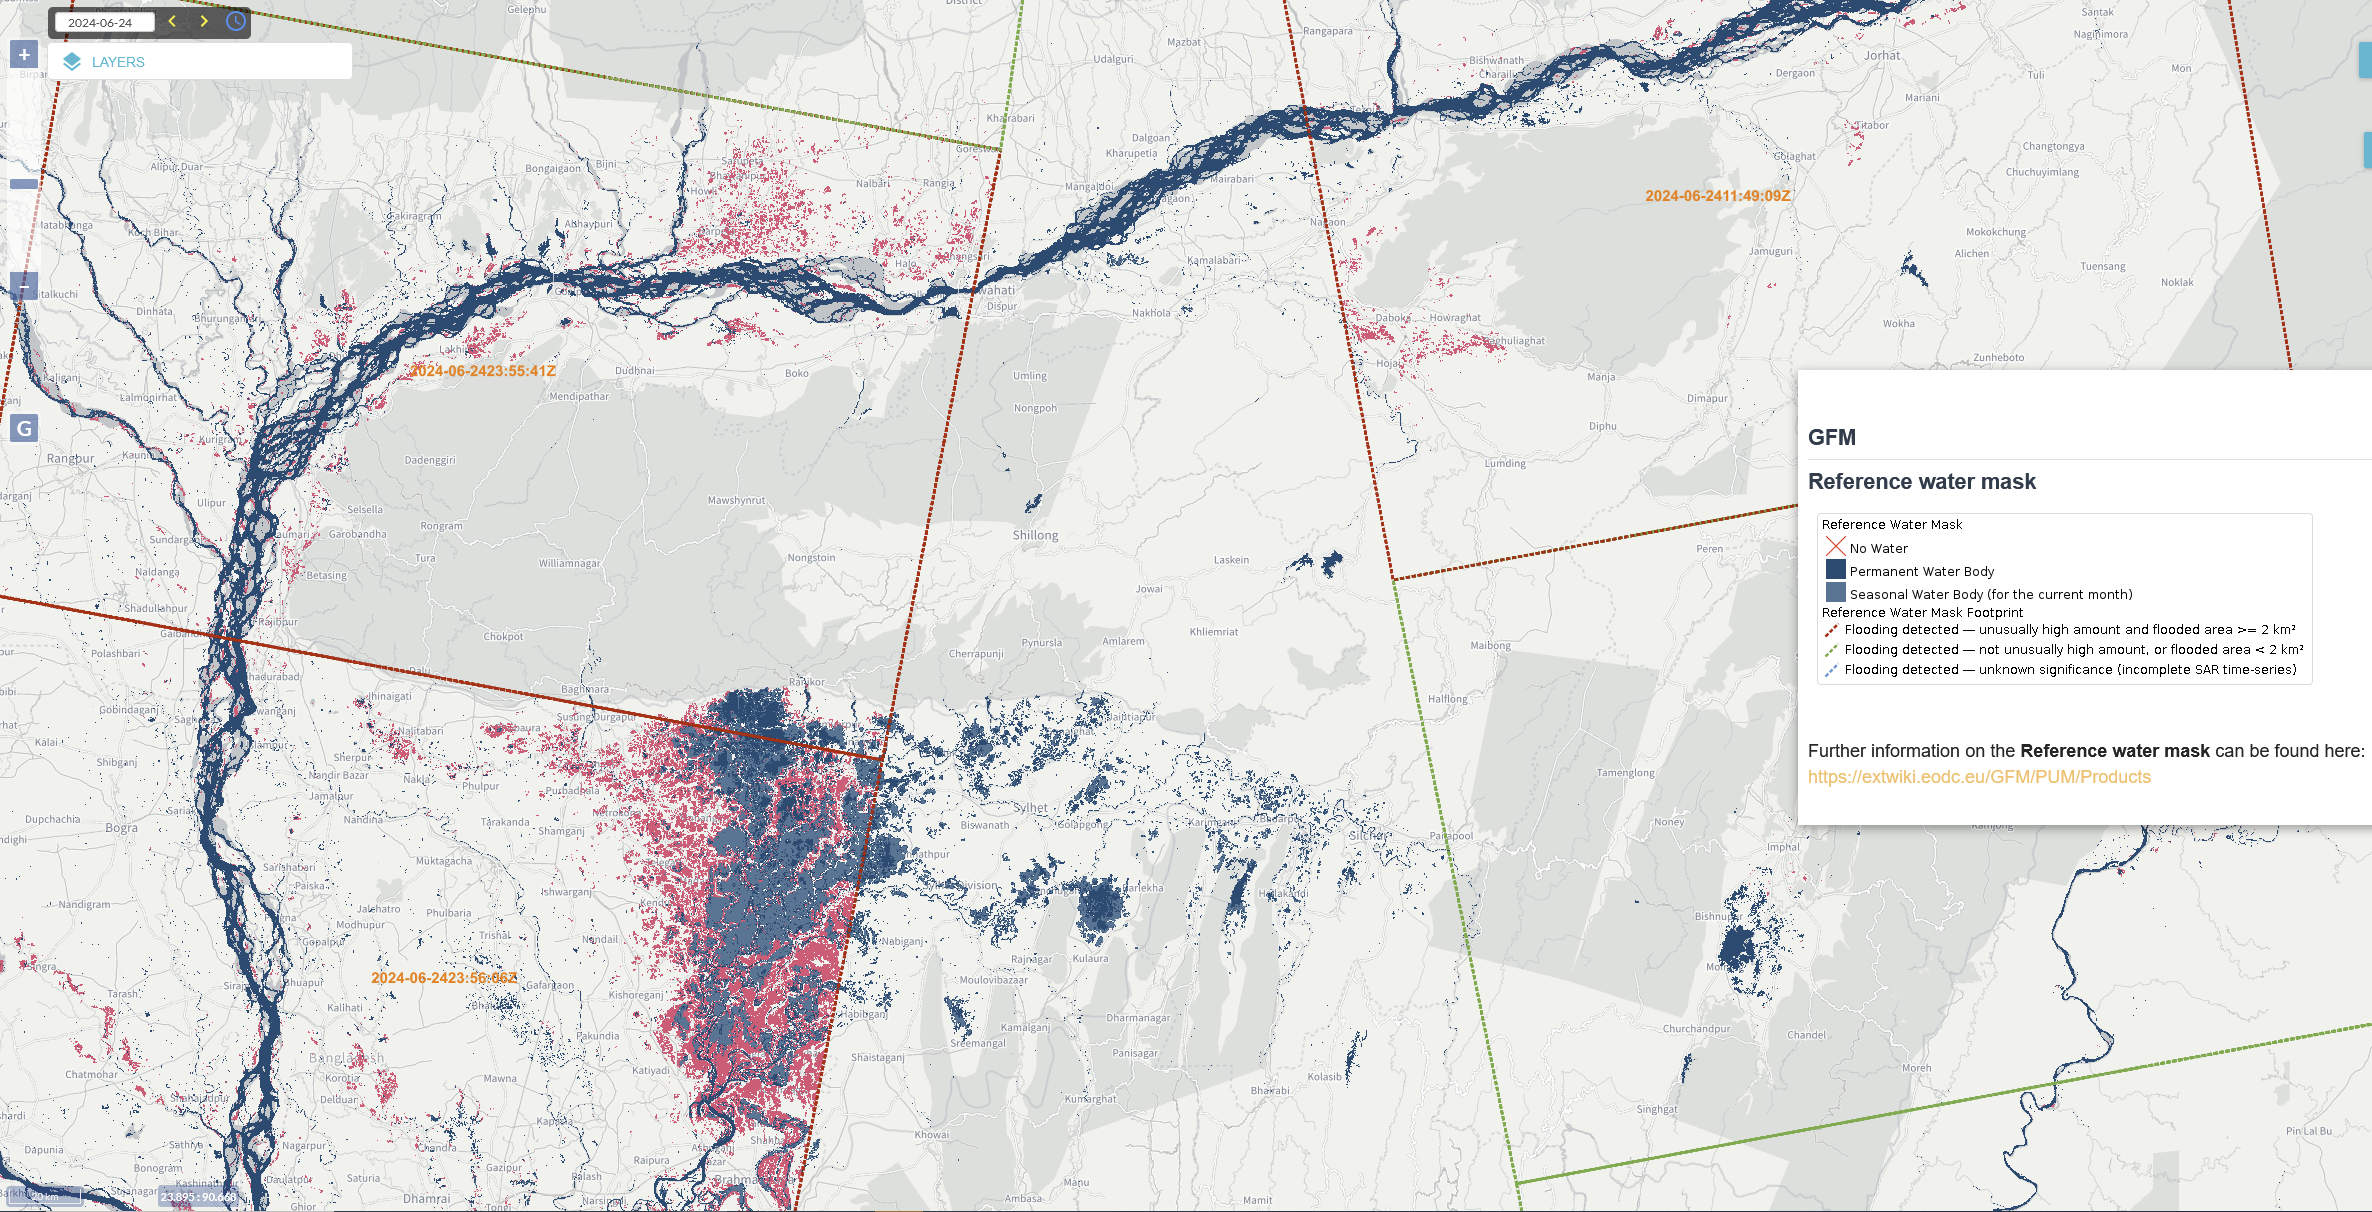
Two screenshots from the latest Sentinel 1 acquisitions over the area as processed by the CEMS Global Flood Monitoring (24 June and 22 June). Courtesy Peter Salomon at the European Commission/JRC. Access and download the CEMS GFM maps via the CEMS GloFAS map viewer and also via an API (https://extwiki.eodc.eu/en/GFM )
CEMS. GFM flood map for 24 June 2024. Magenta: flooded areas - dark blue: permanent water - lighter blue: seasonal water for current month.
CEMS GFM flood map for 22 June 2024 - (Magenta: flooded areas - dark blue: permanent water - lighter blue: seasonal water for current month)
.png)
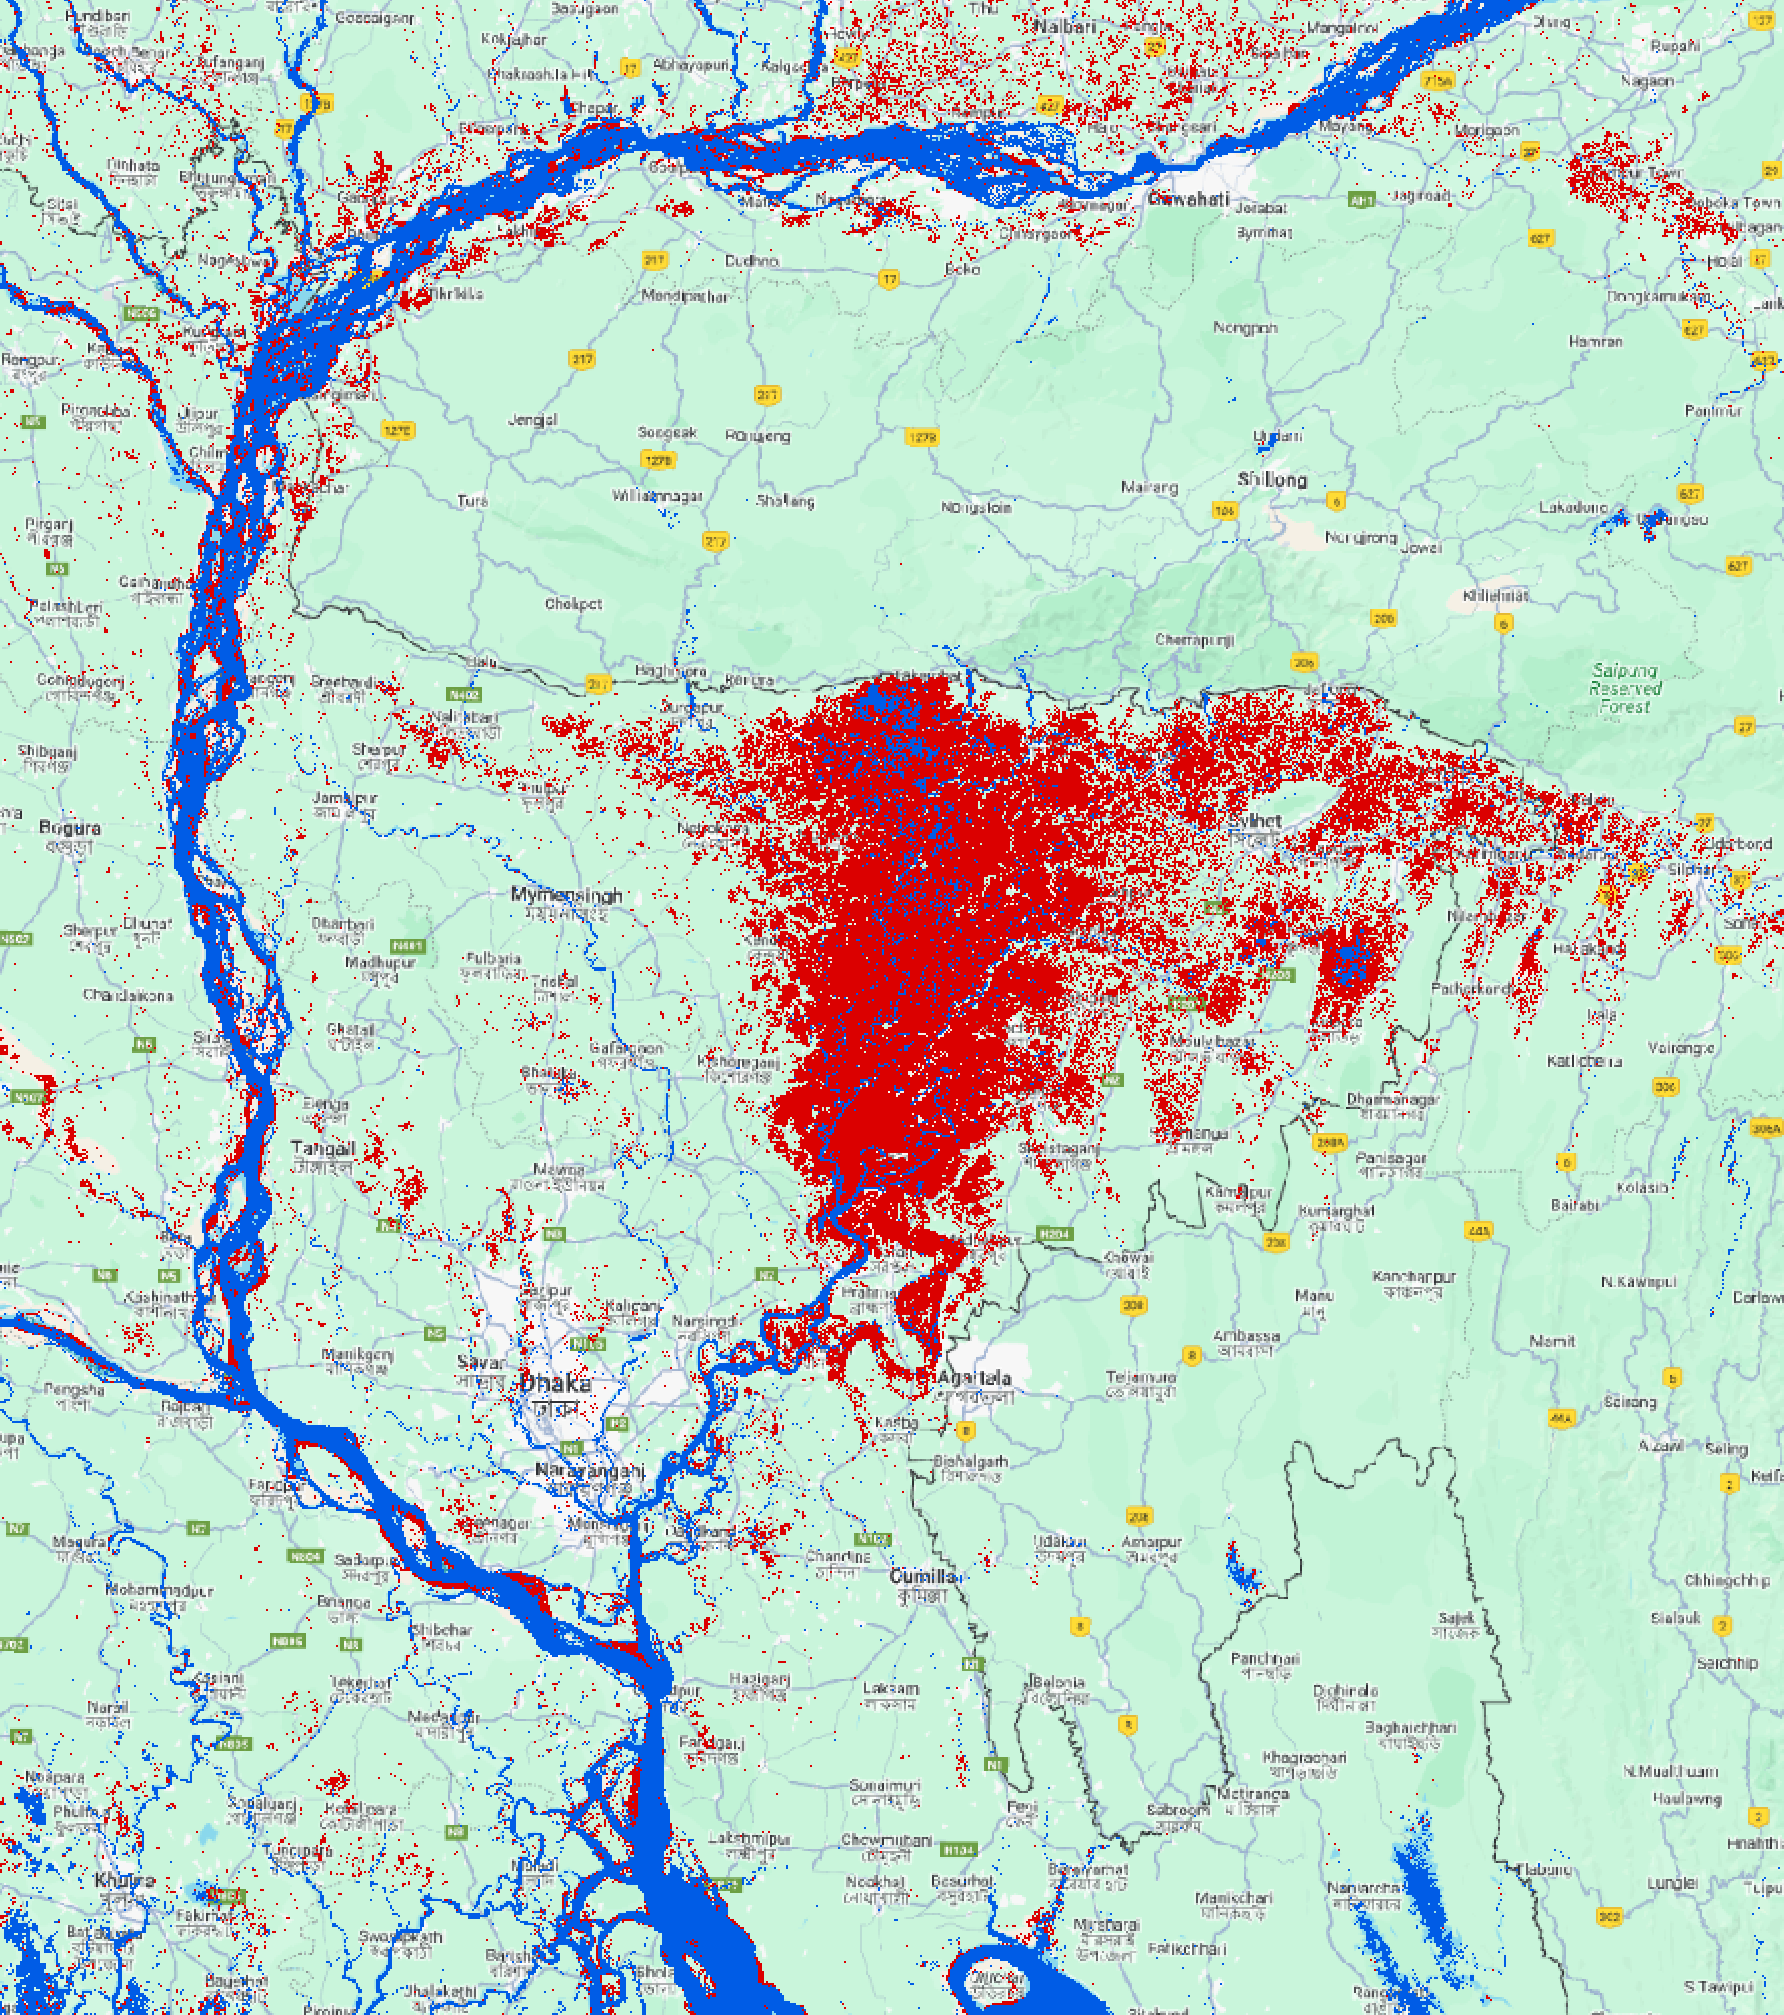
Merged floodwater inundation June 18-24, using RAPID system derived from Sentinel-1 SAR, Courtesy “Henry” Qing Yang, Ph.D., School of Freshwater Sciences, University of Wisconsin-Milwaukee. Red: floodwater. Blue: reference permanent water. Please also find the raster files in Geotiff formats from:
https://rapid-nrt-flood-maps.s3.amazonaws.com/Global_Flood_Event/Bangladesh_2024/RAPID_Bangladesh_Jun18-24_2024.zip.
The screenshot below is flood depth for June 19, which is based on one Sentinel-1 scene that covered the main flooded areas in Bangladesh and Copernicus GlO-30 topography. Courtesy Dan Tian and Prof. Sagy Cohen at the University of Alabama
.png)
River Watch time series of discharge at SGR 31238; location shown in second graphic provided at top of this page. On June 24 at this location, discharge and flooding was only at about the normal (r=1.5 year level). However, comparison of the June 26 MODIS image to August 5, 2021 MODIS image indicated the red areas (top two images), indicating that higher-than-normal flooding is underway.

This event was selected for Observatory production of map and GIS data products. Updating of the Flood Event Archive has been discontinued; 2024 events are designated by year and geographic area.
We anticipated adding further maps. NASA Landsat 8 and Copernicus/ESA Sentinel SAR data if used are obtained from the the U.S. Geological Survey Hazards Data Distribution System. and the Sentinels Science Data hub, respectively. Landsat 8 is jointly managed by NASA and the United States Geological Survey. Copernicus is supported by the European Commission. MODIS data are obtained from the NASA NRT Global Flood Mapping facility (surface water extents) and from NASA Worldview (image files); SUOMI/VIIRS image data are also retrieved from NASA Worldview.
Flood extent files (Shp or Mapinfo) and geotif files supporting this Flood Event Map can be located here after user request.
These files may include high spatial resolution mapping such as from Sentinel or Landsat, or lower resolution files from MODIS. File names commonly include the sensor source (e.g., S1 for Sentinel 1, LS8 for Landsat, MODIS, Aqua, or Terra for MODIS) and the image date.
The Dartmouth Flood Observatory was founded in 1993 at Dartmouth College, Hanover, NH USA and moved to the University of Colorado, INSTAAR, CSDMS in 2010. The institutional support of both universities is gratefully acknowledged. The present work is supported via a NASA grant to F. Policelli, Principal Investigator, NASA GSFC.
(counting since July 26, 2024)