


![]()
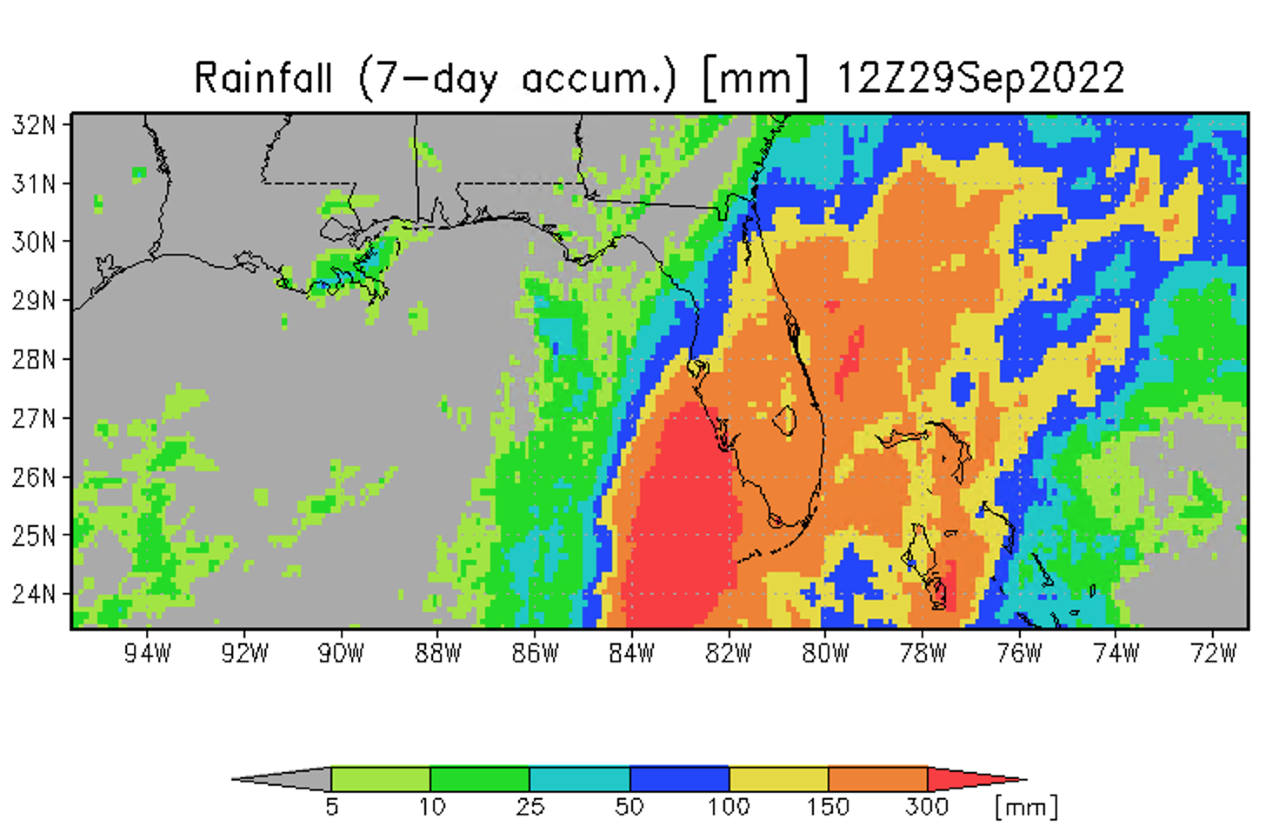
"Hundreds of people have been rescued from flooded homes following the passage of Hurricane Ian in Florida, USA. As many as 27 fatalities have been reported as search and rescue teams continue to look for those unaccounted for. Some ports, airports and rail services are still closed and roads have been closed in at least 70 locations. Around 1.6 million people are still without power and Boil Water Notices have been issued for 47 areas.” On October 4, the death toll exceeded 100. See Flood List.
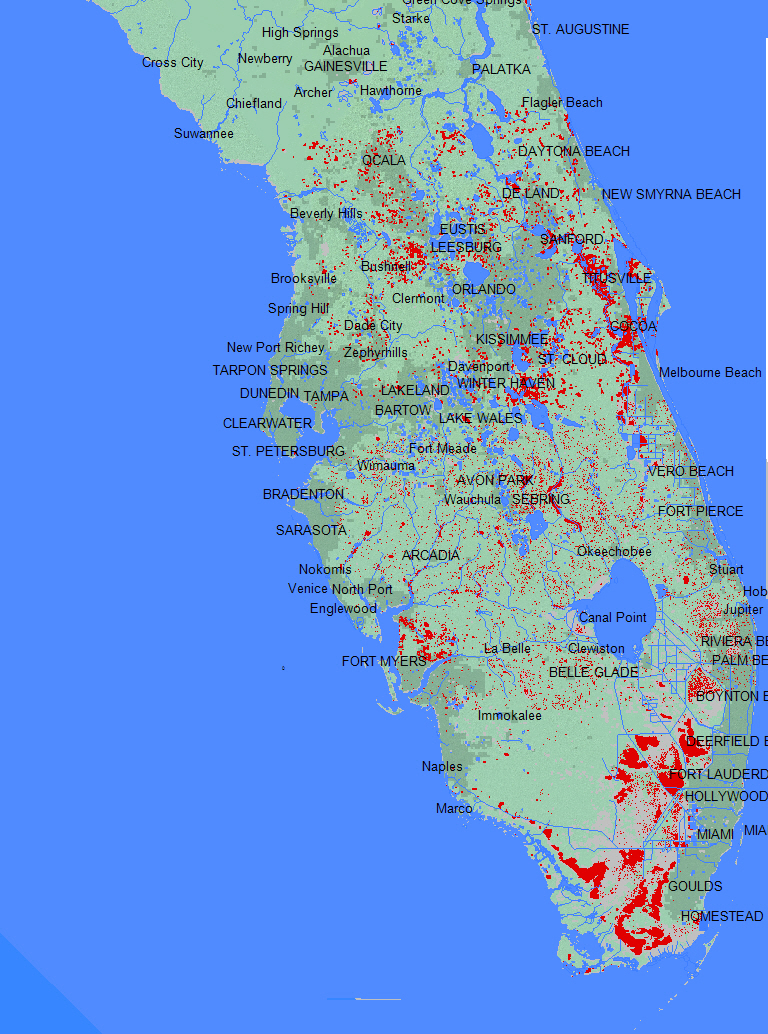
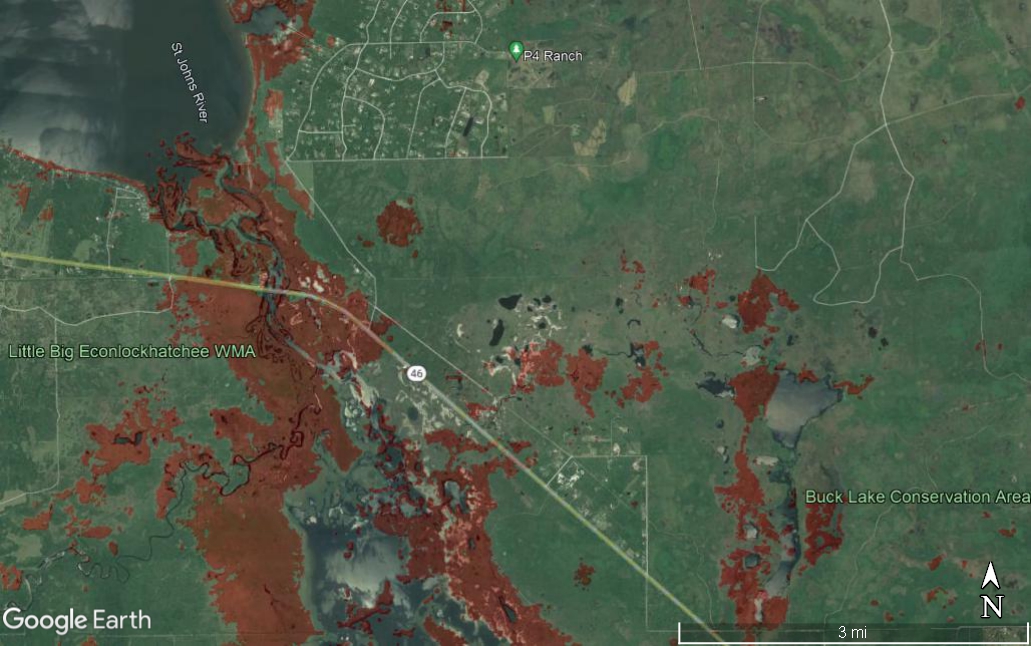
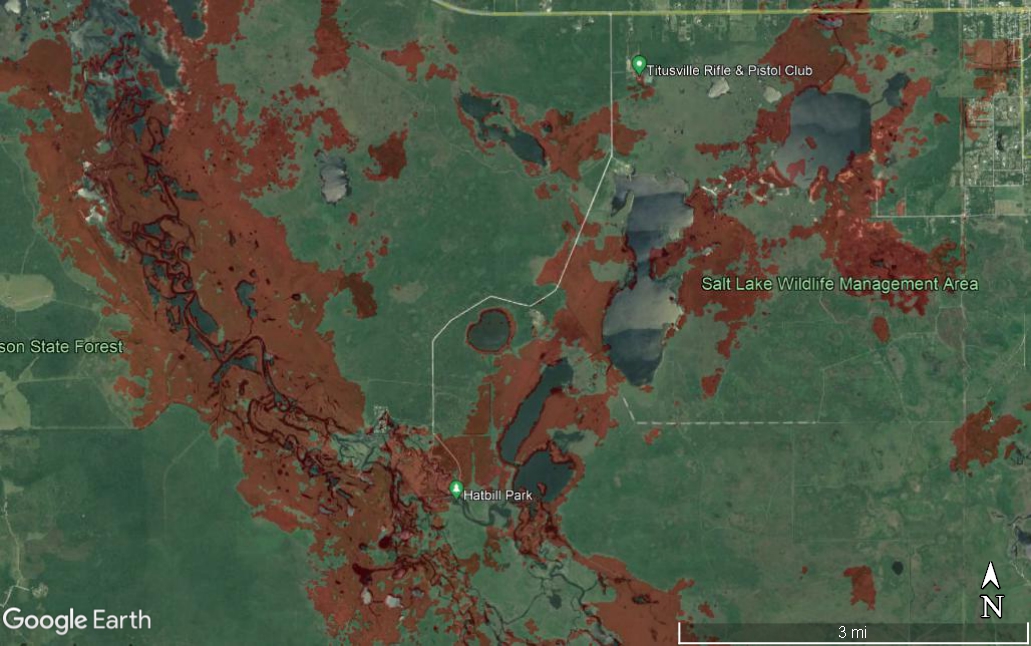
Results from the Global Flood Monitoring System (GFMS) at ESSIC,, University of Maryland
Mapping is still in progress October 6, 2022
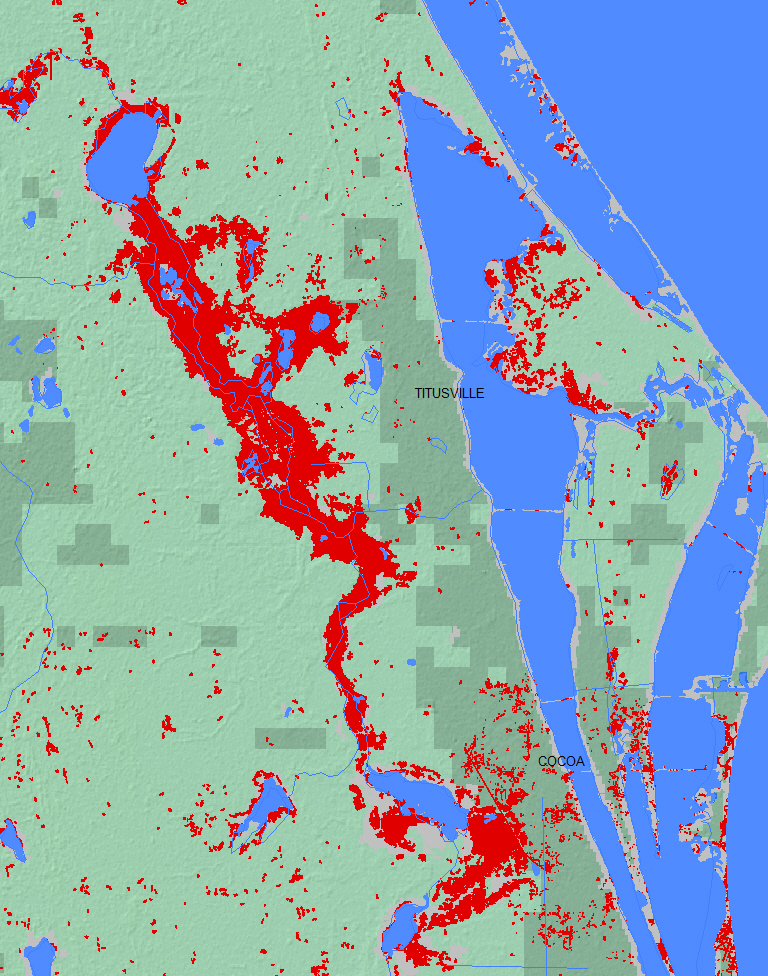
Light gray: previously mapped flood events. Dark gray: urban and suburban areas. Red: flooding.
Link to Simplified large geotif file
The Flood Observatory maintains a Global Active Archive of large flood events, 1985 to present. This event was selected for Observatory production of map and GIS data products.This web page and associated image and map (GIS) files become the permanent Flood Observatory record of the flood.
As part of collaborations with other organizations, including
GEO and the Global Flood
Partnership, the Observatory's maps are made available here to the public.
Geotif versions and GIS files are also available. Attribution for our mapping results when Sentinel SAR data are
used: "Dartmouth Flood Observatory at the University of Colorado, from Copernicus/European Space Agency Sentinel 1 SAR data". Very high spatial resolution mapping is from Planetscope satellite data licensed to NASA by Planet Labs, PBC and provided by the NASA Flood SensorWeb. When using GIS data identifed as provided to DFO from other sources, please acknowledge original
sources. The NASA Earth Sciences Division provided funding to University of Colorado for this work,and as conducted in collaboration with Dr. Fritz Policelli at NASA Goddard Space Flight Center.
NASA Landsat 8 (30 m spatial resolution) and Copernicus/ESA Sentinel SAR(~ 10 m resolution) data if used in this map are from the the U.S. Geological Survey Hazards Data Distribution System. and the Sentinels Science Data hub, respectively. Landsat 8 is jointly managed by NASA and the United States Geological Survey. Copernicus is supported by the European Commission. MODIS data (250 m resolution) are obtained from the NASA NRT Global Flood Mapping facility (surface water extents) and from NASA Worldview (image files). SUOMI/VIIRS (375 m resolution) image data are also retrieved from Worldview. Sentinel 1 SAR-based flood mapping, where used and so identified, is contributed by Xinyi Shen and Qing Yang and the Rapid system at the University of Connecticut.
Flood extent files (.shp), Google Earth .kmz files, and geotif files supporting this Flood Event Map are located here.
These files may include high spatial resolution mapping such as from Sentinel or Landsat, or lower resolution files from MODIS. File names commonly include the sensor source (e.g., S1 for Sentinel 1, LS8 for Landsat, MODIS, Aqua, or Terra for MODIS) and the image date. End users should acknowledge satellite source accordingly.
For selected flood events, and over many years, DFO has used all available remote sensing data to map ongoing major flood events in "near real time". It then publishes both raster (.jpg and geotiff) format maps, and the source GIS files (their polygon objects delineate flooded areas). Onthe flood event web pages, DFO provides "maximum flood extent" visualizations of all land flooded during this event, and also previously mapped flood events.
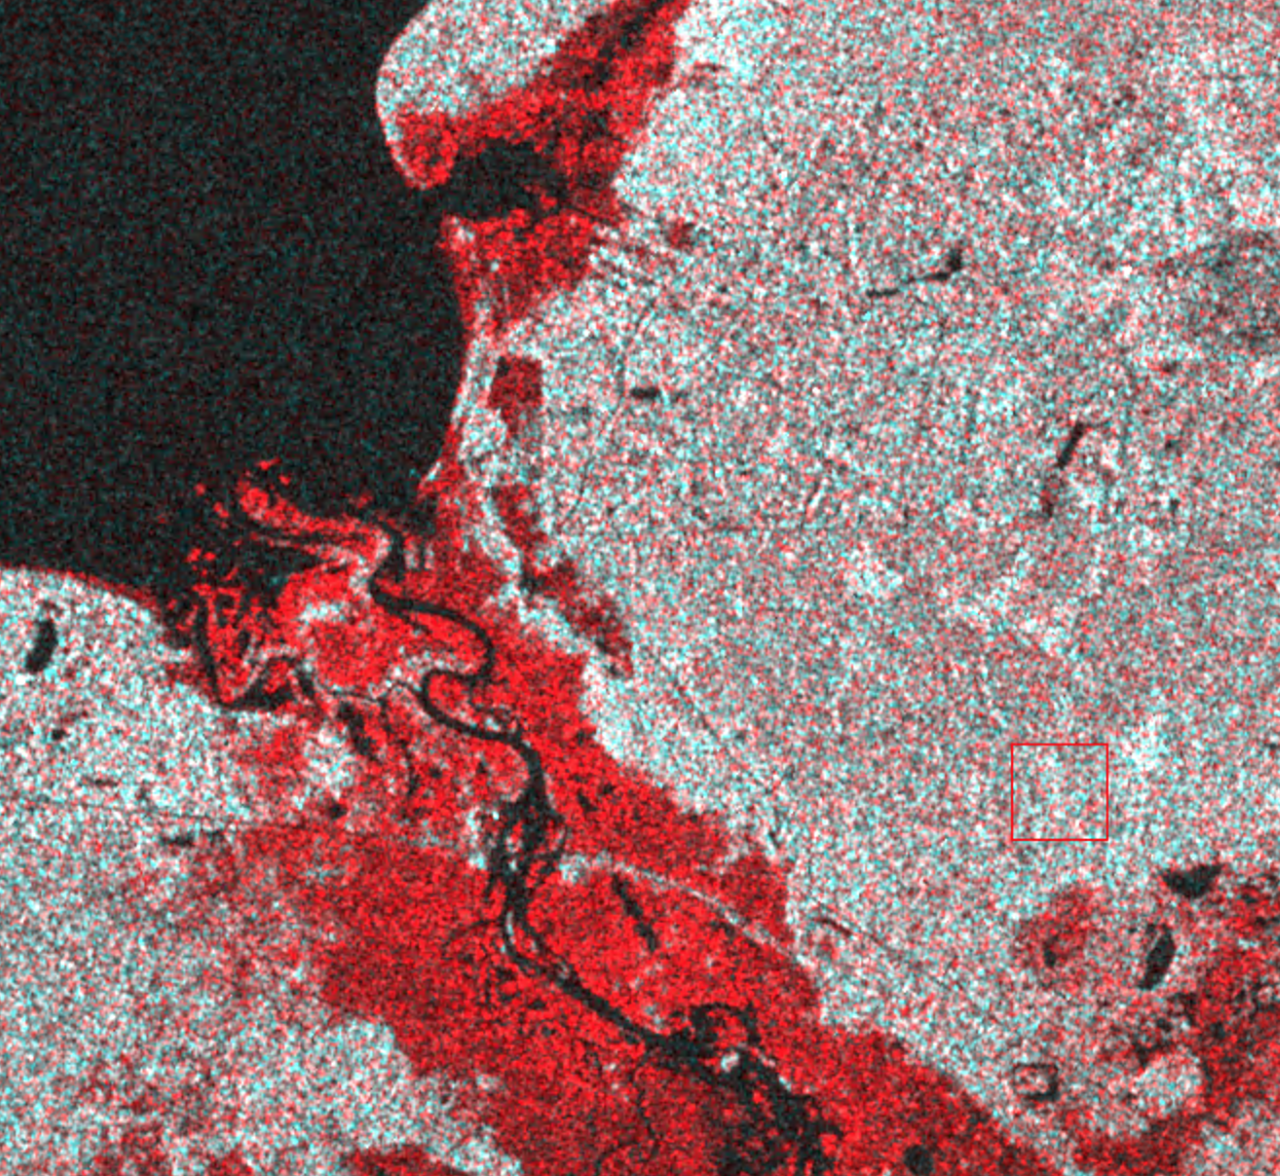
The "Overview" maximum flood extent map is scaled to include all or most of the major flood-afffected area. Detailed displays of the same information provide larger scale views of particular areas of interest and also allow postential end users to better assess the quality of the source GIS information. A data folder for each event provides access to the array of GIS information that was used to construct these online map views. In some cases, multitemporal "before" and "during" SAR and other single band image data provide a false color composite of flooded areas. These are used to produce the GIS inundation polygons, and these rasters are also provided in the data folder.
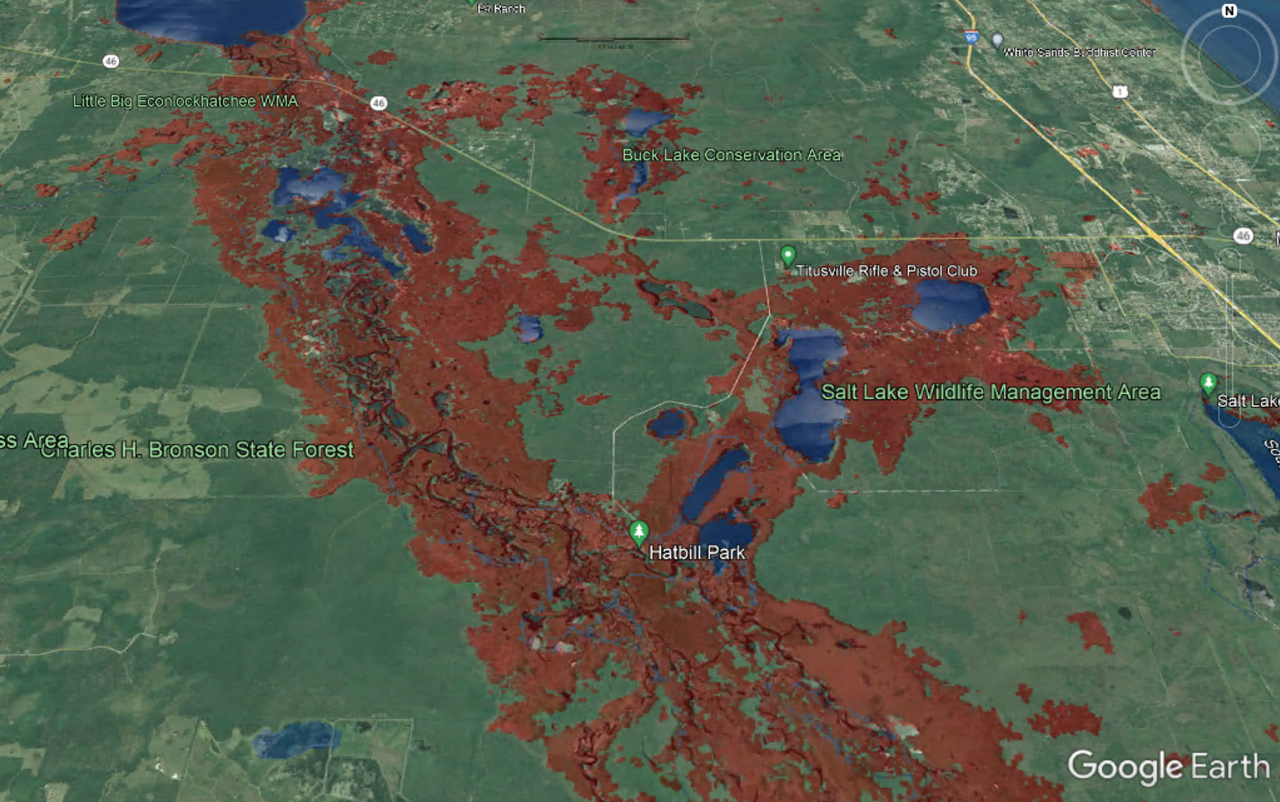
In particular, exact repeat passes of Sentinel 1 SAR information are used to produce the color composites ("before band" on the blue channel, "during flood" band on the red and green channels. The geotifs resulting can, without quantitative classification to new water parcels, still be used visually and within GIS systems to show flooded land.. A similar strategy is used for near IR bands from sensors aboard MODIS, Planetscope, and other satellites.
In some cases, responders need this information only during the event. In many others, "building back better" requires accurate knowledge of what land areas were flooded, and also how large the event was compared to previous events. To meet the latter need, we archive the record of each event and incorporate such map information as context for the maximum extent reached by each flood. In some cases, this context may include a large array of previous floods mapped. Upon request, we can provide geotiffs of this combined information for specific areas.
A few tips: 1) Google Earth is a useful viewer of both .shp format and geotif format information if the file sizes are not too large. In some cases, we import such information into Google Earth and generate a .kmz file, which is then included in the data folder. 2) During a flood event, expect updates of the shp files as we further process them to remove extraneous objects. Updates can be tracked by observing the creation dates associated with the files in the data folder. 3) The Sentinel 1 SAR multitemporal color composites experience an important processing step after they are first created: application of a 5x5 low pass filter to remove "speckle" and very small areas of water. 4) A classification step is accomplished on the color composites to discriminate water areas. In addition, we commonly remove all "water" areas <.05 km2 in area, as the objective is larger areas of flooding land, commonly along streams and rivers.
Input from disaster responders, flood risk analysts, and all others seeking information of what land was flooded during major events is welcomed. In many cases, we can produce information products tailored to end user GIS systems and analysis objectives. Write to Robert.Brakenridge@Colorado.edu or Albert.Kettner@Colorado.edu
The NASA Earth Sciences Division, the Latin American Development Bank, the World Bank, the European Commission's Global Disaster Alert and Coordination System, GDACS, and Copernicus Emergency Management Service, the Google Earth Engine research awards program, the Committee on Earth Observation Satellites (CEOS) Disasters Working Group-Flood Pilot, the Japanese Space Agency, the National Geographic Society, and the European Space Agency all have supported the Observatory's work since 1993 via research grants and contracts or free satellite and data and satellite-derived data.
The Dartmouth Flood Observatory was founded in 1993 at Dartmouth College, Hanover, NH USA and moved to the University of Colorado, INSTAAR, CSDMS in 2010. The institutional support of both universities is gratefully acknowledged.
(counting since October 6, 2022)