
Flood Hydroclimatological Analysis for this event
 |
 |
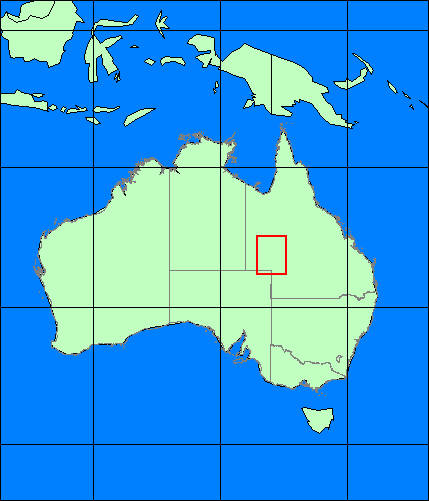
| The red box on the location map above shows the approximate location of the inundation maps to the right and below. | Black grid marks one degree latitude and longitude lines. Dashed black line indicates boundary of the January 3, 2000 Landsat 7 browse image used to derive the vectors from this flood event. |
 |
 |
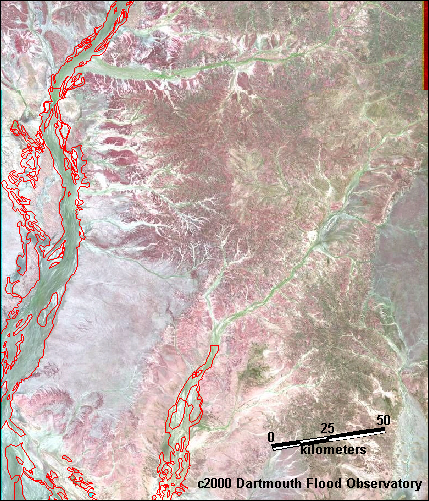
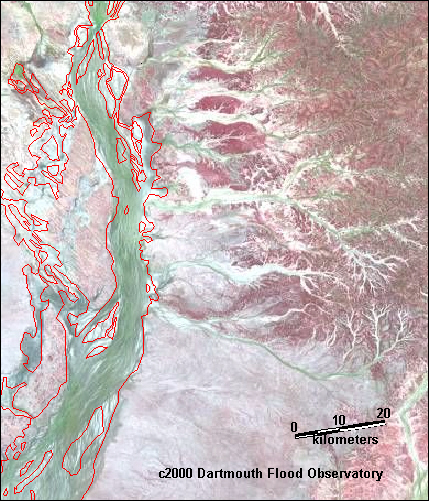
| July 27, 1999 Landsat 7 browse image with flood limit vectors derived from the January 3, 2000 Landsat 7 browse image (below). Peak flooding in this area occurred in mid to late February 2000. No images could be found for the peak flood time period. Landsat image courtesy of NASA GSFC-DAAC. Download vectors shown above: 010300Aus006LB.MIF |
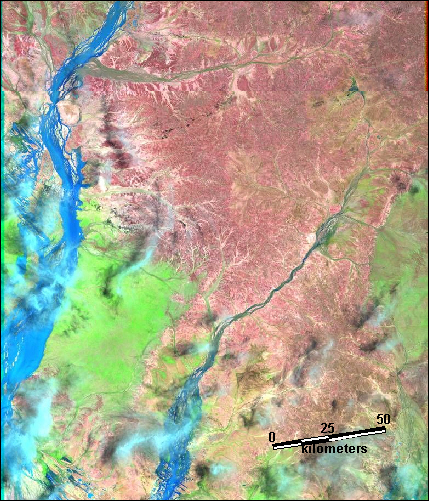
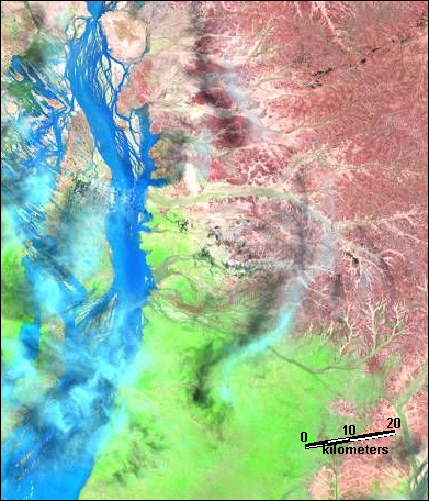
January 3, 2000 Landsat 7 browse image. Landsat image courtesy of NASA GSFC-DAAC. |
 |
 |
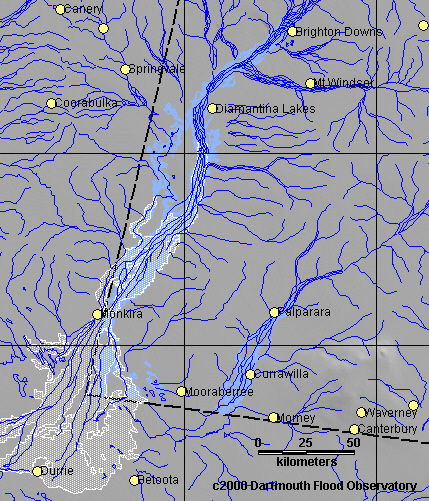
| Close-up view of July 27, 1999 Landsat 7 browse image (above). Landsat image courtesy of NASA GSFC-DAAC. | Close-up view of January 3, 2000 Landsat 7 browse image (above). Landsat image courtesy of NASA GSFC-DAAC. |