


![]()
G. R. Brakenridge and A. J. Kettner
To digitize to GIS .shp files: The geotif is 24 bit, 3 color R,G,B. For the maximum observed flood layer, R = 217. For the mean annual flood layer, R = 112. For the SWBD reference water, R = 47.
This DFO Flood Risk Map is by G. R. Brakenridge and A. J. Kettner, 2019. It is provided for use under the terms of a Creative Commons Attribution-NonCommercial-ShareAlike 4.0 International License (https://creativecommons.org/licenses/by-nc-sa/4.0/). Citation of the authors is required. If Geotif is unavailable, contact Robert.Brakenridge@Colorado.edu or Albert.Kettner@Colorado.edu.
Since late 1993, satellite data have been obtained by the Dartmouth Flood Observatory, processed to detect water/land boundaries, and analyzed to produce flood inundation limits. In 2011, NASA NRT Global Flood Mapping began providing daily global surface water information at 250 m spatial resolution. This provides fully automated currently observed water, using running forward 2 week accumulations, updated each day.
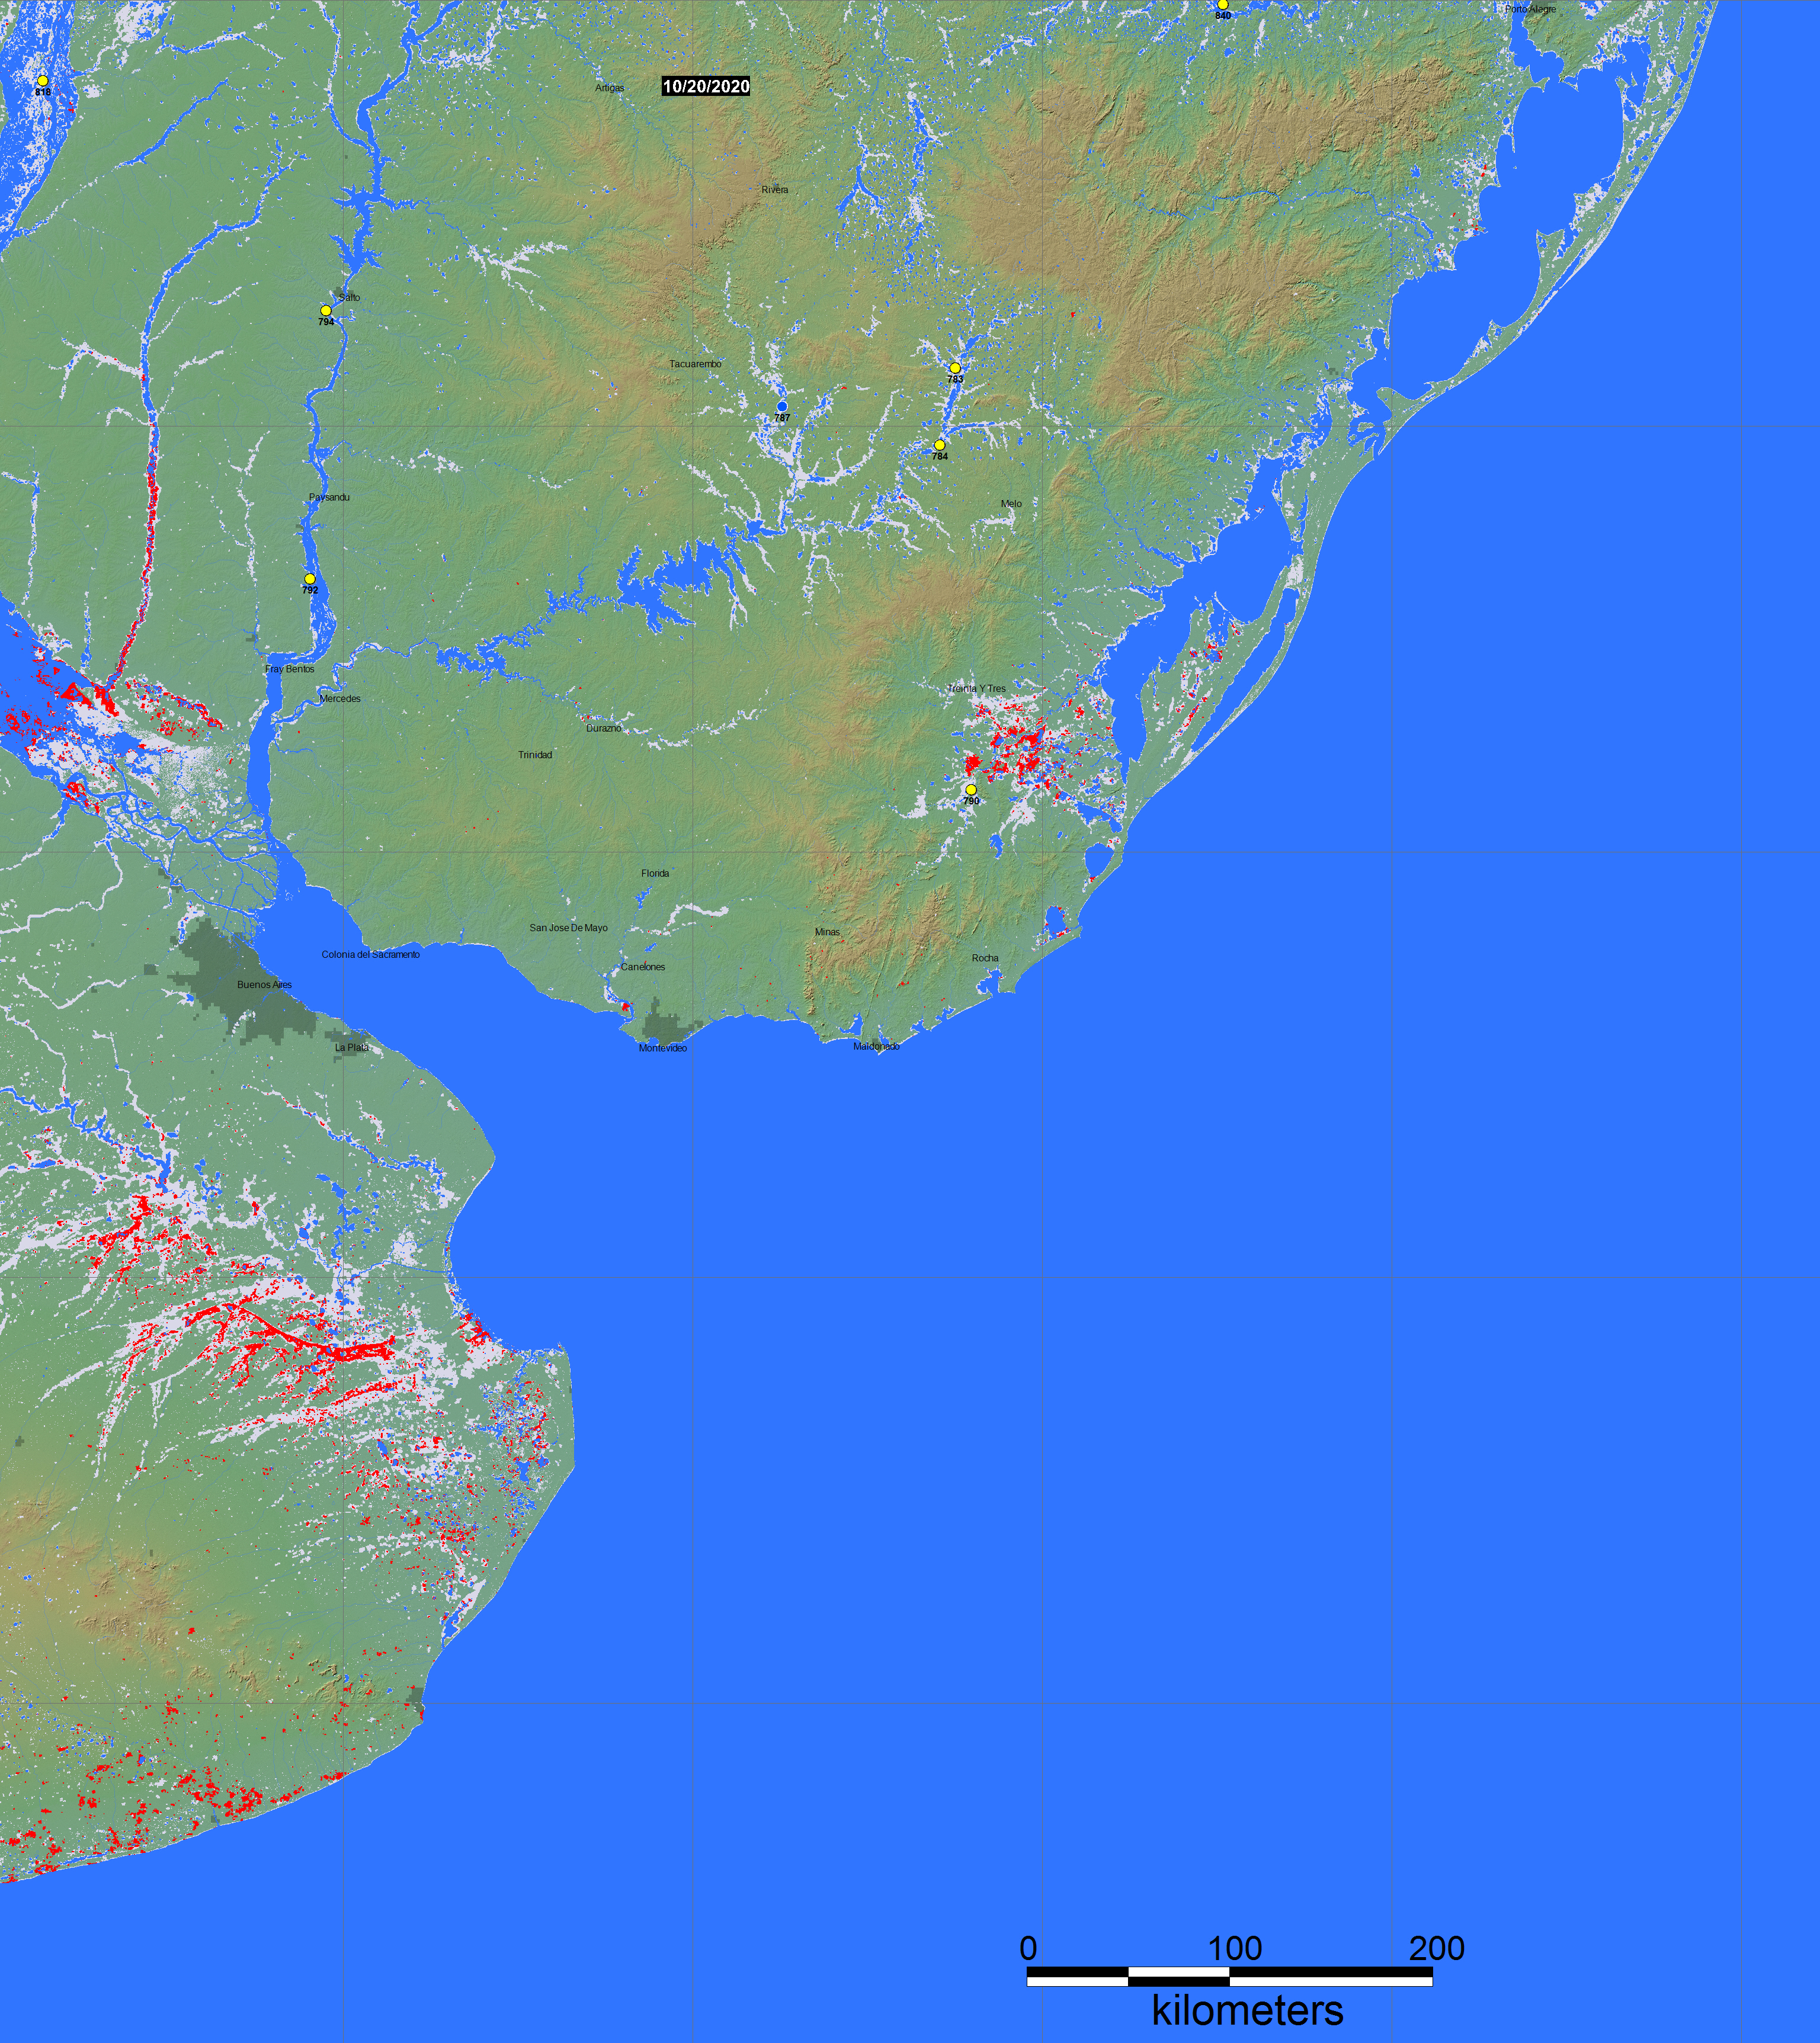
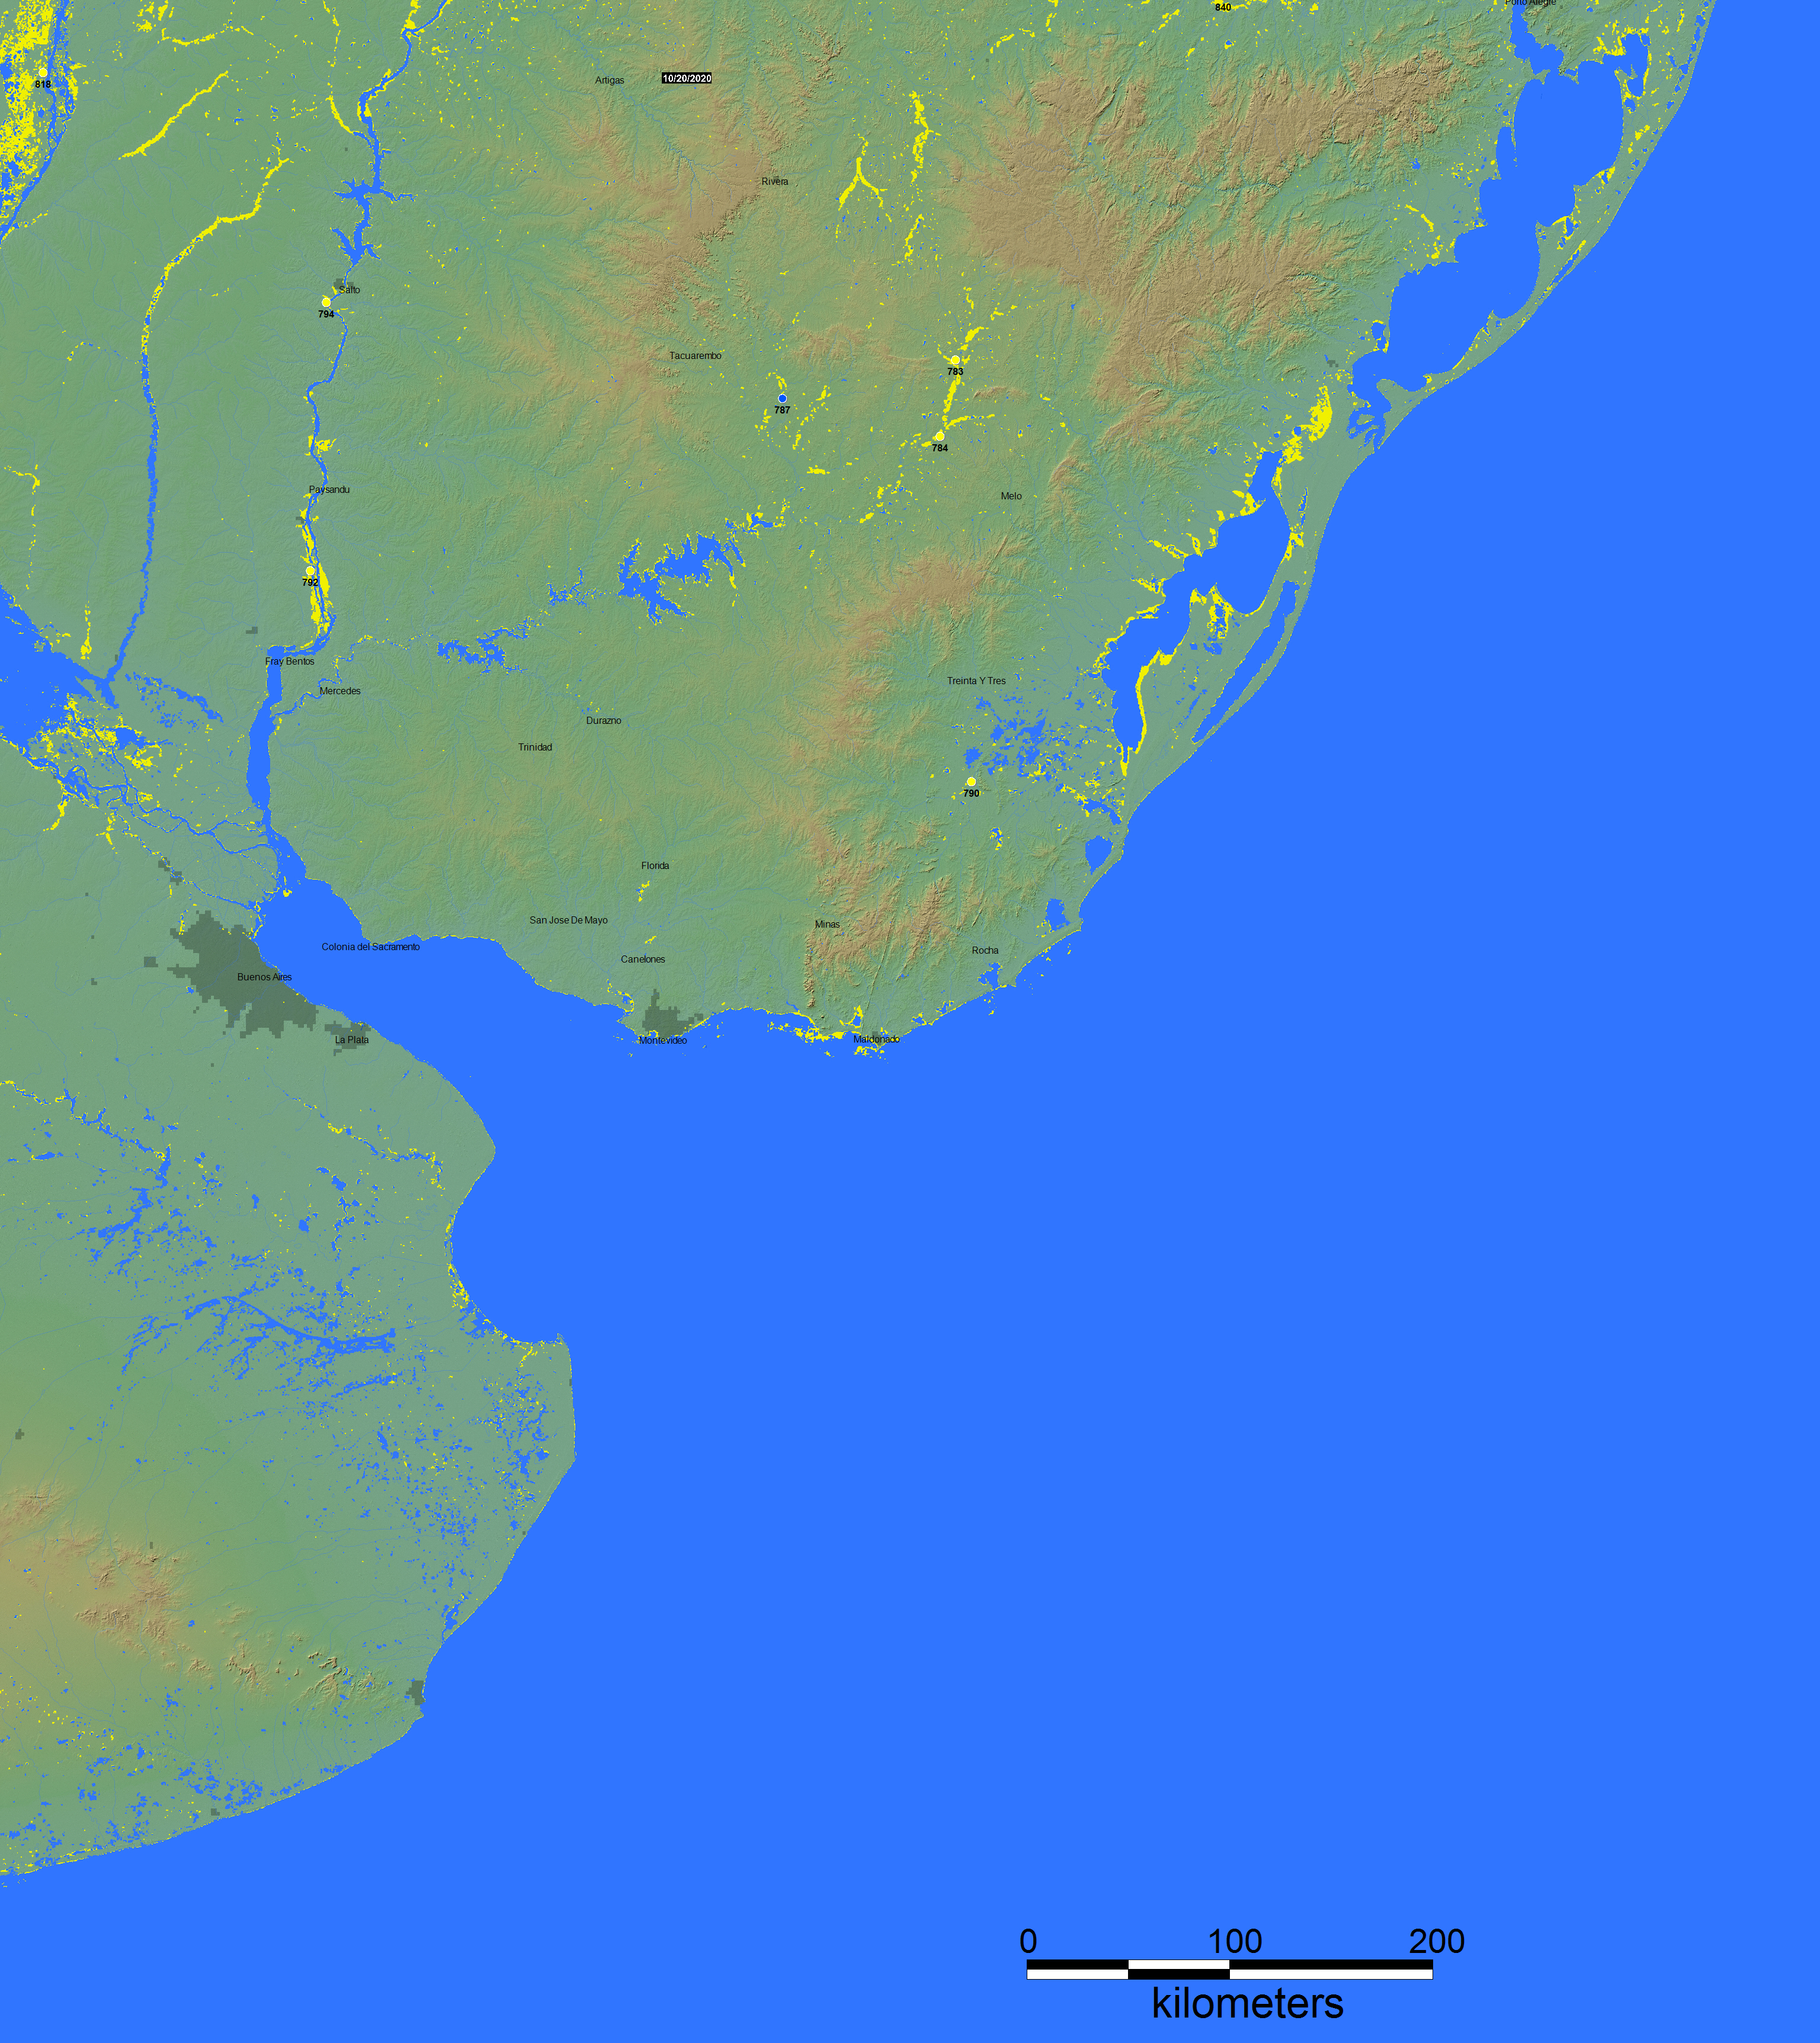
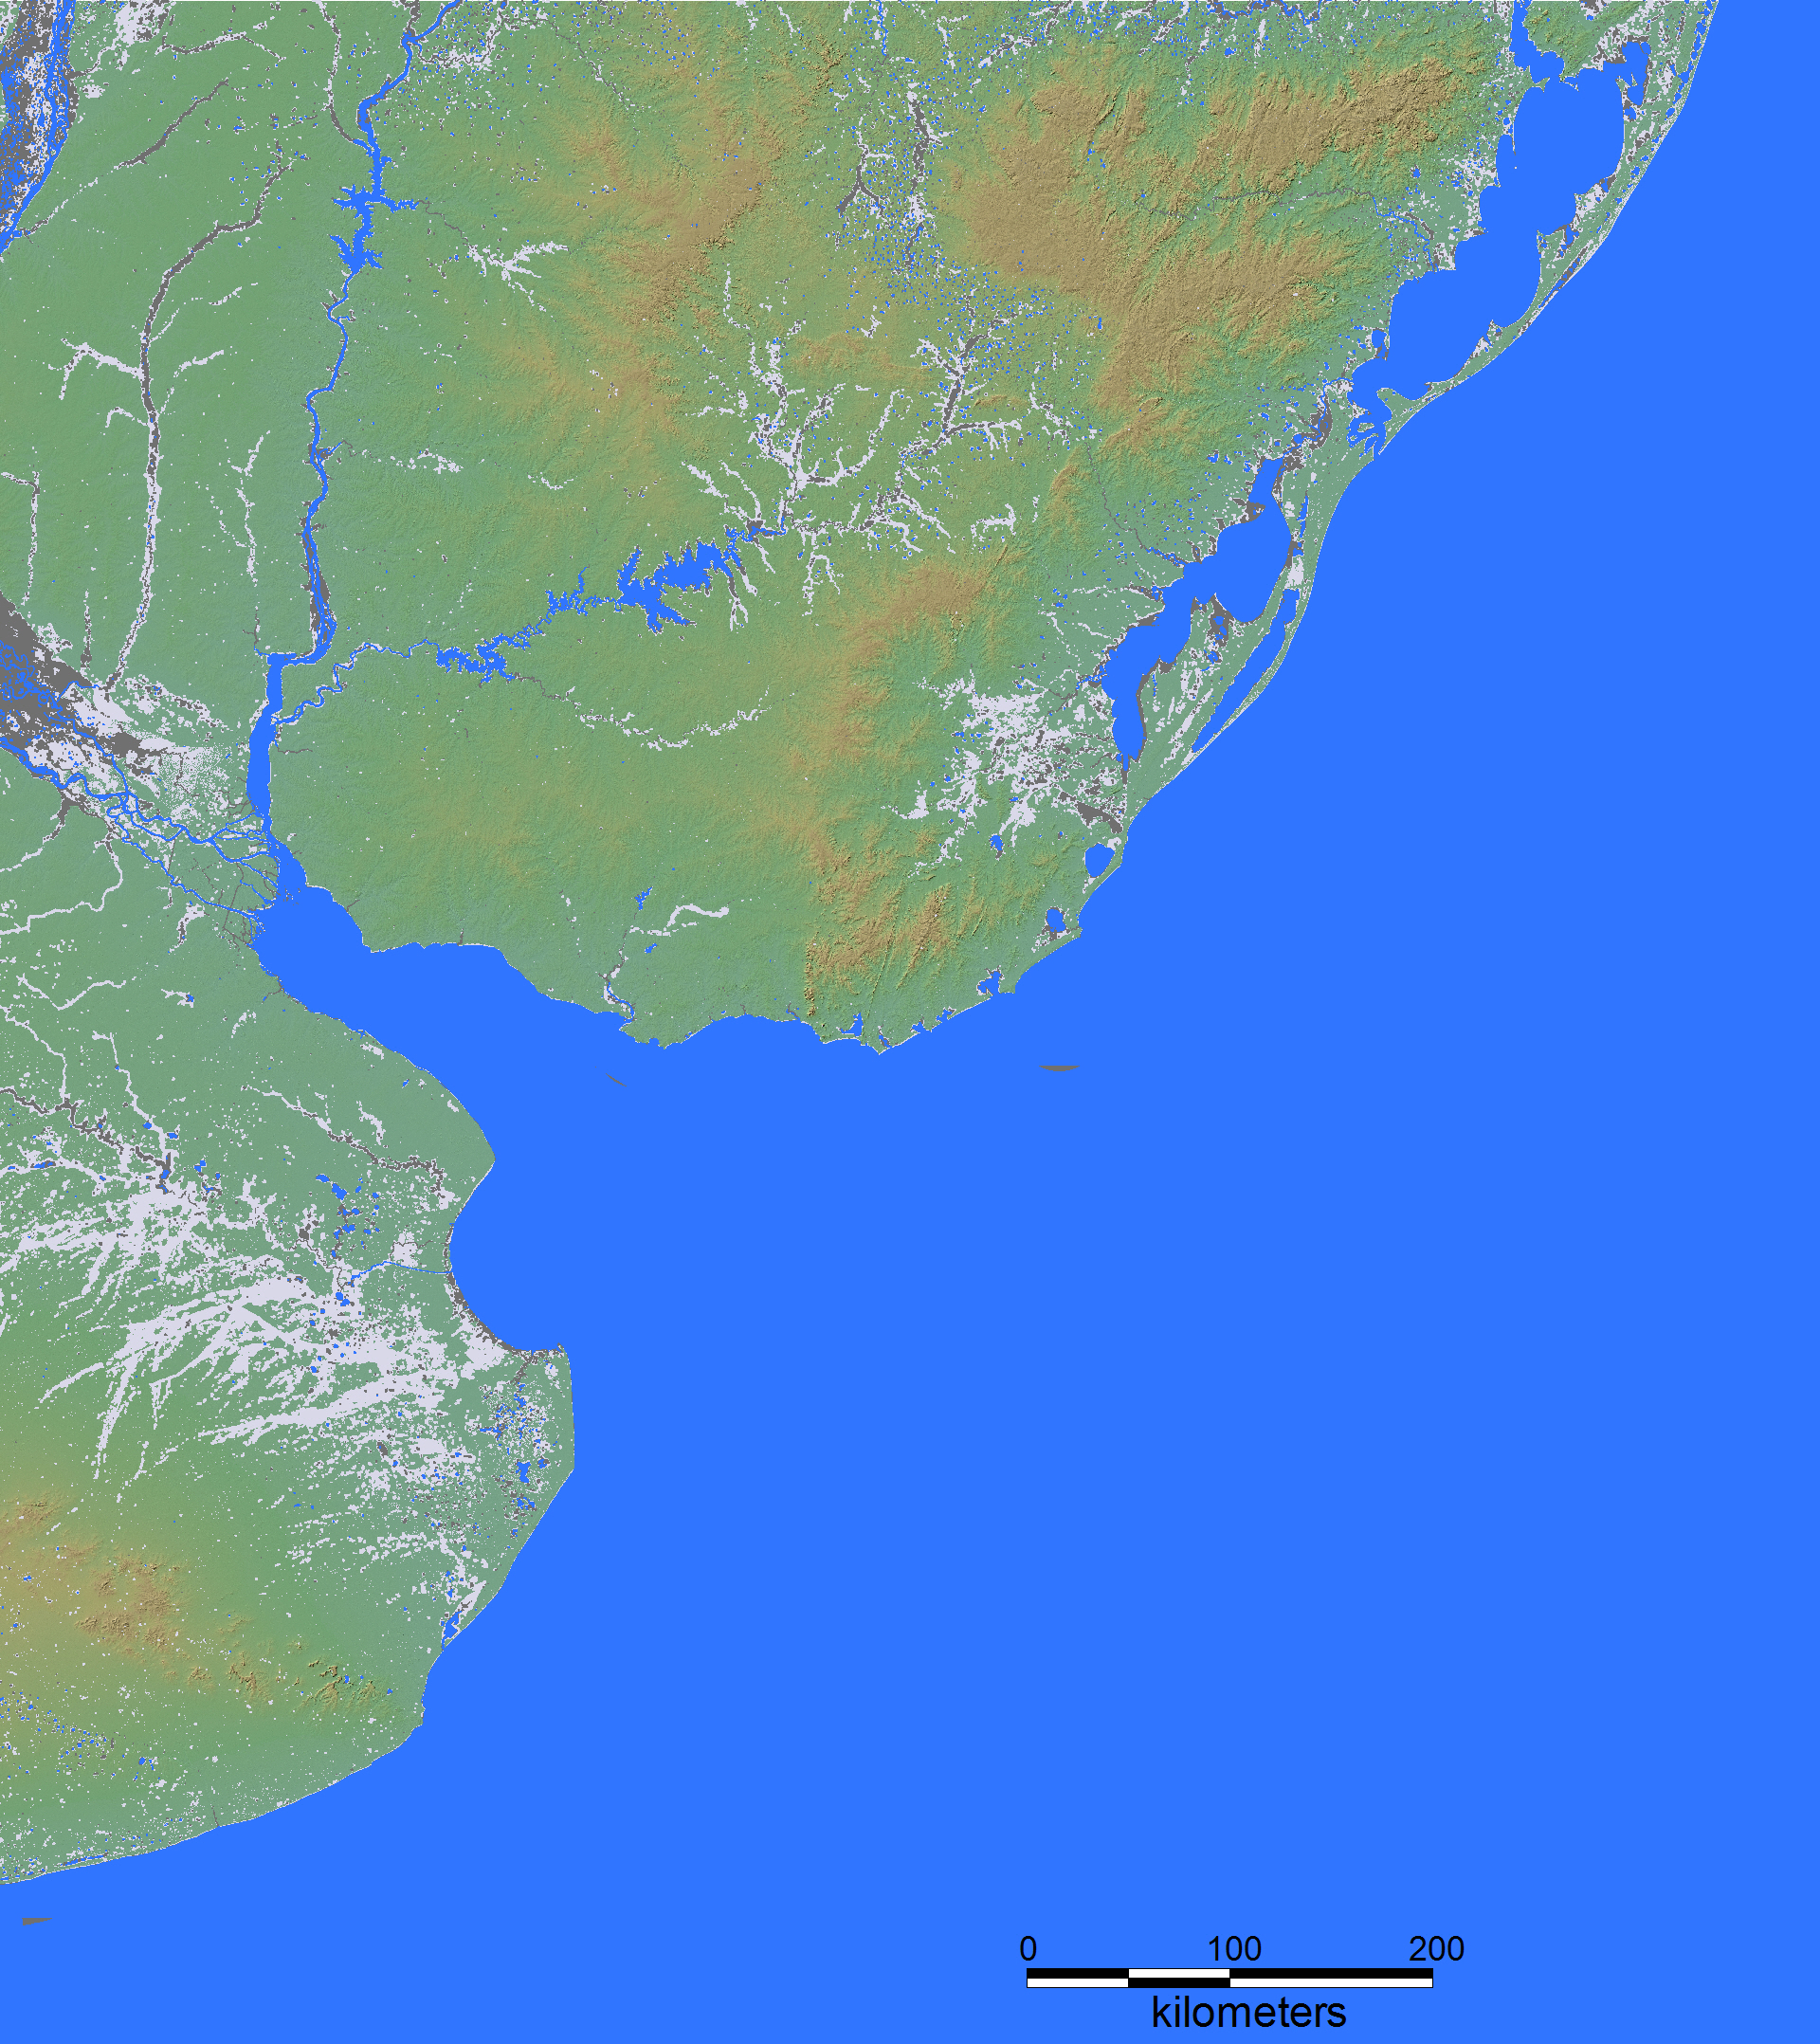
DFO creates annual maximum water extents from the NRT Global Flood project: by accumulating into one annual file all of the daily files for each year. These and all flood events mapped since 1993, by all available sensors, are included in the light gray areas shown in the displays. The Mean Annual Flood areas are produced by processing four annual maximum files (2013-2016) to provide only areas flooded at least 3 out of the 4 years. This is an approximation of the normal annual high water.
Click here for access to the automated daily MODIS-derived .shp files of surface water. Data from the Global Surface Water Explorer are also included in the maximum observed flooding zone. These are based on Landsat data at a spatial resolution of 30 m. Shuttle Water Boundary Data (SWBD) surface water extent (90 m resolution) are derived from NASA's 11-day February, 2000, SRTM (Space Shuttle) mission. Finally, since 1993, DFO produced many flood extent files through mapping of individual floods using various sensors. These are also included in the light gray layer.
At selected locations, a time series of satellite microwave-based river discharge or reservoir area measurements are available from the Flood Observatory. See River and Reservoir Watch Global Display for more information. Yellow dots: low flow. Blue dots: normal flow. Purple dots: moderate flooding (>1.5 year recurrence interval). Red dots:: major flooding (> 5 year recurrence interval).

This work, web site, and associated data are by G. R. Brakenridge and A. J. Kettner and are provided under the terms of a Creative Commons Attribution-NonCommercial-ShareAlike 4.0 International License. You must cite the authors for non-commercial use and obtain permission prior to any commercial use. Contact Robert.Brakenridge@Colorado.edu or Albert.Kettner@Colorado.edu.
(counting since April 8, 2019)