


![]()
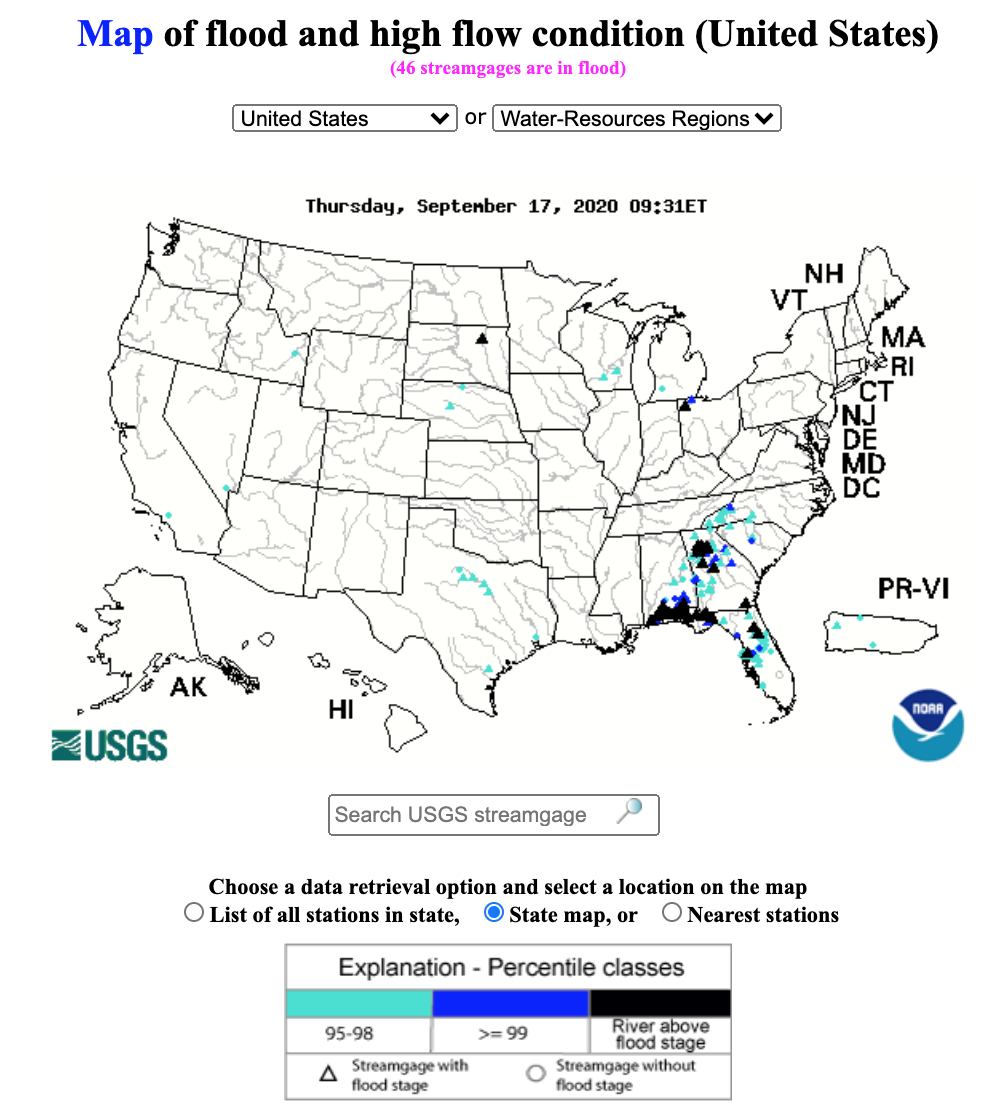
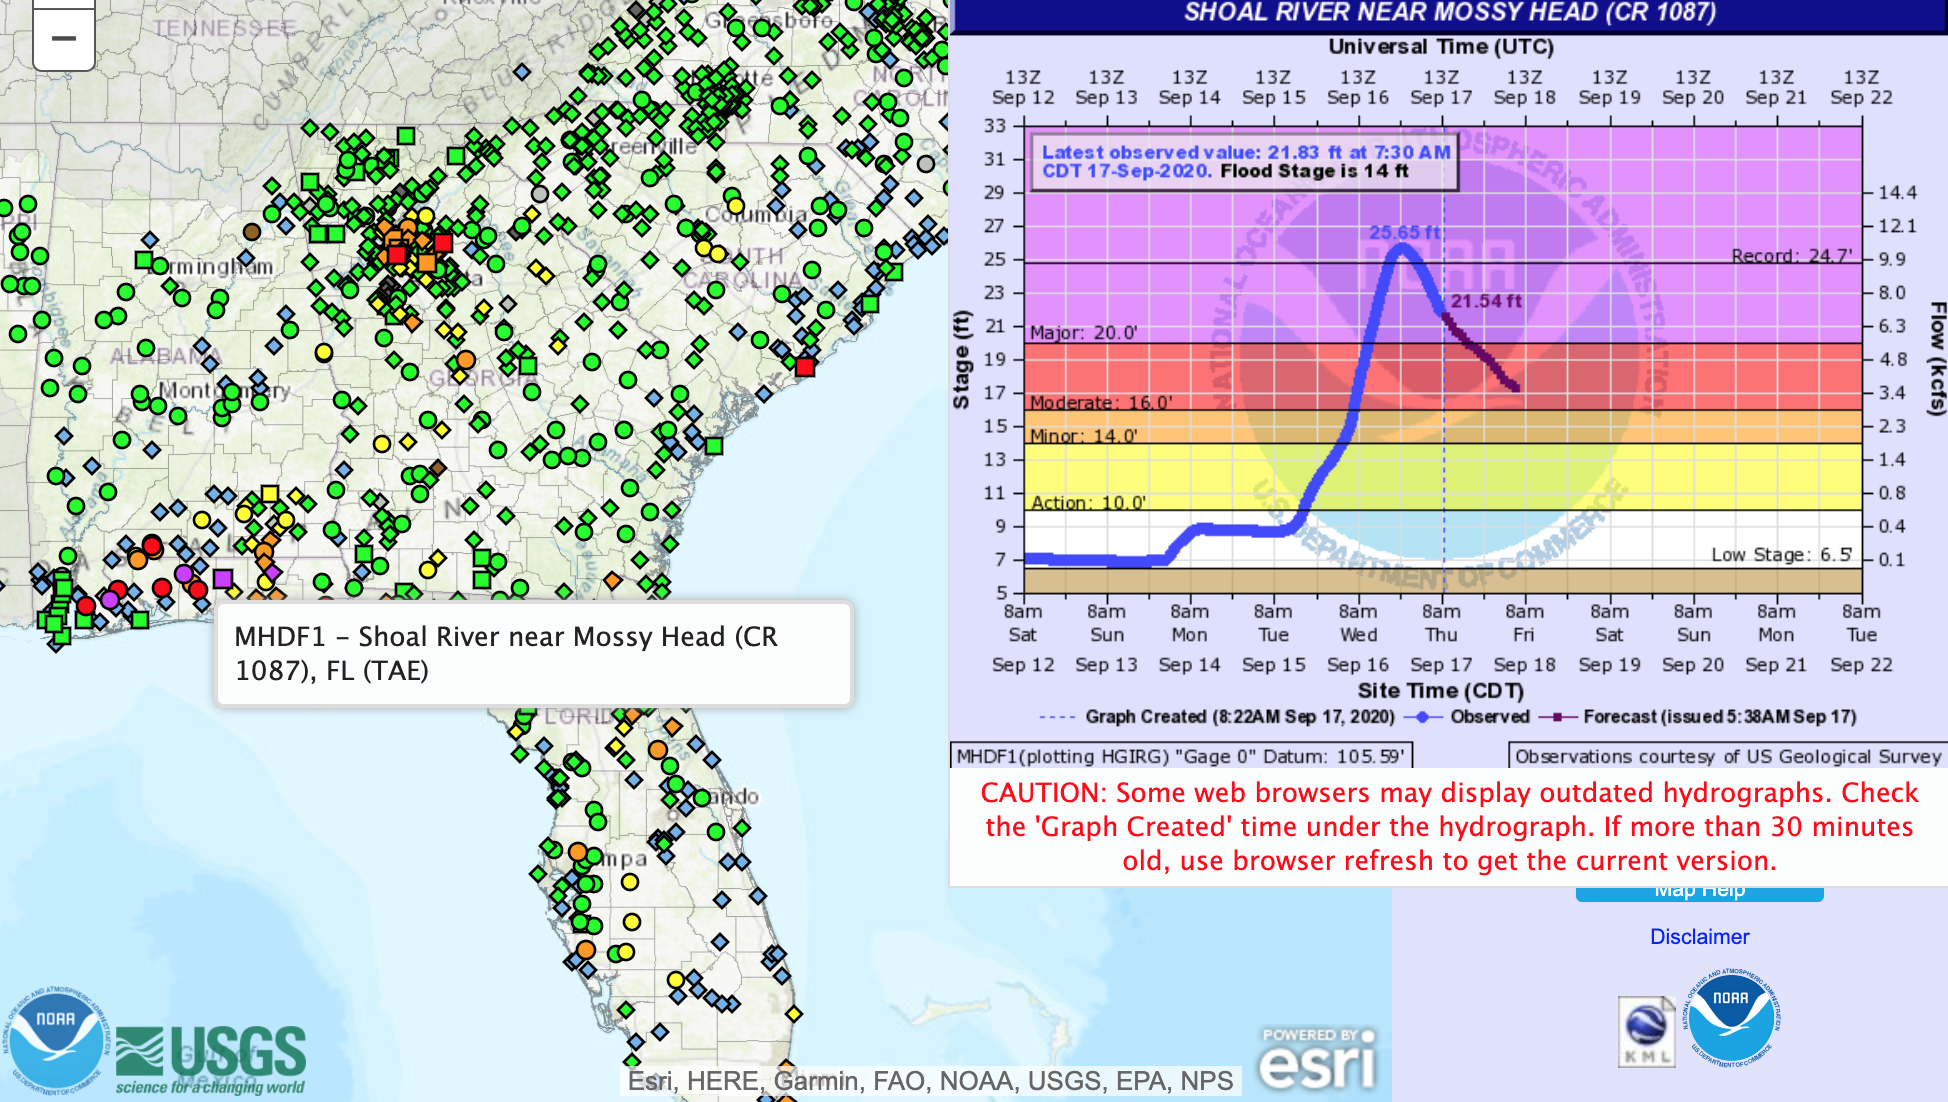
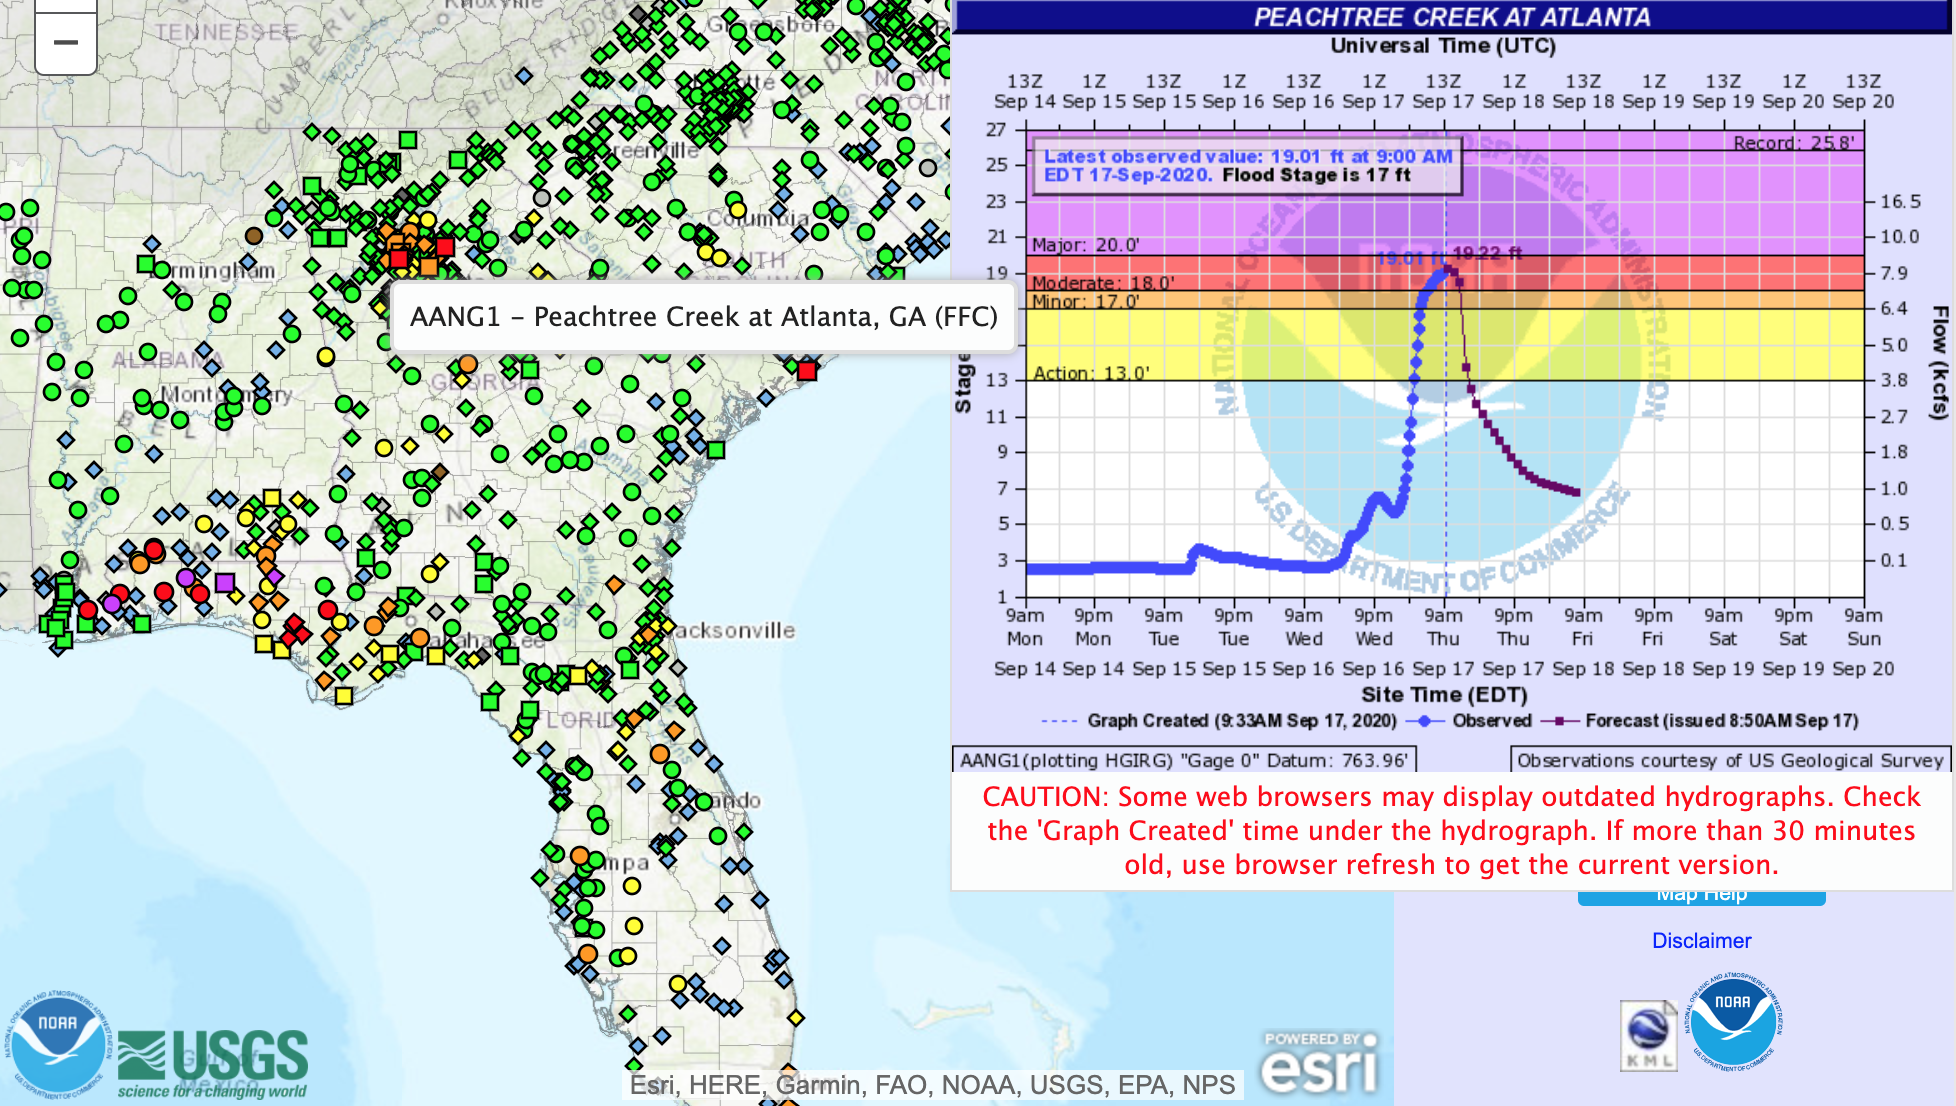
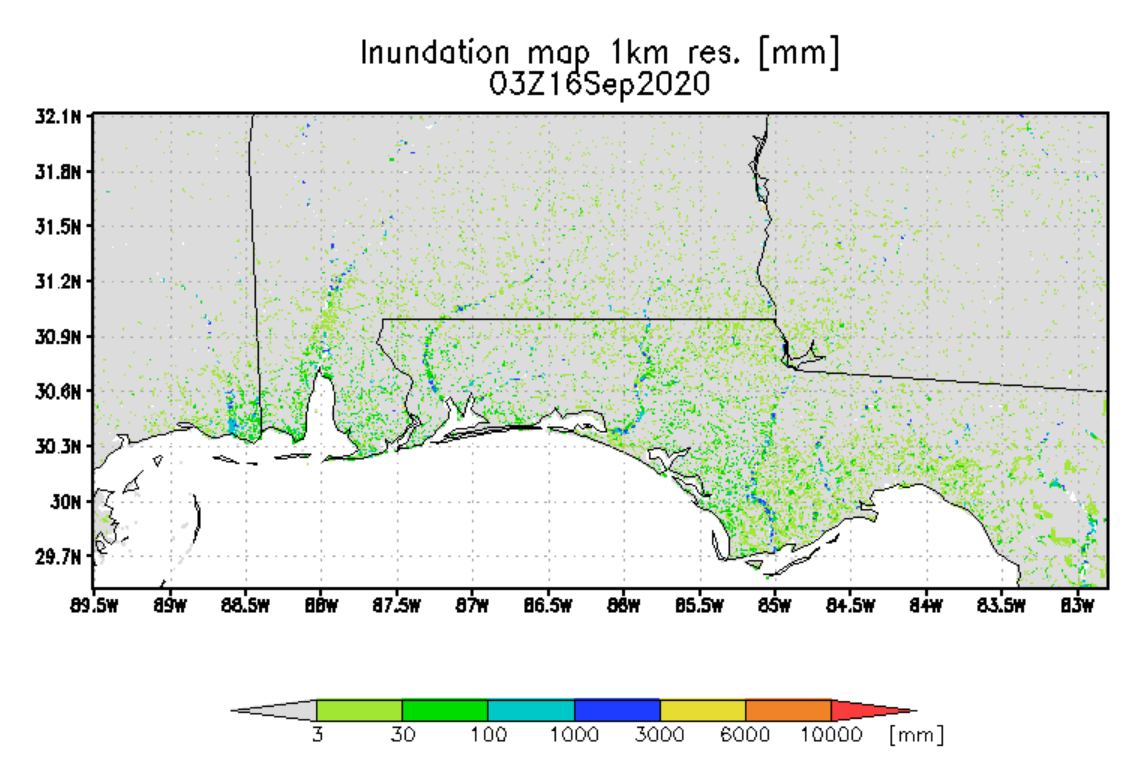
"USA – Floods in Alabama and Florida After Hurricane Sally Dumps 760mm of Rain 18 SEPTEMBER, 2020 BY FLOODLIST NEWS IN NEWS, USA At least person has died and one is missing after Hurricane Sally made its way inland after making landfall as a Category 2 hurricane near Gulf Shores, Alabama, on 16 September 2020. The storm dumped almost 30 inches (762 mm) of rain in Orange Beach, Alabama, and 24.80 inches (630 mm) in Pensacola, Florida in a 72 hour period, according to National Weather Service (NWS). The torrential rain has increased river levels in the area, which are likely to remain high for some time. As of 18 September, rivers were above Moderate Flood Stage in 9 locations in southern Alabama and western Florida Panhandle. Media reported severe flooding from the overflowing Fish and Perdido rivers. The Shoal River near Crestview in Florida reached 16.42 feet on 17 September 2020, well above Major Flood Stage of 15 feet and the second highest crest on record behind the 21.40 feet from September 1998. NWS Mobile warned that “river flooding will persist through at least this weekend for portions of southwest/south-central Alabama and the western Florida Panhandle.” 72 hour rainfall totals from Hurricane Sally, September 2020. Officials in Orange Beach, Alabama, said one person had died and another was missing as a result of the storm. Emergency crews were called on to rescue or evacuate hundreds of people along the Gulf Coast, in particular in Escambia County, which includes Pensacola, Florida. Almost 500,000 homes and businesses are without power in Alabama and Florida. Strong winds, storm surge and flooding have damaged roads, bridges and other infrastructure. Sally has weakened into a tropical depression and is forecast to weaken further as it moves over Georgia and the Carolinas.” Quoted from Flood List
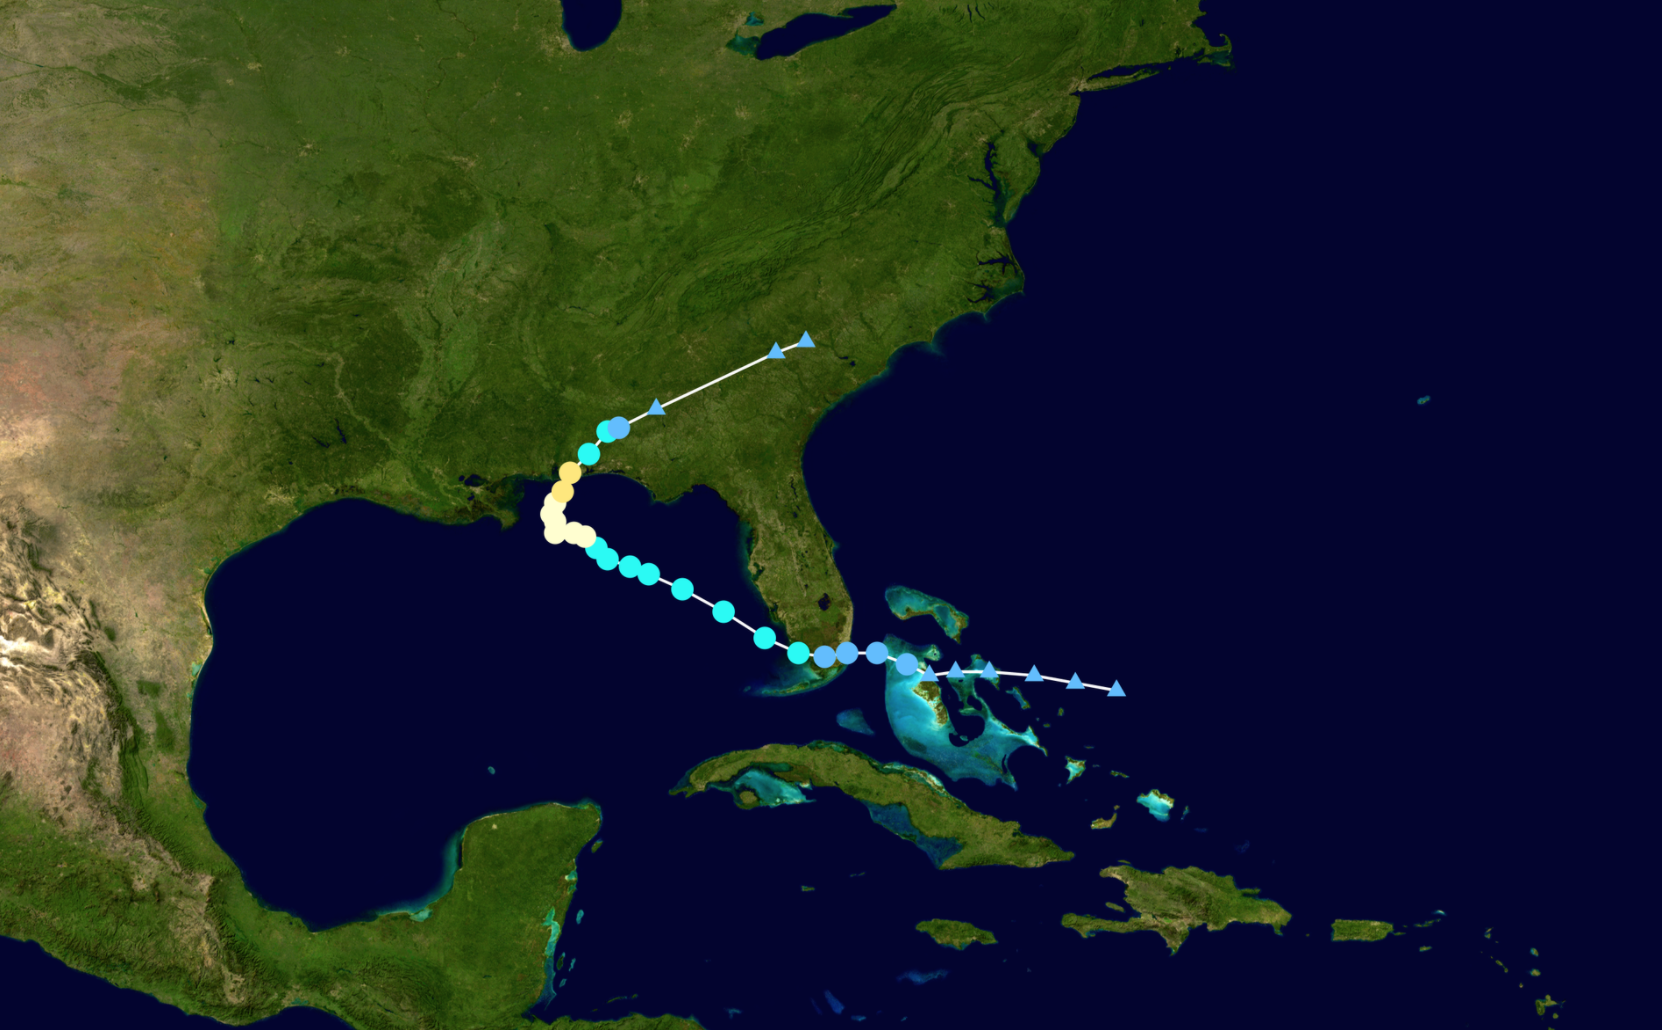
Track Map of Hurricane Sally of the 2020 Atlantic hurricane season. The points show the location of the storm at 6-hour intervals. The colour represents the storm's maximum sustained wind speeds as classified in the Saffir–Simpson scale (see below), and the shape of the data points represent the nature of the storm, according to the legend below. Detailed description of this storm is at Wikipedia.
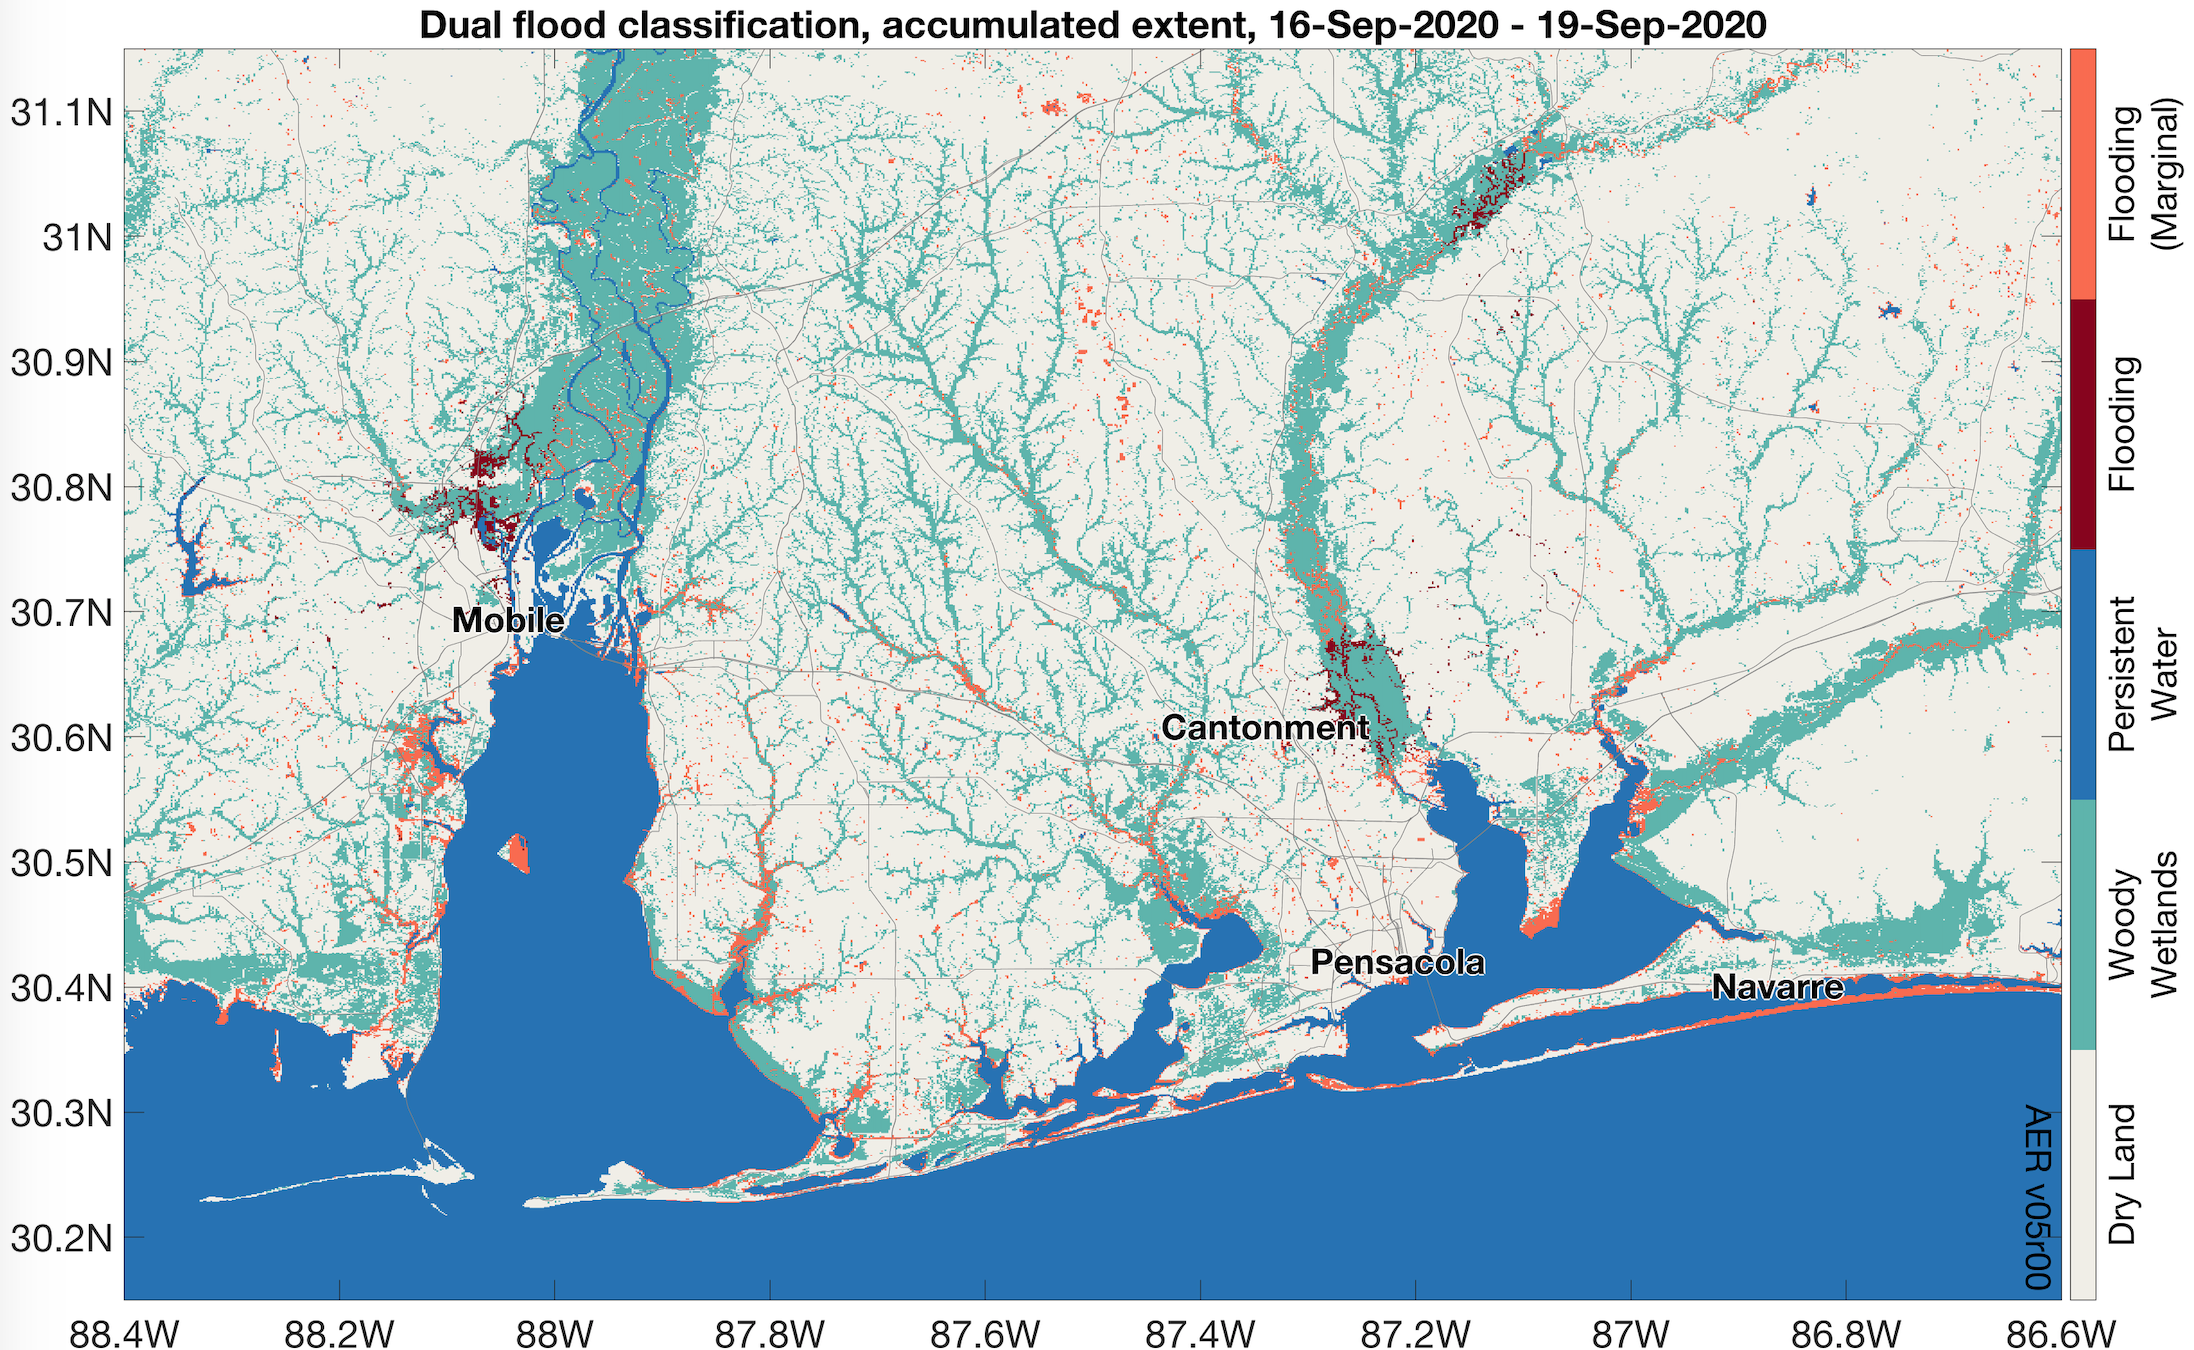
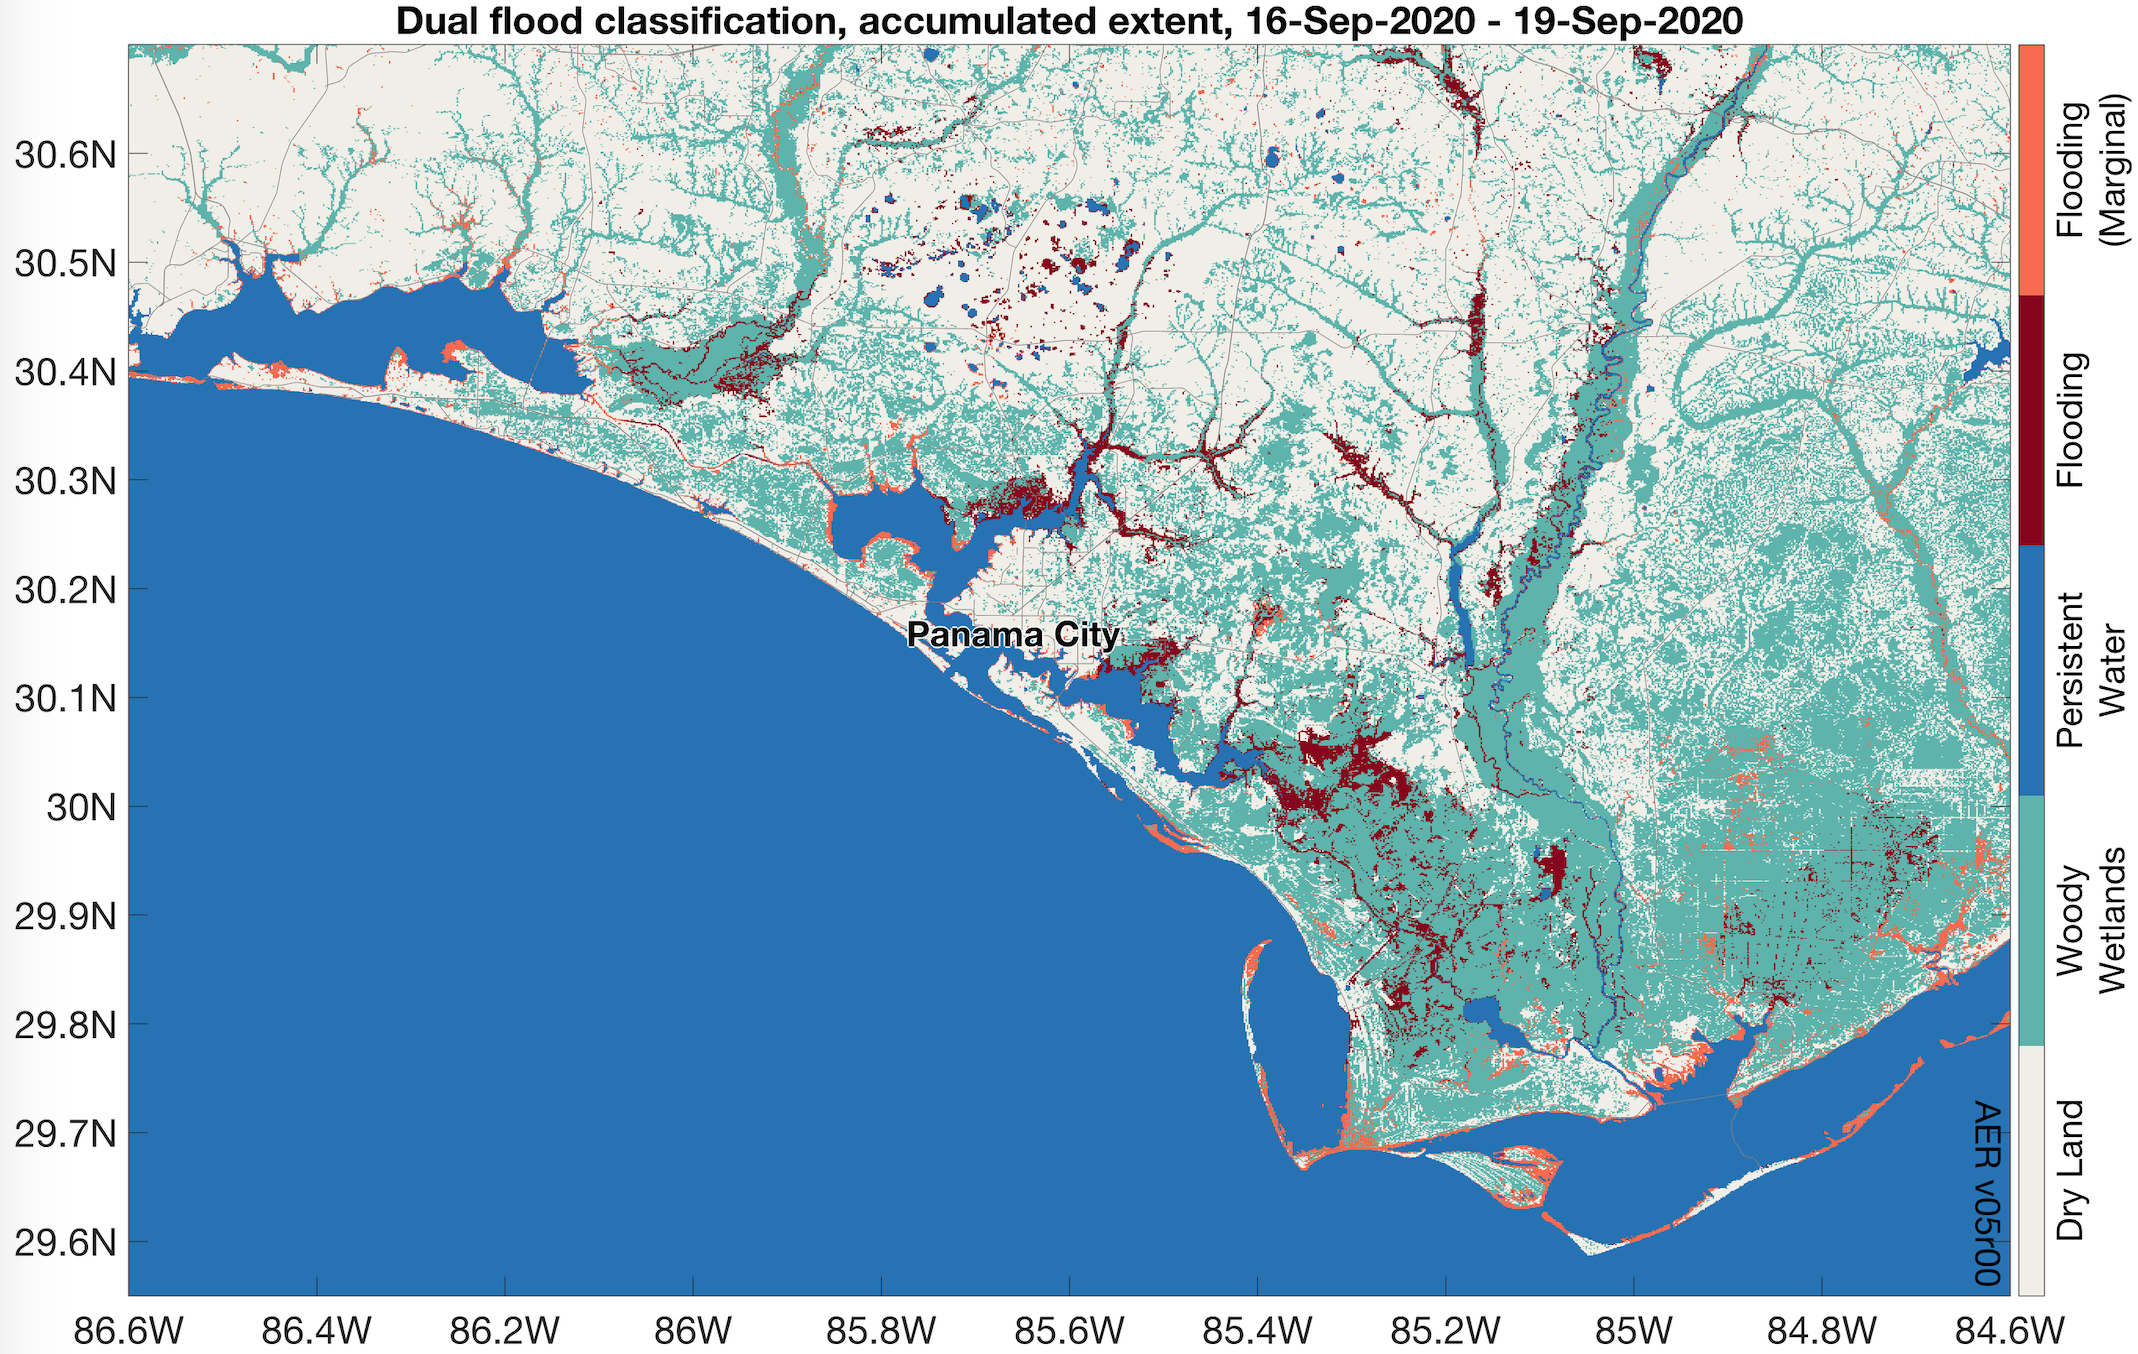
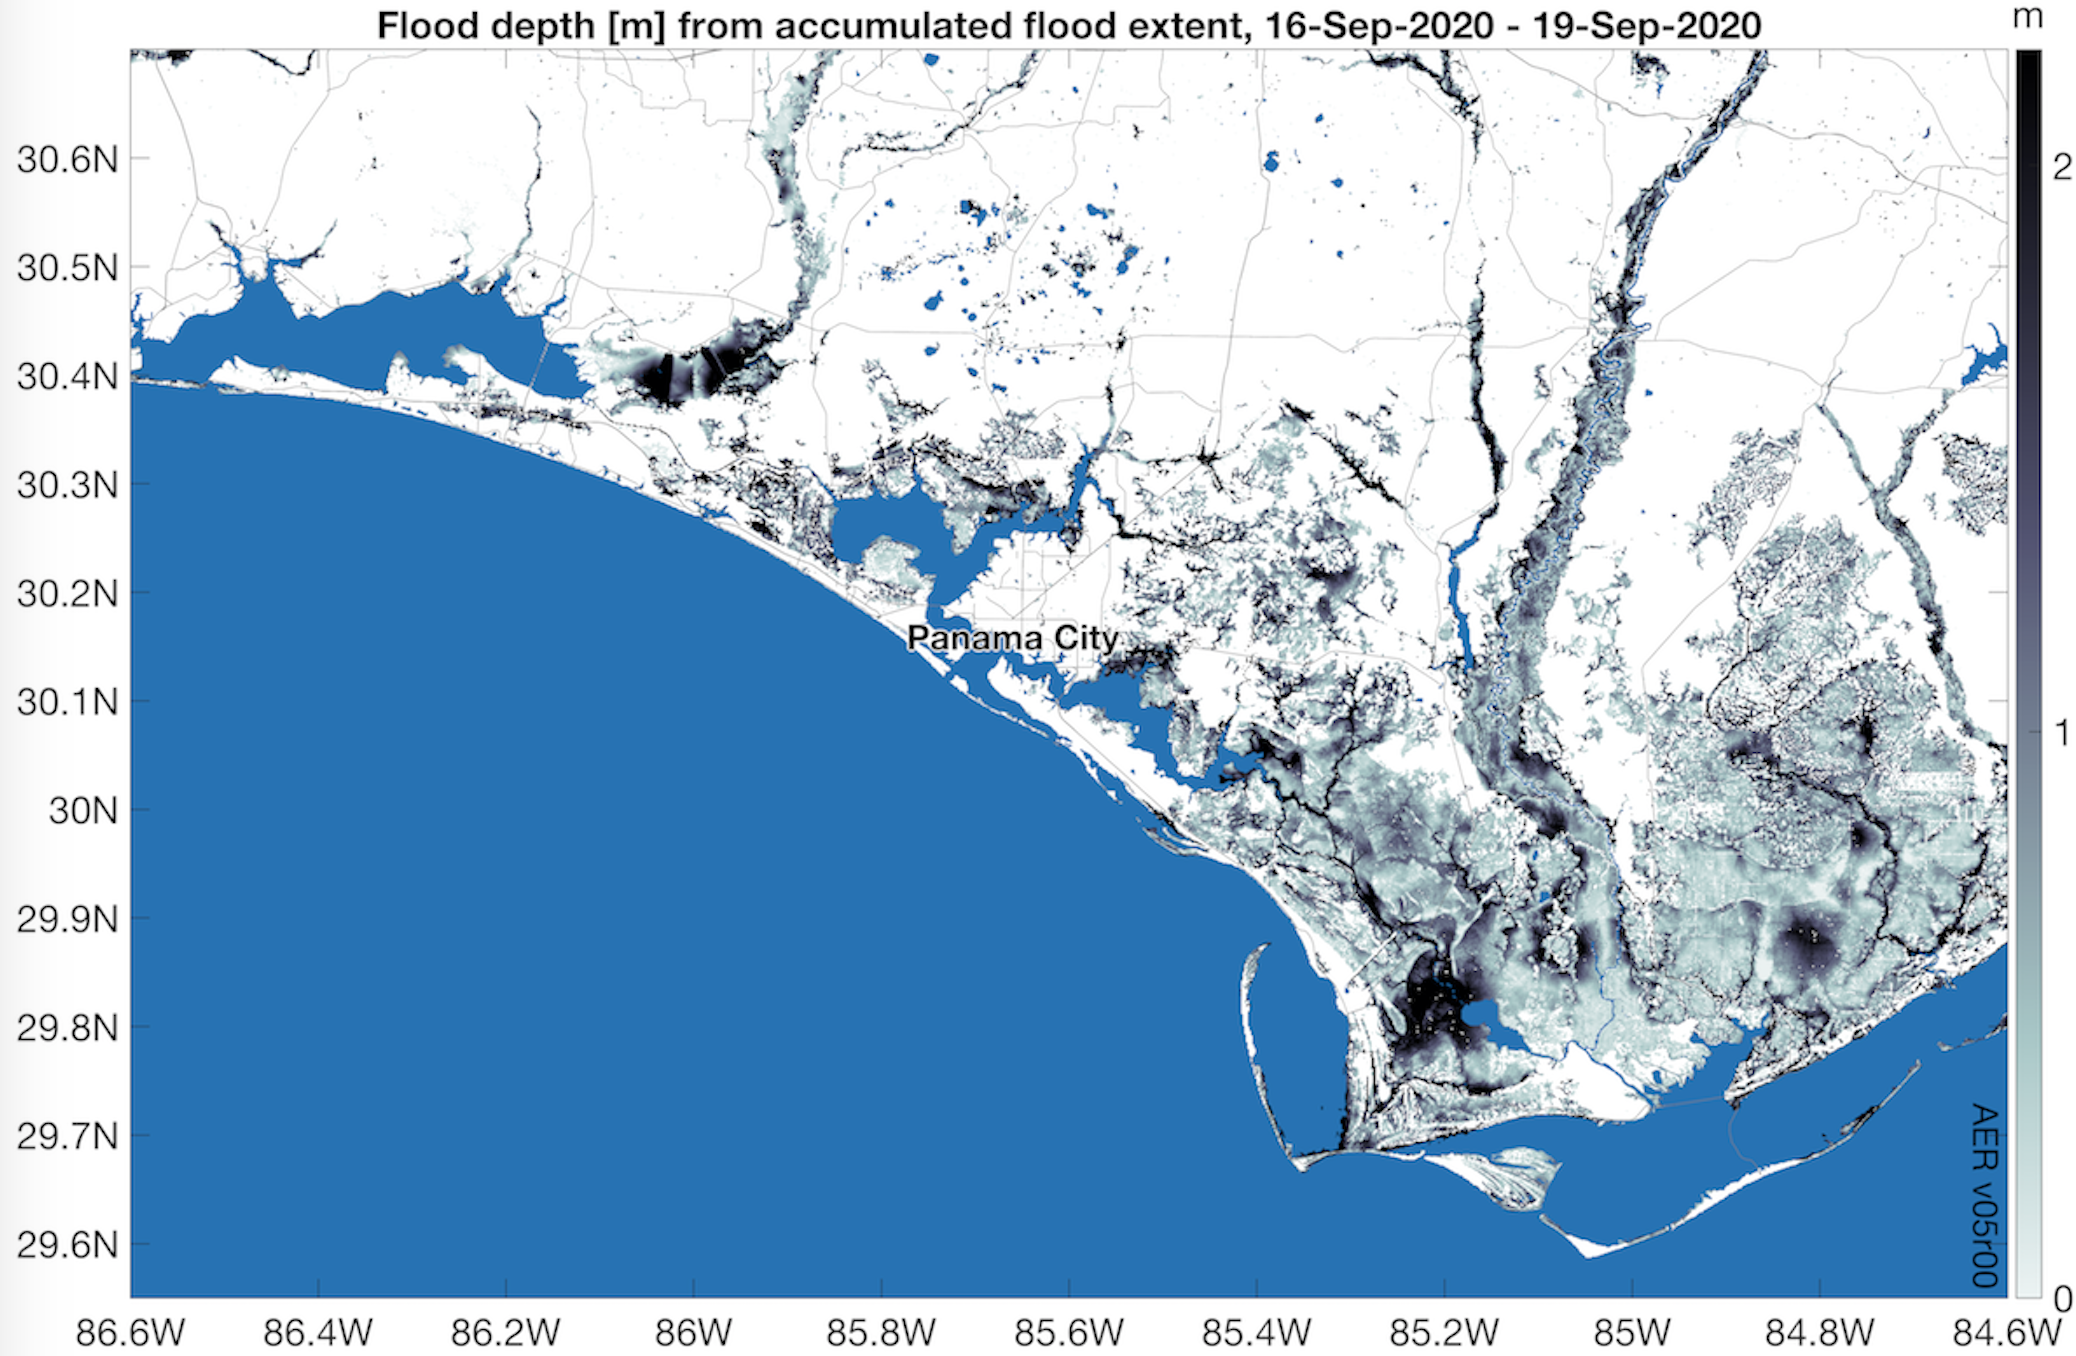
AER FloodScan maps for Sally, below, are based on passive microwave (AMSR2 and GMI) data from Sept. 16-19. The overpass times may not have captured peak flood extent. There is rough correspondence to flooding in the DFO and RAPID maps. FloodScan (downscaling from passive microwave information at much coarser spatial scale) is unlikely to correspond exactly to SAR or optical imagery in coastal wetlands or urban areas for this event due to possible errors in all three types of flood extent mapping. The flood classification maps show a new dual classification approach that includes "marginal" flooding usually excluded in AER standard products to reduce false positives. The depth map extrapolates flooding via topography into adjacent woody wetlands. Both approaches are experimental. Courtesy John F. Galantowicz and AER.
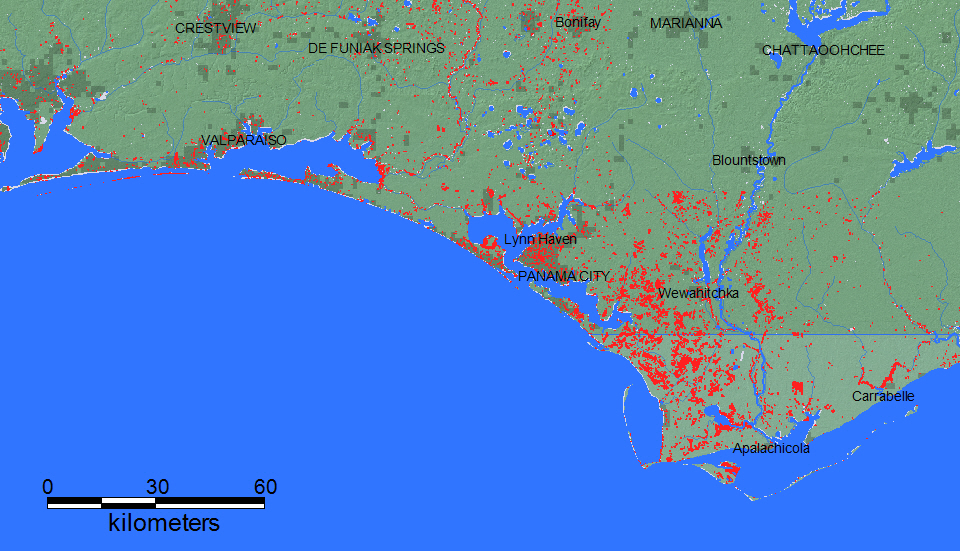
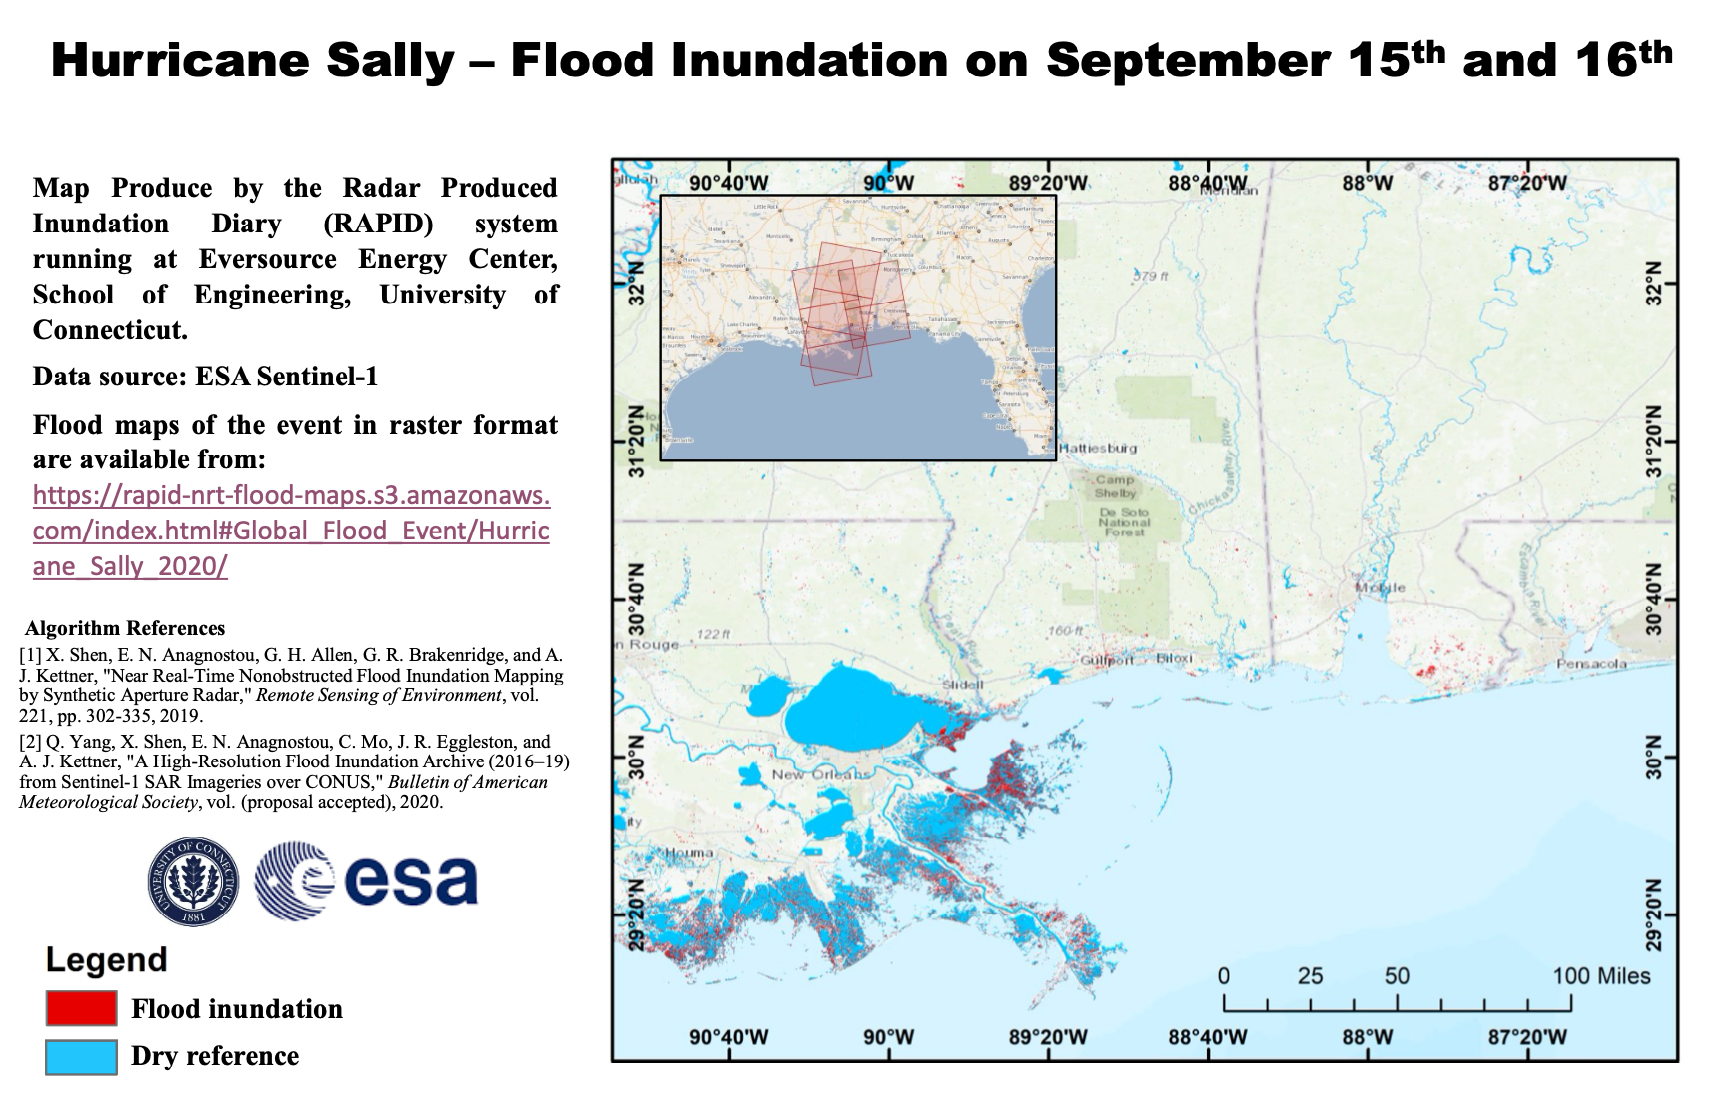
Flood map for Hurricane Sally on September 15th and 16th near the coastal area of Lousiana, Mississippi, and Alabama generated using the RAPID system based on Sentinel-1 SAR images. Detail inundation in raster formats can be found on the AWS gateway at: https://rapid-nrt-flood-maps.s3.amazonaws.com/index.html#Global_Flood_Event/Hurricane_Sally_2020/. Courtesy Xinyi shen and Qing Yang at the University of Connecticut.
The Flood Observatory maintains a Global Active Archive of large flood events, 1985 to present. New major flood events are entered into this archive each week. A hand-drawn GIS polygon for each event outlines the region affected.
This event was selected for Observatory production of map and GIS data products.This web page and associated image and map (GIS) files become the permanent Flood Observatory record of the flood.
As part of collaborations with other organizations, including
GEO and the Global Flood
Partnership, the Observatory's maps are made available here to the public.
Geotif versions and GIS files are also available. With attribution, maps and
data can be used freely for non-commercial purposes. With permission, they can
be used for commercial purposes. Consult the Creative Commons Attribution-NonCommercial-ShareAlike 4.0
International License and Robert.Brakenridge or Albert.Kettner (at
Colorado.edu) if questions. Attribution for this map when Sentinel SAR data are
used: "Dartmouth Flood Observatory at the University of Colorado, from satellite
data provided by NASA and Copernicus/European Space Agency". When using GIS data
(see below) provided to DFO from other sources, please acknowledge original
source.
NASA Landsat 8 and Copernicus/ESA Sentinel SAR data if used in this map were obtained from the the U.S. Geological Survey Hazards Data Distribution System. and the Sentinels Science Data hub, respectively. Landsat 8 is jointly managed by NASA and the United States Geological Survey. Copernicus is supported by the European Commission. MODIS data are obtained from the NASA NRT Global Flood Mapping facility (surface water extents) and from NASA Worldview (image files); SUOMI/VIIRS image data are also retrieved from NASA Worldview.
Flood extent files (Shp or Mapinfo) supporting this Flood Event Map are located here.
These files may include high spatial resolution mapping such as from Sentinel or Landsat, or lower resolution files from MODIS. File names commonly include the sensor source (e.g., S1 for Sentinel 1, LS8 for Landsat, MODIS, Aqua, or Terra for MODIS) and the image date.
The NASA Earth Sciences and Applied Sciences programs, several international development banks, the European Commission's Global Disaster Alert and Coordination System, GDACS, and its Copernicus Emergency Management Service, the Google Earth Engine research awards program, the Committee on Earth Observation Satellites (CEOS) Disasters Working Group-Flood Pilot, the Japanese Space Agency, and the European Space Agency all have supported the Observatory's work via research grants and contracts or free satellite data.
The Dartmouth Flood Observatory was founded by Robert Brakenridge in 1993 at Dartmouth College, Hanover, NH USA and moved to the University of Colorado, INSTAAR, CSDMS in 2010. The institutional support of both universities is gratefully acknowledged.
(counting since September 16, 2020)