


![]()
"India – Over 1.4 Million Hit by Floods in Assam 1 July, 2020 by FloodList. The flood situation continues in the state of Assam, north east India, where diaster athorities say more than 1.4 million people are now affected. Rivers have been overflowing in the state since 20 June in the current spate of flooding. Since then 1.49 million people in 2,235 villages across 23 districts have been affected. Barpeta is still the worst hit district, with 486,709 now people affected, an increase from 135,415 on 2 days earlier. Areas of South Salmara district have recently flooded, with 195,312 people affected. Other hard hit areas include Dhemaji, Nalbari, Morigaon and Goalpara districts, all with between 70,000 and 100,000 residents affected. Assam State Disaster Management Authority (ASDMA) reports that, as of 30 June, 25,461 people were staying in relief camps, which is a fall of around 2,000 from 2 days ago. Over half of those displaced are in Tinsukia district, where 49 camps are housing 14,699 people. ASDMA report 3 more fatalities on 30 June; 2 in Barpeta and one in Dibrugarh. As of 01 July, flood waters, showed some signs of receding in Udalguri and Kamrup districts, but continued in other districts including South Salmara, Dhemaji, Lakhimpur, Dhubri, Nalbari, Barpeta, Kokrajhar, Goalpara, Kamrup, Morigaon, Golaghat, Jorhat, Dibrugarh and Tinsukia. India’s Central Water Commission reported rivers were at “Severe Flood Situation” in 10 locations across the state as of 30 June. However, all were showing a falling or steady trend apart from the Kopili river at Dharamtul, Marigaon district, and the Brahmaputra river at Dhubri and Goalpara. ” Quoted from Flood List
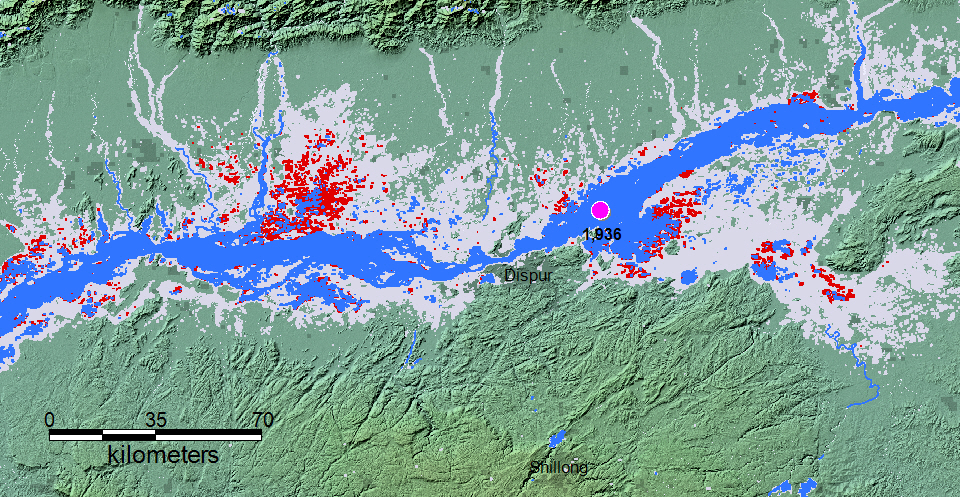
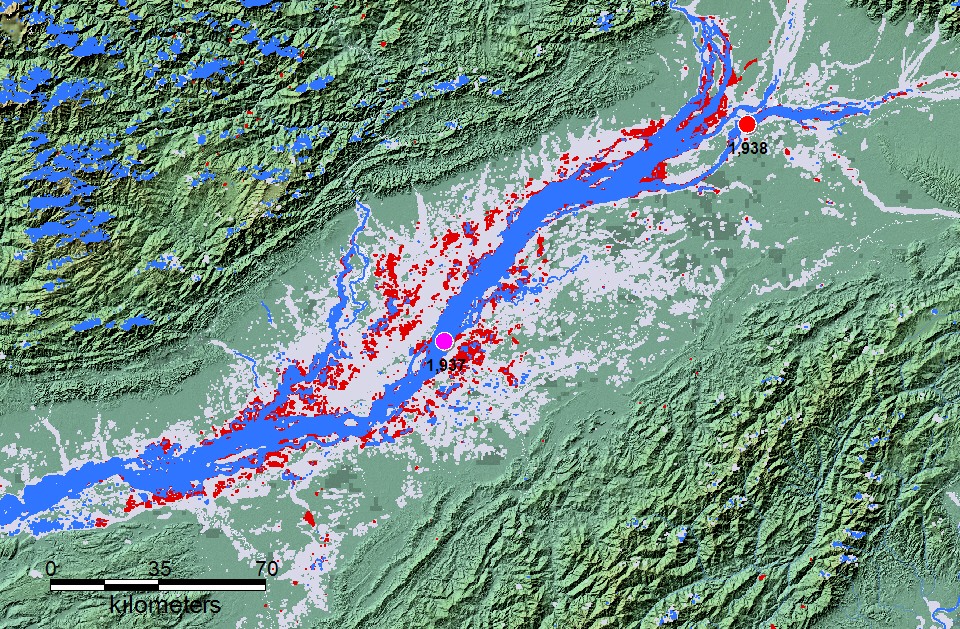
The Flood Observatory maintains a Global Active Archive of large flood events, 1985 to present. New major flood events are entered into this archive each week. A hand-drawn GIS polygon for each event outlines the region affected.
This event was selected for Observatory production of map and GIS data products.This web page and associated image and map (GIS) files become the permanent Flood Observatory record of the flood.
As part of collaborations with other organizations, including
GEO and the Global Flood
Partnership, the Observatory's maps are made available here to the public.
Geotif versions and GIS files are also available. With attribution, maps and
data can be used freely for non-commercial purposes. With permission, they can
be used for commercial purposes. Consult the Creative Commons Attribution-NonCommercial-ShareAlike 4.0
International License and Robert.Brakenridge or Albert.Kettner (at
Colorado.edu) if questions. Attribution for this map when Sentinel SAR data are
used: "Dartmouth Flood Observatory at the University of Colorado, from satellite
data provided by NASA and Copernicus/European Space Agency". When using GIS data
(see below) provided to DFO from other sources, please acknowledge original
source.
NASA Landsat 8 and Copernicus/ESA Sentinel SAR data if used in this map were obtained from the the U.S. Geological Survey Hazards Data Distribution System. and the Sentinels Science Data hub, respectively. Landsat 8 is jointly managed by NASA and the United States Geological Survey. Copernicus is supported by the European Commission. MODIS data are obtained from the NASA NRT Global Flood Mapping facility (surface water extents) and from NASA Worldview (image files); SUOMI/VIIRS image data are also retrieved from NASA Worldview.
Flood extent files (Shp or Mapinfo) supporting this Flood Event Map are located here.
These files may include high spatial resolution mapping such as from Sentinel or Landsat, or lower resolution files from MODIS. File names commonly include the sensor source (e.g., S1 for Sentinel 1, LS8 for Landsat, MODIS, Aqua, or Terra for MODIS) and the image date.
The NASA Earth Sciences Program, the Latin American Development Bank, the World Bank, the European Commission's Global Disaster Alert and Coordination System, GDACS, and Copernicus Emergency Management Service, the Google Earth Engine research awards program, the Committee on Earth Observation Satellites (CEOS) Disasters Working Group-Flood Pilot, the Japanese Space Agency, and the European Space Agency all have supported the Observatory's work via research grants and contracts or free satellite-derived data.
The Dartmouth Flood Observatory was founded by Robert Brakenridge in 1993 at Dartmouth College, Hanover, NH USA and moved to the University of Colorado, INSTAAR, CSDMS in 2010. The institutional support of both universities is gratefully acknowledged.
(counting since July 5, 2020)