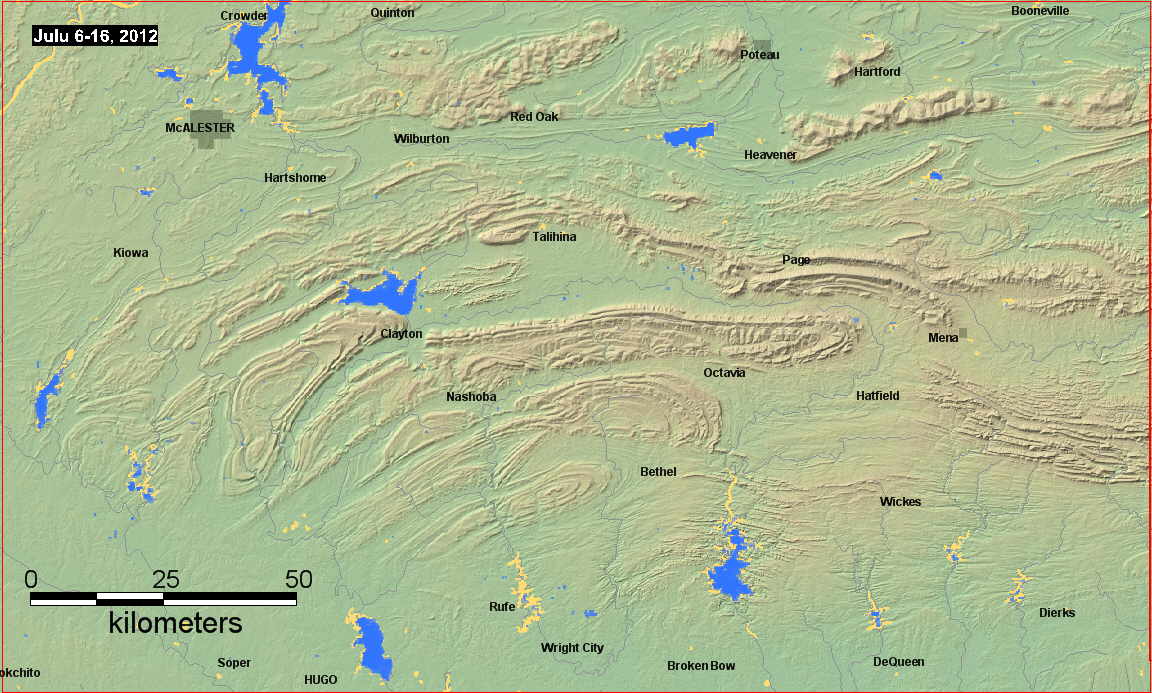


USA, Clayton, Oklahoma
This Critical Areas (Drought) Subset of the Surface Water Record shows areas of reduced surface water during drought, and as observed by NASA's two MODIS sensors.
Yellow is new dry land (formerly mapped as water in the (Shuttle Radar Topography Mission Water Body data), February, 2000. Blue areas include all water observed by MODIS, and as accumulated over 20 days to completely remove obscuration by cloud cover (end date shown in display).
Because the Shuttle water information is at finer spatial resolution than the MODIS, many small areas are not mapped as water by MODIS and will appear as yellow (these do not represent known reduced surface water).
See also the FAQ. Clickable black dots on these displays link to satellite river measurement sites. For the most recent MODIS-based surface water available, see the NASA NRT Experimental Flood Maps. Recent GIS data (daily surface water information) from the automated MODIS-LANCE NRT processor are located at http://csdms.colorado.edu/pub/flood_observatory/MODISlance/. Also, see the technical description, and download Geotif files or the KMZ version for GoogleEarth.

Cite this online map publication as: Brakenridge, G. R. and Kettner, A., date of access, "Critical Areas (Drought) of the Dartmouth Flood Observatory Surface Water Record', Area Name, http://floodobservatory.colorado.edu/CriticalAreas/
(counting since May 17, 2012)