
River and Reservoir Watch Version 4.6
Satellite-Based River Discharge and Reservoir Area Measurements, 1998-Present: Technical Summary
G. Robert Brakenridge and Albert Kettner, INSTAAR/CSDMS, University of Colorado, Boulder, CO, USA
Son V. Nghiem , Jet Propulsion Laboratory, California Institute of Technology, Pasadena, CA, USA
Zsofia Kugler Dept. for Photogrammetry and Geoinformation, Budapest University of Technology and Economics
Tom De Groeve and Stefano Paris, Joint Research Centre of the European Commission, Ispra, Italy
Sagy Cohen, Surface Dynamics Modeling Laboratory, Dept. of Geography, University of Alabama, Tuscaloosa, AL, USA
Updated: May 8, 2024
Cite as: Brakenridge, G.R. and others, 2024, "River and Reservoir Watch Version 4.6, Satellite-Based River Discharge and Reservoir Area Measurements, 1998-Present: Technical Summary". Online document at: http://floodobservatory.colorado.edu/technical.html
In 2024, upgrade to Version 4.6 is in progress. The revisions are proceeding from low to high site numbers.
Introduction
Satellite passive microwave sensors provide global coverage of the Earths land surface on a daily basis and, at certain wavelengths, without major interference from cloud cover. Using a strategy first developed for wide-area optical sensors (see for example: Brakenridge and others, 2005 and Van Dijk and others, 2016), these microwave sensors (e.g. AMSR-E, AMSR-2, TRMM, and GPM) can monitor river discharge and also reservoir surface area changes.
As rivers rise and discharge increases, water area within a satellite gauging reaches ("SGR", a defined reach of the channel and adjacent floodplain) also increases (Brakenridge and others, 2007; Brakenridge and others, 2012). Typically, a single 10 km x 10 km pixel from a near-global, ~daily image is used. The selected pixel is the SGR. Emitted microwave radiation from the SGR is thereby monitored over time.
SGRs include both water (low emission), and land (much higher emission) areas. As the proportion of water area rises, the bulk emitted radiation declines. The microwave signal is thus responsive to flow area and discharge changes. The River Watch system transforms such microwave information into discharge units and as assisted by the use of calibrating information. Reservoir areas can also be monitored: a pixel is selected that monitors the upstream end, if the reservoir is too large to be included within one pixel.
Discharge data (Q, m3/sec) can also be used to calculate surface runoff (commonly expressed as discharged water volume/watershed area/unit time, e.g., mm/day). Runoff and runoff anomalies apply to the contributing watershed, and can be directly compared to measured precipitation, infiltration, and evapotranspiration for the upstream watershed. The River Watch system automatically accomplishes these additional calculations. The variability in monthly and annual watershed runoff can thereby be determined (figure 1).
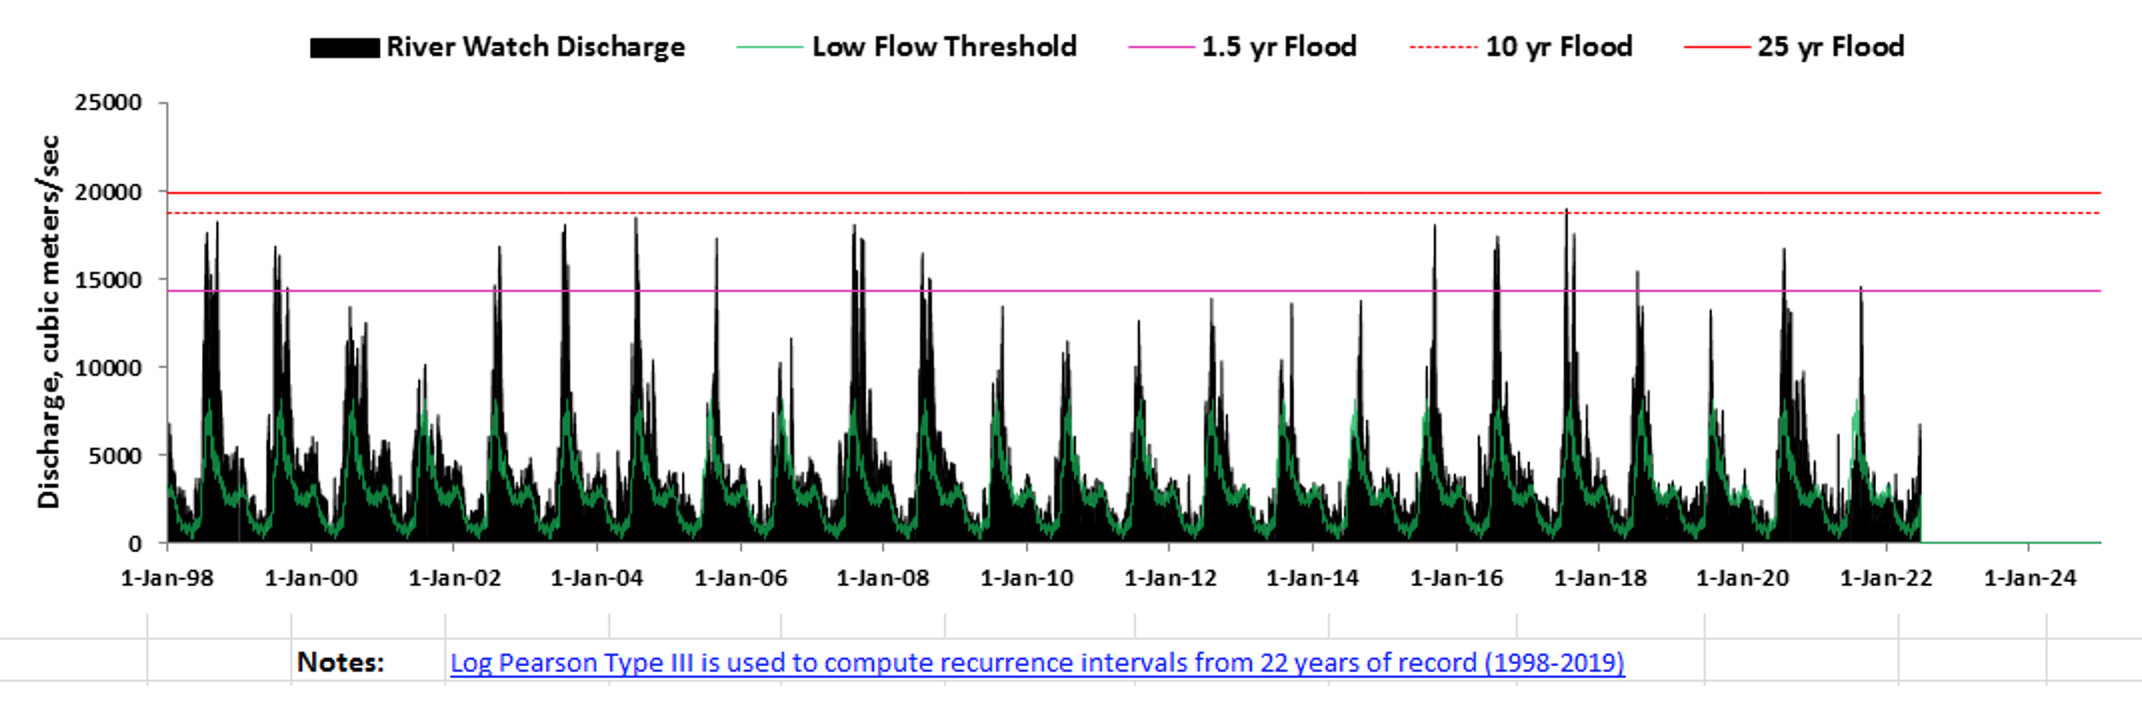
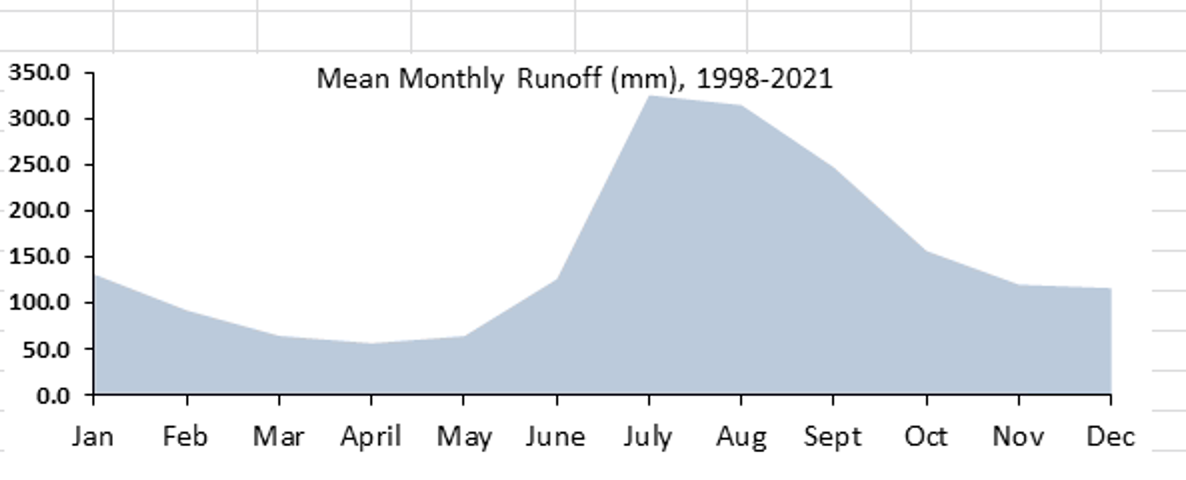
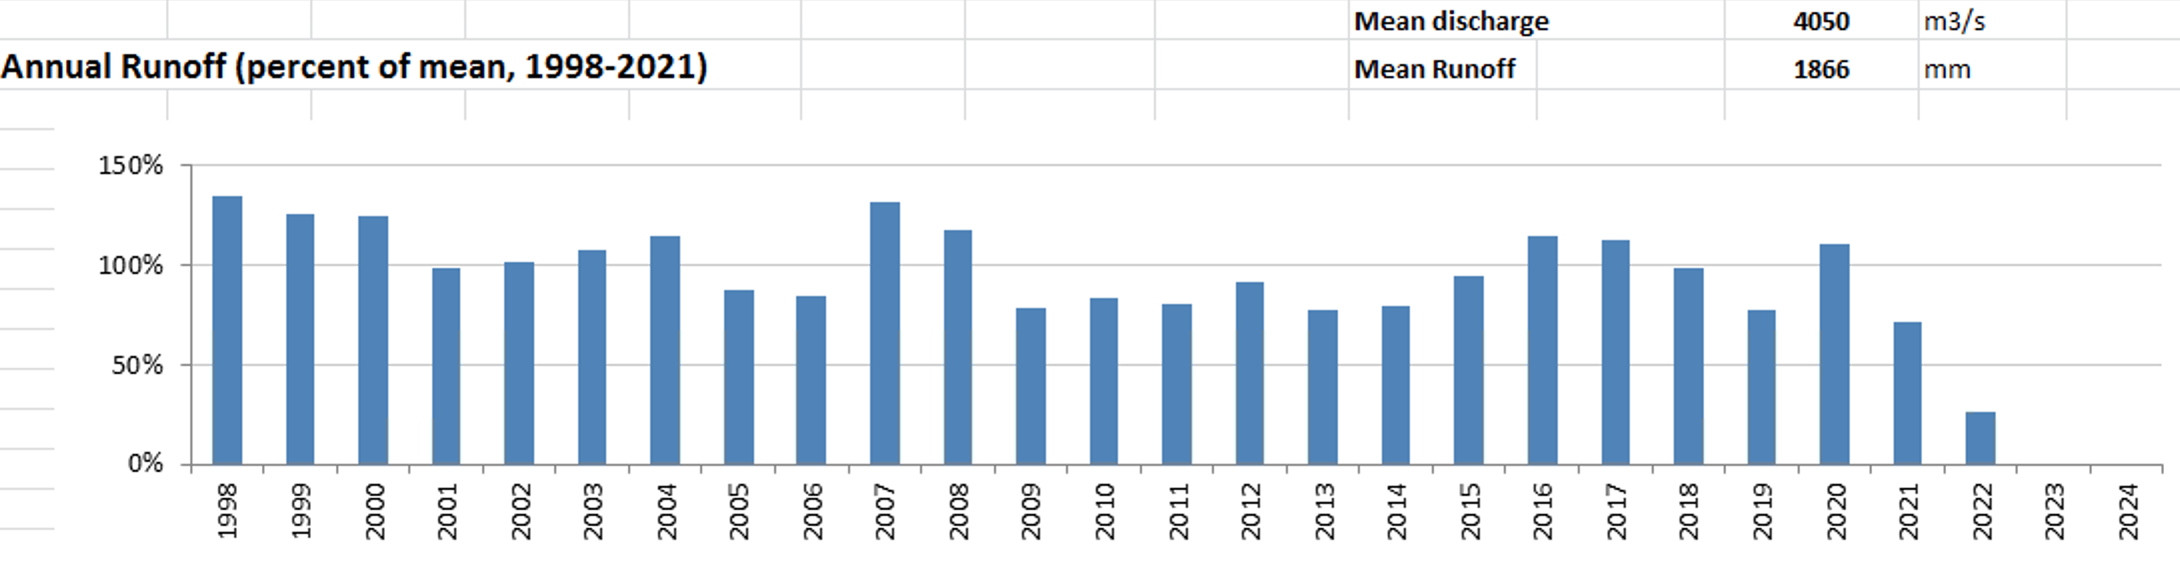
Figure 1. Results: River Watch 4.5, SGR 108, Chindwin River, Myanmar. Top is the daily discharge time series; middle is the average monthly runoff and shows the river flow seasonality; bottom is the time series of total annual runoff and indicates, for example, that drought occurred most recently in 2019.
River Watch Version 4.6 includes fully automated, near real time processing of daily data through at least 2025. For sites below approximately 40 deg latitude, the period of record begins in 1998 and there is no interuption. For higher latitude sites, the records start in 2002. The threshold for moderate flooding is now set to r = 2.33 years to generally agree with the level of the mean annual flood.
Rating Curves for River Discharge
As is the case for river stage (only) measurements from many ground-based stations, the flow area-sensitive signal is valuable information. From such infomation alone, the current flow status of the river can still be determined, or the relative sizes of flood peaks, or the changing durations and severity of low flows during drought. However, transformation of the remote sensing signal to river discharge values is highly desirable, and if the signal/discharge rating equation is later found to exhibit bias by better independent dischrge information, the rating equation can be re-determined. The coefficients of the rating curves (either straight lines or low order polynomial equations) are provided at the bottom of each SGR display.
In most cases, River Watch 4.6 uses independent discharge values obtained by runs of a global runoff model (WBM). Five years (2003-2007) provide abundant model output for calibration: the objective is to provide realistic high, medium, and low flow values for the SGR in m3/sec.. The model produces daily discharge values for these years at each SGR (its global grid resolution is also 10 km). These results can be compared with the remote sensing signal, and a signal-discharge rating curve results. The rating curve equation transforms the daily signal data to discharge values. The equation is either in the form of a simple linear regression or low order, polynomial regression equations. Every equation used is monotonic within the range of discharge and signal variation.
The standard rating curves use monthly maximum, minimum, and mean daily discharges for both model output and the remote sensing (n=180). Earlier research indicated this to be an efficient method to extract daily low, medium, and high model output paired with same-day remote sensing (Brakenridge and others, 2012).We expect scatter in such plots: both model and remote sensing error are included. Thus, global scale modeling may perform poorly at some sites, even while the remote sensing is tracking discharge changes very well. Or the model may inacccurately locate peak discharge in time, even while accurately simulating the magnitude and duration of, for example, large floods. In any case, at most SGRs retained within River Watch, there is strong correlation of the independent, model-based discharge and the remote sensing signal: both are independently tracking actual discharge changes. A linked comparison to the MODIS optical record of visible surface water changes is also provided for each SGR courtesy of NASA WorldView. This can now be used to also extract flood maps for River Watch-identified floods, by adding this layer to the WorldView display and choosing appropriate dates.
Validation is also performed by comparing River Watch discharge output to ground-based gauging station data. In particular, any bias introduced by reliance on WBM model results can be quantified at these locations.
River and Reservoir Watch 4.6 Processing Details
River and Reservoir Watch 4.6 uses the NASA/Japanese Space Agency Advanced Scanning Microwave Radiometer (AMSR-E) band at 36.5 GHz, the NASA/Japanese Space Agency TRMM 37 GHz channel, and 37 GHz information from the new AMSR-2 and GPM sensors. The discharge estimator (the remote sensing signal) is the ratio of the daily calibrating value ("C") that represent the 95th percentile of the day's driest (brightest) emissivity within a 9 pixel x 9 pixel array surrounding the site, and "M", the emissivity from a measurement pixel centered over the river and its floodplain. The 95th percentile for the C array is used instead of simply the "hottest" pixel to exclude extreme outliers.
M/C is very sensitive to changing surface water area within the M pixel. This "spatial ratio" approach removes emission variation that affects all pixels in the area over time (such as seasonal changes in ground surface temperature). The sites within reach of TRMM (between 50 deg N and S) begin in January 1998; they add AMSR-E data when such became available in mid-2002 (the data are merged), they continue using TRMM, only, during the AMSR hiatus in 2012 and early 2013 (between AMSR-E termination and initiation of AMSR-2) and then continue to today using merged AMSR-2 and GPM. The record at higher latitude sites begins in mid-2002 (following launch of AMSR-E). There is gap in 2012-2013 between the termination of AMSR-E and initiation of AMSR-2: no data are available at these locations for this interval.
The gridding algorithm to produce the global daily images is conducted at the Joint Research Centre (JRC); the original data are near real time swath information from each sensor. A JRC document provides further information.
JRC produces a daily global grid at 10 km (near the equator) pixel resolution, and provides daily ratio data for fixed pixels within the (4000 x 2000 pixel) grid. At lower latitudes, the coverage is less than daily from AMSR-E and AMSR-2. River Watch Version 4.6 uses a forward running, 7-day weighted mean to avoid such data gaps. The weighted mean is: mean of: (mean of past 2 days), (mean of previous 5 days). At the JRC, when multiple samples for one pixel are available in one day, the latest sample value is used.
At the Flood Observatory, the ratio data from the JRC are ingested twice each day, and the html displays for each site are updated and added to the Observatory web site at 2:30 and 14:30 Denver, Colorado, time. Each site provides plots of the results and, for Version 4.6, links to the discharge and runoff data. For comparison purposes, a reference 20th percentile of the measured discharge for each day of the year, 2000-2010, is also provided for each day and provides a low flow threshold; also values of the 2.33, 5, and 25 yr recurrence flood discharge are calculated using the annual maximum floods and the Log Pearson III distribution. These provide useful thresholds for evaluating past or present flood magnitudes.
The River Watch approach is novel in that microwave sensors designed to measure other components of the Earth's hydrologic cycle are here employed to directly measure river discharge changes and watershed runoff on the ground. That is: partly in order to observe atmospheric conditions, such as precipitation, ground-sensing channels at ~37 GHz were included on AMSR, TRMM and now GPM: these provide the background component of upwelling microwave radiation against which precipitation can be observed via other microwave frequencies. River Watch uses just the ground-sensing channel.
Satellite Gauging Reach Definition
It is important that the M pixel be large enough and so located as to avoid saturation (complete filling of the measurement pixel by water) during flood events. It is also important that the SGR not inlude other variable water bodies that may change in surface area without directly indicating nearby river discharge change. Local site characteristics are known to strongly affect the sensitvity and signal/noise ratio of this method (as is the case for ground gauging stations). Thus, for nearly rectangular channels, or channels with channel-bounding levees, stage (water level) is a more sensitive indicator of discharge than is flow area. For other morphologies, such as meandering rivers, braided rivers, or anastomosing rivers with large in-channel islands, flow area may be a more robust indicator of dischage than is stage. For meandering morphologies, even relatively small rivers can be accurately measured. For example, the 200 m wide Wabash River at SGR 91 (figure 2).
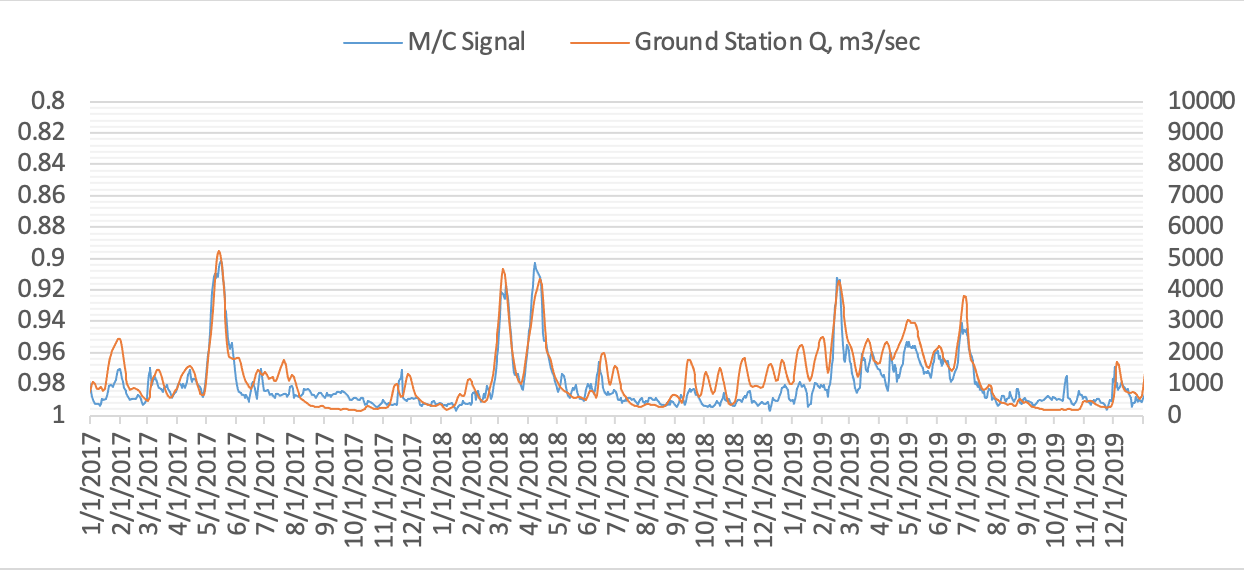
Figure 2, Sensor data (M/C ratio, left axis) directly compared to co-located USGS gauging station data (right axis) for a portion of the SGR 91 record, Wabash River, U.S. This is a 200 m wide meandering river.
Detection of River Ice
The initiation and removal of river ice cover can also be detected: ice breakup immediately affects the M/C ratio as low-emission water replaces ice within the pixel. See Brakenridge and others (2007) for the initial research describing this approach, Brakenridge and others (2012) for updated information, and another technical report by Kugler and De Groeve (2007). Because River Watch uses source data processed at the Joint Research Centre and provided as the signal (M/C) ratio, a special filter is needed to detect ice-covered time periods and remove such from the data output. Both the M and C values exhibit large annual variation as the land warms in the spring and cools in the autumn. At the time of spring warming and ice removal, the values both rise and become nearly identical (ratio approaches 1). Then, the ratio becomes suddenly much smaller, as surface water appears at the site and increases in extent: this is a clear marker for ice breakup. The process reverses in the autumn but is more gradual. We only compute discharge values between the times of these signal maxima. Both the unfiltered and filtered information is shown on each display..
Reservoir Area Change Measurements
Microwave measurement sites can also be located at locations along reservoir margins (generally at their upstream ends) where filling of the reservoir causes expansion of water area. This provides for daiy monitoring of such water bodies without major inteference by cloud cover. Instead of calibrating to discharge, the maximum area observed is determined and the remote sensing, water-area sensitive signal is expressed as a percentage of this maximum. In some cases, such area change monitoring can also be compared to satellite-based altimetry of water height.
Accuracy Assessments
As is the case for ground-based river gauging stations, the accuracy of the results obtained is a complex topic.For example, due to channel morphology changes, either gradually over years of time, or abruptly, after major floods, rating relations may not be stable. Also, differing water resources applications vary widely in their measurement needs. Thus, for some uses, reasonably accurate Q records that extend over a considerable period are much more valuable than extremely accurate data covering only a short period. An asset of River Watch information is the long and consistent time series. It may be the case also that channel changes are less of a source of error because a river reach rather than a flow cross section is being monitored.
It is our goal to reach the same level of accuracy as the USGS standard for its measurements. Thus, USGS (and all its affiliates that provide river data) use stage measurements to compute streamflow, at over 8000 stream gaging stations. USGS policy is to produce measurements precise to the nearest 0.02 ft or 0.2 percent of stage, whichever is greater. Its in-situ Q measurements for rating curve production may often be accurate to ± 5% but can range between ± 2% and ± 20% depending on field conditions. Where solely dependent on the WBM model for calibration, River Watch reaching to at least the 20% criterion will require more rigorous evaluation of the likely bias introduced by using WBM results.
A signal/noise assessment can also computed, as follows: 1) The total observed signal range over 5 years at each River Watch SGR varies, with values as high as .3 (strong signal) to very low values (.01). The former indicates a sensitive site where flow area changes are significant and being observed; the latter a site where noise will ovewhelm any hydrologic signal. 2) The average observed day-to-day departure over 5 years is the "noise" statistic used. Most rivers monitored by River Watch exhibit periods of relatively stable day-to-day flow (even though floods do cause some periods of strong daily variation). Thus, the average daily M/C signal variation may indicate the background level of noise at the site. 3) The ratio of the two provides a measure of signal to noise as defined. Thus, the S/N value compares the signal changes induced by the actual discharge variability, seasonally, and over the 5 year period, to the changes that are produced daily by other variables, including from the sensor itself.
This rating, which refers only to the remote sensing data, was established by computing S/N for all SGRs in the array and assigning a ranking, as follows:
>19, Excellent; >14, Very Good; >9, Good; >4, Fair; <4, Poor
Sample Comparisons to Ground Stations
Comparison of results from satellite gauging sites to co-located ground gauging station data is an ongoing project and is also described in several publications (see links above). Such comparisons continue to indicate the importance of local site factors in affecting accuracy of River Watch output.
There is some evidence of consistent WBM model bias: towards generally higher flood discharges than actually occur, with the difference increasing with higher flow (figure 3). Thus, we anticipate that, even when model and remote sensing time series are very strongly correlated, the model-based rating curves may somewhat over-estimate runoff volumes and daily discharges (especially flood discharges). However, bias in the model-based rating curves should have less effect on the measurement of relative flood peak magnitudes, on the timing and shape of flood hydrographs, on the calculation of the flood recurrence intervals, on the low flow thresholds, and on the other observables, such as flood and low flow duration and seasonality.
In figure 3, the red line rating, based on the ground station, was used in center and right plots. It is clear at this site that the remote sensing discharge indicator (the M/C ratio) closely tracks river discharge as independently measured (red scatter plot). However, it is also clear that reliance on the WBM model rating would result in consistently too-high discharge and runoff values (left plot). Also, and unlike the case at many other satellite gauging sites, the WBM results here are not strongly correlated to the discharge signal (left plot): the global model is not performing well in predicting flow at this location. However, it still provides a "first approximation", though biased, calibration of the M/C signal to discharge units.
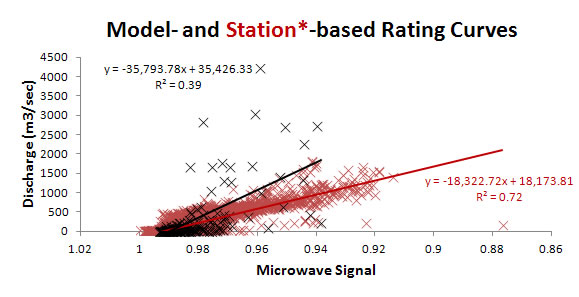
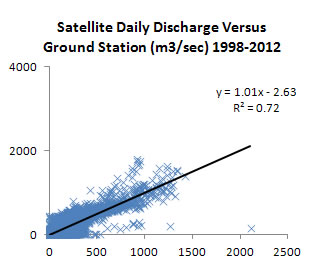
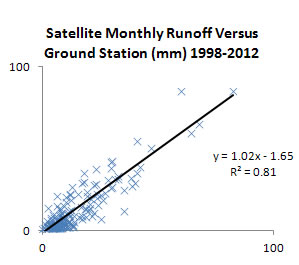
Figure 3: SGR 446, Trinity River, Texas, USA.Left shows two scatter plots and associated model- and ground-based rating equations and simple linear regression R-squared values. WBM model is not well correlated to River Watch information and exhibits positive bias compared to nearby ground gaugint station results. Center (or right) shows the independent daily discharge output of River Watch remote sensing at this site, as compared with the ground gauging station (again the bias introduced by use of WBM is illustrated, but also acceptable tracking of the signal with the discharge measured onthe ground. Bottom shows the independent monthly runoff output, again as compared to that of the ground station.
Other Error Issues
1) In agricultural areas, irrigation of the measurement and comparison pixels can strongly affect the signal. This situation is noted where known on the SGR display. 2) Apparent instrument noise (seen in the signal data as occasional, one day very low ratio values) occasionally produce intermittent positive spikes in discharge. We are working to filter such instrument noise. 3) For high latitude rivers, further work is underway to validate and improve the ice cover detection algorithm.
Using These Data
The discharge and runoff data output from the River Watch Version 4.5 is an experimental product and is provided without any warranty or claim as to its accuracy. The processor uses as its front end the signal data from the Global Flood Detection System (GFDS) at the European Commission's Joint Research Centre (GDACS project). There are many other GFDS measurement sites (~3,000), and abundant opportunities for addition of new SGRs. However, many of the existing GFDS sites are poorly located; some are not located on rivers. The DFO River Watch array is relatively limited in number, but have been individually evaluated as to whether each is providing useful information.
There are many potential uses of these data: including flood warnings, flood and flood risk evaluation, hydropower siting studies, water quality studies, hydrologic trend analysis, and providing longer time series to other sensors with shorter periods of record. However, users should be aware of the limitations. Please contact us if specific applications are planned. Robert.Brakenridge@Colorado.edu is a point of contact.
Acknowledgements
This is a cooperative project between scientists at the University of Colorado, Boulder, CO, USA; at GDACS-GFDS (Global Disaster Alert Coordination System, Global Flood Detection System), European Commission Joint Research Centre, Ispra, Italy; at the University of Alabama; at the Budapest University of Technology and Economics, and at the NASA/Caltech Jet Propulsion Laboratory. DFO at the University of Colorado has been supported in part by grants from NASA. We also thank Dr. Robert Adler, University of Maryland, for his suggestion that the TRMM sensor data could be used in addition to that from AMSR-E.