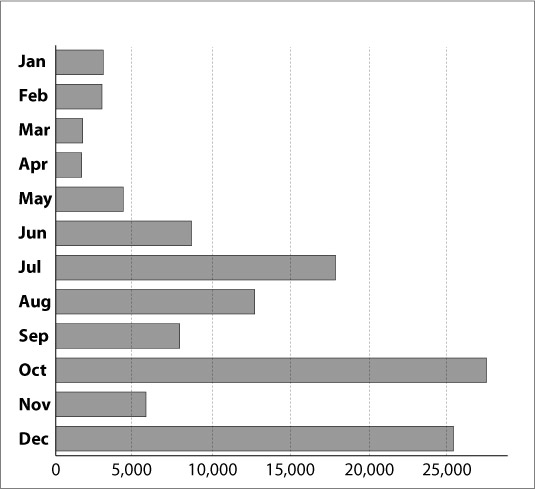
Number of fatalities by MONTH (Synthesis since 1985)
For more information drag
the mouse over the graphic... or
visit our web page presenting analysis methods or go back to the Contents
____________________________________
____________________________________
www.dartmouth.edu/~floods
© 2004 Dartmouth Flood Observatory
____________________________________