The Surface Water Record, Sheet W105N40
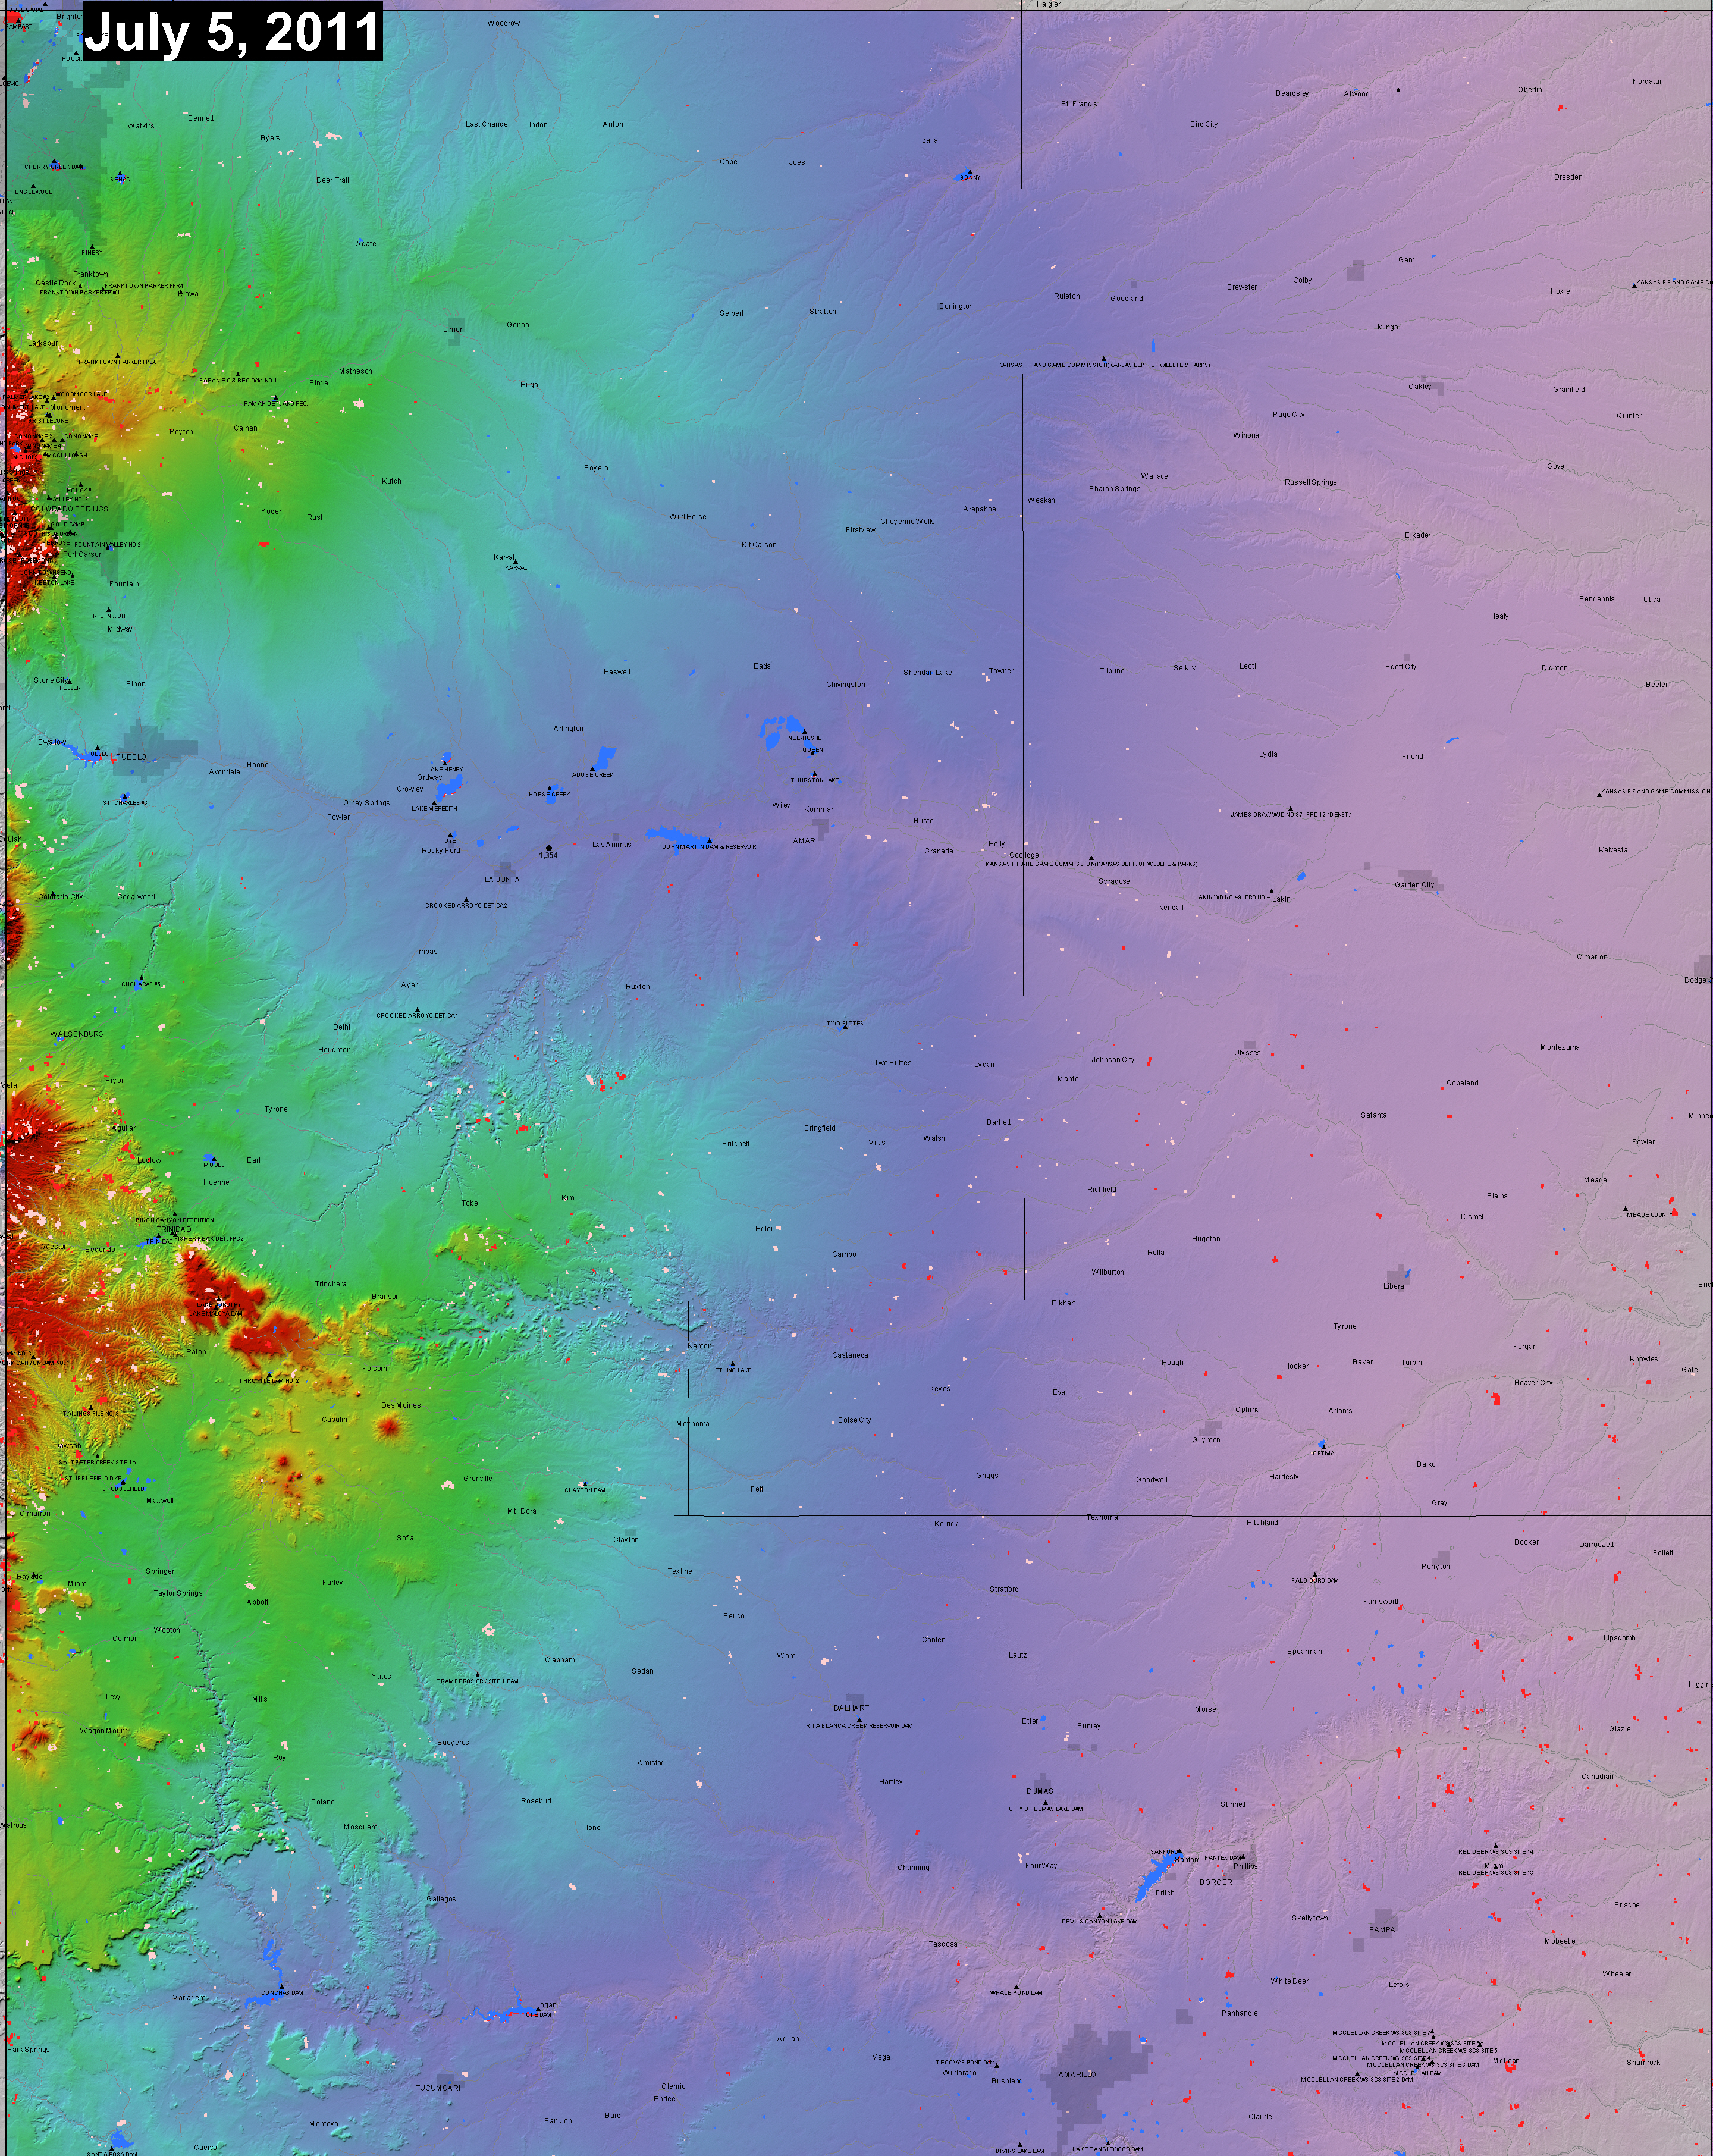
The map shows in light blue the extent of current surface water as imaged by the two MODIS sensors aboard Terra and Aqua. Dark blue illustrates "normal" surface water as imaged by MODIS on a specified date (to be done for this map sheet). Light red areas were flooded this year, prior to the update date, but are now dry land. See also the FAQ.
Shown in dark blue and red is the extent of current surface water as imaged by the two MODIS sensors aboard Terra and Aqua. Water areas are accumulated over 7 days to remove obscuration by cloud cover. Red indicates currently flooded land as compared to (dark blue) a reference date (February, 2000, from the Shuttle Radar Topography Mission Water Body dataset). During flooding, and as the extent of lakes, reservoirs, and rivers expand, red areas appear and increase in size.
Light red areas were flooded this year, prior to the update date, but are now dry land. Light blue area is all now-dry land observed to be inundated by flooding, 2000 to the present year (to be added from DFO records). This MODIS-based observational record may not include all floods: prior to 2011 such records were obtained manually and focus was only on selected major flood events. Clickable black dots link to the experimental AMSR-E river discharge estimates. See also the FAQ
Recent GIS data from the automated MODIS-LANCE NRT processor for this display are located at http://csdms.colorado.edu/pub/flood_observatory/MODISlance/
Other recent GIS data for this display, when produced from the MODIS Rapid Response subsets (commonly, the normal surface water unit), are located in the appropriate subset folder (see http://rapidfire.sci.gsfc.nasa.gov/subsets) at http://csdms.colorado.edu/pub/flood_observatory/GISdata/
See also the technical description of this display, and powerpoint slides.